 🏗️ New Construction
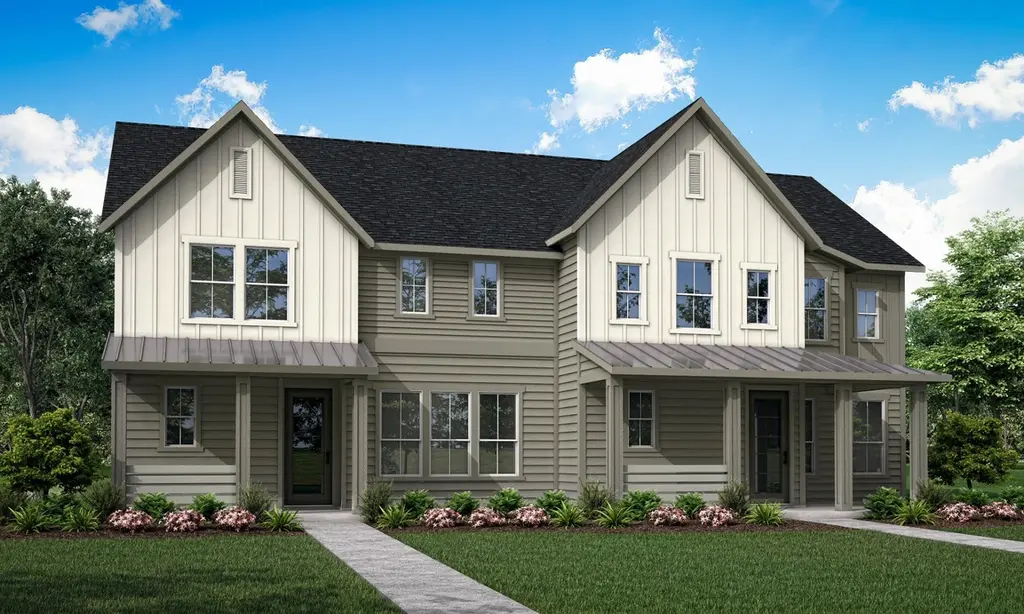
Chicory Plan · Argyle, TX
Flood risk 1/10 · Minimal
- FEMA flood zone
- X (unshaded)
- Chance of flooding over 30 yrs
- 0.0%
- Est. flood insurance / yr
- $507 – $1,088
Fire risk 5/10 · Moderate
- Est. fire insurance / yr
- $1,222 – $2,270
Heat risk 7/10 · Major
- Hot days now (above 109°F)
- 7 days/yr
- Hot days in 30 yrs
- 22 days/yr
Wind risk 4/10 · Minor
- Chance of severe wind over 30 yrs
- 24.0%
Air-quality risk 3/10 · Minor
- Unhealthy air days now
- 3 days/yr
- Unhealthy air days in 30 yrs
- 4 days/yr
Risk factors via First Street. Map © Google.
Why this score? — see what drove the F grade
The composite is a weighted blend of 9 inputs, each scored 0–100. Each bar is that input's sub-score; the figure is the points it added to the 100-point composite (weight × sub-score).
- ARV discount +7.5/15.0
- Schools +6.4/10.0
- Cash flow +6.0/30.0
- Condition / age +4.8/5.0
- Livability +3.2/5.0
- Rent growth +2.9/5.0
- 1% rule +1.9/10.0
- DSCR +0.3/10.0
- Appreciation +0.0/10.0
$366,990
🖨 Deal sheet 📄 Offer letter ✓ Due diligence
Multi-family units
County records classify this as Multi-Family (2-4 Unit). Listing-text estimate: 1 unit. estimate disagrees with records
Listing remarks MLS
The communal areas of the Chicory are all located on the first floor making entertainment and quality time easy. With an open concept home design, the first floor consists of a welcoming foyer that leads into the dining, great room, and kitchen area. All bedrooms are upstairs nestled among the loft - offering a cozy space to connect with our loved ones.
Key facts
- Loft
- Welcoming foyer
- Bedrooms upstairs
Tags
Neighborhood map
What this means for you Summary
Snapshot
- This is a 3-bed/2.5-bath multifamily listed at $367k. Condition is rated excellent.
Deal economics
- At list price, monthly cash flow is $-812 ($-10k/yr) — negative.
- To cash-flow at today's rent, offer at most $303k (17.5% below list).
- To meet the 1% rule (rent ≥ 1% of price), the offer needs to be $292k (20.4% below list).
- Recommended offer: $292k (20.4% below list) — sets the bar for 1% rule.
- Cap rate 4.0% vs local median 3.2% in Argyle — meaningfully above typical; check what's discounted (condition, days-on-market, listing class) to confirm the premium yield is real.
Location & tenants
- Location reads 65/100 on livability (#658 in TX) — a middle-class / working-renter tenant base. Strengths: schools A+, crime A+, employment A+; Watch: amenities F, commute F, cost of living F.
- Argyle ISD (rural): math 71% / reading 67% proficiency, ranked #8 of 826 in TX (top 1%) — acceptable for families but not a draw, mixed tenant base, ~2y average lease; only 13% free/reduced lunch — higher-income household profile.
- Market conditions: Rents rising (+1.6%/yr); 1110 active listings in the ZIP; 38 comparable units currently listed for rent nearby; rentals leasing fast (median 10d on market — plan ~1-2 weeks tenant-placement turnaround); high-income renter base; 10,531 units permitted in Denton County in 2024 (2,713 in 5+ unit buildings).
Forward outlook
- Local home prices are declining (-3.0%/yr); year-one equity from $3k of loan paydown is wiped out by about $13k of value loss. Plan a longer hold.
- Denton County population projected at +66% by 2050 — long-run rental-demand tailwind backs the buy-and-hold thesis.
Negotiation context
- It's been on market 141 days — a 12% lower offer ($323k) is reasonable based on typical stale-listing flexibility.
Risks & watch-outs
- Climate carrying-cost: moderate wildfire risk; extreme-heat days projected 7→22/yr by 2055 (HVAC capex compounding) — expect insurance premiums to compound above CPI over the hold.
Questions for the listing agent
- What do current leases actually rent for vs. the listed asking? Can we see a recent rent roll and the last 12 months of T-12 income?
- It's been on market 141 days. Have you received any prior offers? Is the seller open to a 20% concession, seller financing, or rate buy-down credit?
- What does the HOA fee cover, when was the last increase, and are there any pending special assessments or reserve-fund shortfalls?
- Why hasn't it sold? Are there any deal-killer items the seller is aware of (foundation, flood, title, zoning, code violations)?
- Is there a deadline driving the sale (1031 exchange, divorce, estate, relocation)? That informs how much negotiation room exists.
- Schools are A-rated — typically a magnet for longer-tenancy family renters. What's the average tenant stay here, and is there a school-zone premium baked into asking?
- The area grade is low — what's the realistic commute time and amenity access for the typical tenant pool here? Any planned neighborhood developments (good or bad) we should know about?
- What's the average days-on-market for RENTAL listings here right now (not sales)? A rising rental-DOM trend means longer vacancies and softer asking-rent achievability than the comps imply.
- What's the recent tenant-quality profile in this submarket — average credit score on applications, eviction rate, late-payment / NSF rate, and stable-employment percentage? A property-management company in the area should have these aggregated.
- How much new apartment / multifamily construction is in the pipeline within 1–3 miles? Heavy new supply (>2% of stock underway) typically softens rents 12–24 months out; light construction supports rent growth.
Investment metrics
- 1% rule
- 0.69% ✗
- Cap rate
- 3.98%
- Cash-on-cash
- -8.28%
- DSCR
- 0.63
- GRM
- 12.0
CMA / ARV
- ARV (median comp)
- $420,396
- List price
- $366,990
- Delta
- -12.70%
- Verdict
- UNDERPRICED
- Comps
- 20 within 1.0 mi
Projected returns pro-forma
-3.0% appreciation · 1.61% rent growth · sell at horizon
- IRR
- -32.5%
- Equity multiple
- -0.05×
- Total profit
- $-123,688
- Equity at exit
- $62,682
- IRR
- -47.6%
- Equity multiple
- -0.61×
- Total profit
- $-189,657
- Equity at exit
- $36,348
Cash invested: $117,711 (down + closing). Projections, not guarantees.
Landlord ↔ Tenant lean methodology
- Overall (STATE)
- 87 Strongly Landlord-Friendly
- State Texas
- 87 Strongly Landlord-Friendly · R+5
- County
- — inherits STATE
- City
- — inherits STATE
ZIP-level market 76226
- Home prices YoY
- -24.4%
- Rents YoY
- 1.6%
- Active inventory
- 1110
- Price-to-rent
- 10.5×
Monthly cashflow live
- Estimated rent
- $2,921 high interval (Pro) →
- Mortgage (P&I)
- −$2,205
- Tax est. 1.5%
- −$525 /mo · $6,306/yr
- Insurance
- −$175
- HOA
- −$214
- Vacancy / Maint / Mgmt
- −$613
- Net cashflow
- $-812
Break-even live
UW: 25.0% down · 7.5% · 30yr · 1.5% tax · 5.0% vac · 8.0% maint · 8.0% mgmt
Financing live
Cash to close
- Down payment
- $105,099
- Closing costs
- $12,612
- Reserves months
- —
- Total cash needed
- —
Loan-product check · same deal, 3 products live
Conventional
25% down · 7.5% · 30yr
- Down + closing
- —
- Monthly P&I
- —
- Monthly cashflow
- —
- DSCR
- —
- Eligible?
- —
Personal DTI + credit; lowest rate.
DSCR
20% down · 8.5% · 30yr
- Down + closing
- —
- Monthly P&I
- —
- Monthly cashflow
- —
- DSCR
- —
- Eligible?
- —
No personal income docs; deal must DSCR.
Hard money
10% down · 12.0% · 12mo
- Down + closing
- —
- Monthly P&I
- —
- Monthly cashflow
- —
- DSCR
- —
- Eligible?
- —
Short-term bridge; refi at stabilization.
Rent comps 38 comps
| Address | Beds | Baths | Sqft | Rent | $/sqft | DOM | Units | Dist |
|---|---|---|---|---|---|---|---|---|
| 721 10th St Argyle, TX | 3.0 | 2.0 | 1894 | $2,550 | $1.35 | 43d | 1 | 0.11mi |
| 701 10th St Argyle, TX | 3.0 | 2.0 | 1884 | $2,649 | $1.41 | 43d | 1 | 0.13mi |
| 824 Trailside Ln Argyle, TX | 4.0 | 3.0 | 2453 | $3,250 | $1.32 | 43d | 1 | 0.30mi |
| 816 Trailside Ln Argyle, TX | 3.0 | 2.0 | 1653 | $2,595 | $1.57 | 43d | 1 | 0.32mi |
| 1704 Laurel Ln Argyle, TX | 3.0–4.0 | 2.0–3.5 | 2116 | $2,683 | $1.27 | 1d | 12 | 0.33mi |
| 1804 Laurel Ln Argyle, TX | 4.0 | 4.0 | 2439 | $3,167 | $1.30 | 43d | 1 | 0.36mi |
| 724 4th St Argyle, TX | 3.0 | 2.5 | 2025 | $2,575 | $1.27 | 22d | 1 | 0.40mi |
| 537 Parkside Dr Argyle, TX | 3.0 | 2.5 | 1702 | $2,499 | $1.47 | 24d | 1 | 0.43mi |
| 517 Parkside Dr Argyle, TX | 3.0 | 2.5 | 1691 | $2,500 | $1.48 | 7d | 1 | 0.46mi |
| 512 Parkside Dr Argyle, TX | 3.0 | 2.5 | 2001 | $2,750 | $1.37 | 19d | 1 | 0.46mi |
| 809 Blossom Ln Unit 35 Argyle, TX | 3.0 | 2.5 | 1844 | $2,610 | $1.42 | 22d | 1 | 0.47mi |
| 909 Blossom Ln Unit 51 Argyle, TX | 3.0 | 2.5 | 1844 | $2,704 | $1.47 | 22d | 1 | 0.47mi |
| 1044 3rd St Argyle, TX | 2.0 | 2.0 | 1332 | $2,500 | $1.88 | 24d | 1 | 0.48mi |
| 1029 3rd St Argyle, TX | 2.0 | 2.0 | 1569 | $2,450 | $1.56 | 3d | 1 | 0.50mi |
| 420 4th St Argyle, TX | 3.0 | 2.5 | 2035 | $2,445 | $1.20 | 11d | 1 | 0.52mi |
| 416 4th St Argyle, TX | 3.0 | 2.5 | 2044 | $2,850 | $1.39 | 1d | 1 | 0.52mi |
| 1056 Homestead Way Argyle, TX | 3.0 | 2.5 | 2001 | $2,900 | $1.45 | 1d | 1 | 0.54mi |
| 200 Harvest Way Argyle, TX | 1.0–3.0 | 1.0–2.5 | 1248 | $2,983 | $2.39 | 1d | 248 | 0.64mi |
| 1513 Canary Ln Argyle, TX | 4.0 | 3.0 | 2511 | $3,350 | $1.33 | 12d | 1 | 0.76mi |
| 1712 Friendship Ln Unit NA Argyle, TX | 3.0 | 2.5 | 2400 | $3,950 | $1.65 | 2d | 1 | 0.77mi |
| 916 Dove Cv Argyle, TX | 4.0 | 3.0 | 2263 | $2,995 | $1.32 | 10d | 1 | 0.77mi |
| 1309 E Swan Trl Argyle, TX | 3.0 | 2.0 | 1871 | $2,695 | $1.44 | 1d | 1 | 0.78mi |
| 1821 Waxwing Trl Argyle, TX | 3.0 | 2.0 | 2208 | $2,975 | $1.35 | 10d | 1 | 0.80mi |
| 1450 20th St Northlake, TX | 4.0 | 3.0 | 2476 | $3,850 | $1.55 | 10d | 1 | 0.81mi |
| 1904 Cardinal Way Argyle, TX | 3.0 | 2.0 | 2209 | $3,000 | $1.36 | 3d | 1 | 0.84mi |
| 1809 McGee Ave Argyle, TX | 3.0 | 3.0 | 2571 | $2,950 | $1.15 | 1d | 1 | 0.86mi |
| 1813 McGee Ave Argyle, TX | 4.0 | 3.0 | 2491 | $2,450 | $0.98 | 12d | 1 | 0.87mi |
| 1724 Henderson Dr Argyle, TX | 4.0 | 2.0 | 2044 | $2,486 | $1.22 | 7d | 1 | 0.88mi |
| 1316 Millerbird Way Argyle, TX | 4.0 | 2.0 | 1806 | $2,900 | $1.61 | 1d | 1 | 0.92mi |
| 2108 Blackrail Ct Argyle, TX | 3.0 | 2.0 | 2046 | $2,850 | $1.39 | 4d | 1 | 1.06mi |
| 616 Gannet Trl Argyle, TX | 3.0 | 2.0 | 2169 | $2,800 | $1.29 | 4d | 1 | 1.07mi |
| 605 Gannet Trl Argyle, TX | 3.0 | 2.5 | 2209 | $3,100 | $1.40 | 24d | 1 | 1.11mi |
| 517 Gannet Trl Argyle, TX | 3.0 | 2.0 | 1872 | $2,671 | $1.43 | 43d | 1 | 1.13mi |
| 1012 Kensington Way Argyle, TX | 3.0 | 2.0 | 2130 | $2,800 | $1.31 | 3d | 1 | 1.36mi |
| 1104 Knightsgate Rd Argyle, TX | 4.0 | 2.0 | 2034 | $3,200 | $1.57 | 1d | 1 | 1.38mi |
| 1005 Whitehall Ln Argyle, TX | 3.0 | 2.0 | 2130 | $2,699 | $1.27 | 3d | 1 | 1.44mi |
| 1005 Whitehall Ln Argyle, TX | 3.0 | 2.0 | 2130 | $2,699 | $1.27 | 7d | 1 | 1.44mi |
| 1000 Westwood Ln Argyle, TX | 4.0 | 2.0 | 2037 | $3,050 | $1.50 | 1d | 1 | 1.47mi |
HOA detail
- Monthly dues
- $214 · $2,568/yr
Listing history 15 events
-
2026-06-18days on market $366,990 Active 141 DOM
-
2026-06-17days on market $366,990 Active 140 DOM
-
2026-06-16days on market $366,990 Active 139 DOM
-
2026-06-15days on market $366,990 Active 138 DOM
-
2026-06-13days on market $366,990 Active 136 DOM
-
2026-06-13days on market $366,990 Active 135 DOM
-
2026-06-09days on market $366,990 Active 132 DOM
-
2026-06-08days on market $366,990 Active 131 DOM
-
2026-06-07days on market $366,990 Active 130 DOM
-
2026-06-04days on market $366,990 Active 127 DOM
-
2026-06-03days on market $366,990 Active 126 DOM
-
2026-06-02days on market $366,990 Active 125 DOM
-
2026-06-01days on market $366,990 Active 124 DOM
-
2026-05-31days on market $366,990 Active 123 DOM
-
2026-01-28$366,990 Active 355-char remark
Show marketing remark (355 chars)
The communal areas of the Chicory are all located on the first floor making entertainment and quality time easy. With an open concept home design, the first floor consists of a welcoming foyer that leads into the dining, great room, and kitchen area. All bedrooms are upstairs nestled among the loft - offering a cozy space to connect with our loved ones.
ⓘ Source: listings_history table (triggers on properties + properties_extension) + one-shot
backfill from property_details.listing_events for pre-trigger history.
Climate risk First Street
- Flood 1/10 Low FEMA zone X (unshaded) · 0% chance over 30 yrs
- Wildfire 5/10 Major
- Heat 7/10 Severe 7 d/yr ≥109°F today · 22 d/yr by 30 yrs out
- Wind 4/10 Moderate 24% chance of damaging wind over 30 yrs
- Air quality 3/10 Moderate 3 unhealthy d/yr today · 4 by 30 yrs out
Nearby sold comps map
Loading sold comps map…
Walkable amenities ~0.75 mi
Loading nearby amenities…
Taxation est. · year 1
- Rental income
- $35,048
- − Mortgage interest
- −$23,549
- − Property taxes
- −$6,306
- − Insurance
- −$2,102
- − Repairs & maintenance
- −$2,804
- − Management
- −$2,804
- − HOA
- −$2,568
- − Depreciation
- −$12,230
- Taxable loss
- −$17,314
- Est. tax savings @ 24.0%
- +$4,155
- After-tax cash flow
- $-5,588/yr
For passive investors: Depreciation is non-cash, so a rental often shows a tax loss while cash-flowing — sheltering income. Rental losses are passive: they offset passive income freely, and up to $25,000/yr can offset ordinary (W-2) income if you actively participate and your MAGI is under $100k (phasing out to $0 by $150k); unused losses carry forward. On sale, claimed depreciation is recaptured at up to 25%, and gains may owe capital-gains tax (a 1031 exchange can defer both). Figures are a year-1 estimate at your 24.0% rate — not tax advice; consult a CPA.
Condition & rehab AI · 5 photos
This multi-family home is in excellent condition with no visible repairs needed. It offers a great layout and is move-in ready.
Value-add opportunities
- Both Painting the exterior siding — Fresh paint can enhance curb appeal and property value.
- Both Landscaping improvements — Well-maintained landscaping can increase both resale and rental value.
- Both Interior updates (paint, minor repairs) — Fresh paint and minor repairs can improve the home's appearance and attract more buyers/renters.
Renovation cost estimate screening
Value-add ROI direction
- Both Painting the exterior siding — Fresh paint can enhance curb appeal and property value. ↑
- Both Landscaping improvements — Well-maintained landscaping can increase both resale and rental value. ↑
- Both Interior updates (paint, minor repairs) — Fresh paint and minor repairs can improve the home's appearance and attract more buyers/renters. ↑
ⓘ Cost ranges are severity-bucket heuristics (US national rule-of-thumb). Get contractor quotes + a written scope before underwriting a rehab budget.
Schools (NCES district)
- District
- Argyle ISD
- NCES district ID
- 4808670
- Math proficiency
- 71% ▼ -2.00%
- Reading proficiency
- 67% ▼ -1.00%
- Median HH income
- $108,516
- Composite
- 64.16/100
- National rank
- #568
- State rank
- #8 of 826 in TX
Livability — Argyle
- Score
- 65/100
- State rank
- #658
- US rank
- #12392
Category grades
Schools grade is shown separately in the Schools card above.
Census & demographics
- County
- Denton County · 901,654 people
- City population
- 43,587
- Metro
- Dallas-Fort Worth-Arlington, TX
- Population (ZIP)
- 43,587
- Household income
- $180,982
- Rent vs Own
- Severe rent burden
- 40.0
Population outlook (Denton County) Hauer SSP2
- Today (2025)
- 1,053,010 people
- By 2030
- 1,192,269 · +13.2%
- By 2040
- 1,472,920 · +39.9%
- By 2050
- 1,746,506 · +65.9%
- By 2075
- 2,358,497 · +124.0%
- By 2100
- 2,779,183 · +163.9%
Race, ethnicity, and origin ACS 2023
- Neighborhood character
- Predominantly White (76%)
- Race & ethnicity
- White 76% Hispanic / Latino 10% Two or more races 10% Asian 7% Black 4%
- Hispanic origin (detail)
- Mexican 7%
- Common ancestry
- Italian 3% Romanian 2% Portuguese 2%
- Foreign-born
- 12% · Canada, South Korea, China
- Languages at home
- 87% English-only · Spanish 5% Other Indo-European 3% Other Asian/Pacific 1%
Political lean MEDSL · Denton
- 2024 margin
- R (+13.2) · D 42.7% · R 55.8% · Other 1.5%
- 2008→2024 swing
- +11.0pp toward D · 2008: -24.2pp · 2024: -13.2pp
- All cycles
- 2024: R+13.2 2020: R+8.1 2016: R+20.2 2012: R+31.7 2008: R+24.2
Not yet ingested
- Civics
- —
Market trends
- HPI YoY
- ▼ -81.81%
- Current HPI
- 253.1948
- Rent YoY
- ▲ 1.61%
- Metro
- Dallas-Fort Worth-Arlington, TX
- State GDP YoY
- ▲ 3.95%
- F500 in state
- 110
Industry mix (Fortune 500 HQ in TX)
| Industry | F500 HQs | Revenue |
|---|---|---|
| Energy | 16 | $1,198B |
|
||
| Technology | 5 | $198B |
|
||
| Engineering / Construction | 4 | $72B |
|
||
| Energy Services | 3 | $60B |
|
||
| Utilities | 3 | $41B |
|
||
| Healthcare | 2 | $330B |
|
||
Price history
1 event — show timeline
- 2026-01-28 Listed $366,990 Zillow
Cash-flow waterfall
monthlySold comps — $/sqft
last 12 mo · ≤1 miLoading sold comps…