166 Mulberry St Unit D1 · New York, NY
Flood risk 1/10 · Minimal
- FEMA flood zone
- X (unshaded)
- Chance of flooding over 30 yrs
- 0.0%
- Est. flood insurance / yr
- $507 – $1,088
Fire risk 1/10 · Minimal
- Est. fire insurance / yr
- $691 – $1,283
Heat risk 6/10 · Moderate
- Hot days now (above 99°F)
- 7 days/yr
- Hot days in 30 yrs
- 15 days/yr
Wind risk 6/10 · Moderate
- Chance of severe wind over 30 yrs
- 27.0%
Air-quality risk 4/10 · Minor
- Unhealthy air days now
- 5 days/yr
- Unhealthy air days in 30 yrs
- 7 days/yr
Risk factors via First Street. Map © Google.
Why this score? — see what drove the C+ grade
The composite is a weighted blend of 9 inputs, each scored 0–100. Each bar is that input's sub-score; the figure is the points it added to the 100-point composite (weight × sub-score).
- Cash flow +17.3/30.0
- Appreciation +10.0/10.0
- ARV discount +7.5/15.0
- DSCR +5.4/10.0
- Schools +5.0/10.0
- Rent growth +4.9/5.0
- 1% rule +4.7/10.0
- Livability +3.8/5.0
- Condition / age +2.5/5.0
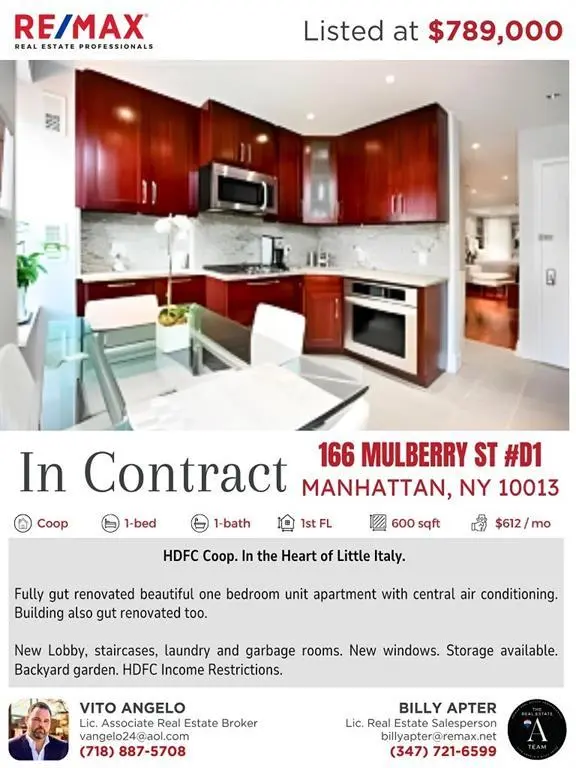
$789,000
🖨 Deal sheet (PDF) 📄 Offer letter ✓ Due diligence
Listing remarks
HDFC Coop. In the Heart of Little Italy. Fully gut renovated beautiful one bedroom unit apartment with central air conditioning. Building also gut renovated too. New Lobby, staircases, laundry and garbage rooms. New windows. Storage available. Backyard garden. HDFC Income Restrictions.
Key facts
- Gut renovated
- New lobby
- Backyard garden
Tags
Neighborhood map
What this means for you Summary
Snapshot
- This is a 1-bed/1.0-bath condo listed at $789k.
Deal economics
- At list price, monthly cash flow is $583 ($7k/yr) — positive.
- The deal already cash-flows at list — no discount required.
- To meet the 1% rule (rent ≥ 1% of price), the offer needs to be $764k (3.2% below list).
- Recommended offer: $764k (3.2% below list) — sets the bar for 1% rule.
- Cap rate 7.2% vs local median 2.6% in New York — top-decile yield for the area; either an underpriced asset or a hidden risk that comps aren't pricing in. Stress-test before assuming the spread holds.
Location & tenants
- Location reads 75/100 on livability (#268 in NY, #4,188 nationally) — a middle-class / working-renter tenant base. Strengths: amenities A+, commute A+, health & safety A; Watch: crime F, cost of living F.
- Market conditions: Rents rising fast (+9.4%/yr); 231 active listings in the ZIP; 40 comparable units currently listed for rent nearby; rentals leasing fast (median 9d on market — plan ~1-2 weeks tenant-placement turnaround); high-income renter base; 4,467 units permitted in New York County in 2024 (4,463 in 5+ unit buildings).
- At $7,641/mo this rent would consume 57% of the median local household income ($161k/yr) (locally 2000% of renters already pay >50% of income on rent) — very limited rent-growth headroom before tenants either downsize or default.
Forward outlook
- In year one you build about $84k of equity ($5k loan paydown + $79k appreciation (10.0% local appreciation)).
- New York County population projected at +21% by 2050 — long-run rental-demand tailwind backs the buy-and-hold thesis.
- At projected returns (10.0% appreciation + 8.0% rent growth), your $221k cash investment doubles in ~3 years — after that, you're playing with house money.
- By year 2, paydown + projected appreciation supports a ~$136k cash-out refi (75% LTV) — recoverable capital for the next deal without selling this one.
Negotiation context
- Only 1 days on market — expect competitive offers; lowballing is unlikely to land.
Risks & watch-outs
- Climate carrying-cost: major wind risk, 27% chance of damaging wind over 30y; extreme-heat days projected 7→15/yr by 2055 (HVAC capex compounding) — expect insurance premiums to compound above CPI over the hold.
Questions for the listing agent
- Any open or pending special assessments — roof, HVAC, plumbing, elevator, façade? What's the per-unit balance and payoff schedule, and is the seller paying it off at close or rolling it to the buyer?
- Is there a deadline driving the sale (1031 exchange, divorce, estate, relocation)? That informs how much negotiation room exists.
- Schools are B-rated — typically a magnet for longer-tenancy family renters. What's the average tenant stay here, and is there a school-zone premium baked into asking?
- Crime grade is F in this area — have there been break-ins, vandalism, or insurance claims at this property in the last 3 years? What carrier currently insures it and at what premium?
- What's the average days-on-market for RENTAL listings here right now (not sales)? A rising rental-DOM trend means longer vacancies and softer asking-rent achievability than the comps imply.
- What's the recent tenant-quality profile in this submarket — average credit score on applications, eviction rate, late-payment / NSF rate, and stable-employment percentage? A property-management company in the area should have these aggregated.
- How much new apartment / multifamily construction is in the pipeline within 1–3 miles? Heavy new supply (>2% of stock underway) typically softens rents 12–24 months out; light construction supports rent growth.
Investment metrics
- 1% rule
- 0.97% ✗
- Cap rate
- 7.18%
- Cash-on-cash
- 3.17%
- DSCR
- 1.14
- GRM
- 8.6
CMA / ARV
No comps found within radius.
Projected returns pro-forma
10.0% appreciation · 8.0% rent growth · sell at horizon
- IRR
- 28.5%
- Equity multiple
- 3.30×
- Total profit
- $507,365
- Equity at exit
- $710,794
- IRR
- 26.3%
- Equity multiple
- 8.08×
- Total profit
- $1,565,145
- Equity at exit
- $1,532,853
Cash invested: $220,920 (down + closing). Projections, not guarantees.
Landlord ↔ Tenant lean methodology
- Overall (CITY)
- 0 Strongly Tenant-Friendly
- State New York
- 15 Strongly Tenant-Friendly · D+10
- County
- — inherits STATE
- City New York
- 0 Strongly Tenant-Friendly · D+34
ZIP-level market 10013
- Home prices YoY
- 4.4%
- Rents YoY
- 9.4%
- Active inventory
- 231
- Price-to-rent
- 8.6×
Monthly cashflow live
- Estimated rent
- $7,641 high interval (Pro) →
- Mortgage (P&I)
- −$4,138
- Tax est. 1.5%
- −$986 /mo · $11,835/yr
- Insurance
- −$329
- HOA
- −$0
- Vacancy / Maint / Mgmt
- −$1,605
- Net cashflow
- $583
Break-even live
Sensitivity live
| Price | -10% $1,129 | -5% $856 | +0% $583 | +5% $311 | +10% $38 |
|---|---|---|---|---|---|
| Rent | -10% $-20 | -5% $282 | +0% $583 | +5% $885 | +10% $1,187 |
| Rate | -1.0pp $981 | -0.5pp $784 | base $583 | +0.5pp $379 | +1.0pp $171 |
UW: 25.0% down · 7.5% · 30yr · 1.5% tax · 5.0% vac · 8.0% maint · 8.0% mgmt
Financing live
Cash to close
- Down payment
- $197,250
- Closing costs
- $23,670
- Reserves months
- —
- Total cash needed
- —
Loan-product check · same deal, 3 products live
Conventional
25% down · 7.5% · 30yr
- Down + closing
- —
- Monthly P&I
- —
- Monthly cashflow
- —
- DSCR
- —
- Eligible?
- —
Personal DTI + credit; lowest rate.
DSCR
20% down · 8.5% · 30yr
- Down + closing
- —
- Monthly P&I
- —
- Monthly cashflow
- —
- DSCR
- —
- Eligible?
- —
No personal income docs; deal must DSCR.
Hard money
10% down · 12.0% · 12mo
- Down + closing
- —
- Monthly P&I
- —
- Monthly cashflow
- —
- DSCR
- —
- Eligible?
- —
Short-term bridge; refi at stabilization.
Rent comps 40 comps
| Address | Beds | Baths | Sqft | Rent | $/sqft | DOM | Units | Dist |
|---|---|---|---|---|---|---|---|---|
| 120 Mulberry St Unit 1257050P New York, NY | 2.0 | 1.0 | 645 | $12,372 | $19.18 | 25d | 1 | 0.16mi |
| 229 Chrystie St New York, NY | 1.0–2.0 | 1.0–2.0 | 810 | $6,120 | $7.56 | 5d | 3 | 0.37mi |
| 11 E 1st St New York, NY | 2.0 | 1.0–2.0 | 1060 | $8,052 | $7.60 | 0d | 1 | 0.41mi |
| 111 Worth St New York, NY | 1.0–2.0 | 1.0–2.0 | 747 | $6,077 | $8.14 | 9d | 7 | 0.44mi |
| 88 Leonard St New York, NY | 1.0 | 1.0 | 598 | $7,966 | $13.32 | 9d | 13 | 0.46mi |
| 125 Delancey St #1523 New York, NY | 1.0–2.0 | 1.0–2.0 | 850 | $7,860 | $9.25 | 3d | 2 | 0.49mi |
| 105 Duane St #183 New York, NY | 2.0 | 1.0–2.0 | 821 | $8,935 | $10.88 | 0d | 3 | 0.56mi |
| 180 Broome St #1521 New York, NY | 1.0–2.0 | 1.0–2.0 | 850 | $7,970 | $9.38 | 3d | 2 | 0.60mi |
| 171 Suffolk St #1265 New York, NY | 1.0–2.0 | 1.0 | 650 | $6,950 | $10.69 | 9d | 2 | 0.63mi |
| 104 MacDougal St Unit 1056263P New York, NY | 2.0 | 1.0 | 441 | $9,375 | $21.26 | 23d | 1 | 0.67mi |
| 10 Downing St #131 New York, NY | 1.0 | 1.0 | 731 | $9,050 | $12.38 | 5d | 2 | 0.71mi |
| 93 1/2 E 7th St Unit 1054297P New York, NY | 2.0 | 1.0 | 495 | $10,000 | $20.20 | 23d | 1 | 0.78mi |
| 112 E 10th St Unit 1021937P New York, NY | 1.0–3.0 | 1.0–2.5 | 1296 | $5,772 | $4.45 | 4d | 2 | 0.84mi |
| 101 E 10th St #1153 New York, NY | 1.0–2.0 | 1.0–2.0 | 575 | $6,630 | $11.53 | 0d | 2 | 0.87mi |
| 364 6th Ave Unit 1023432P New York, NY | 1.0 | 1.0 | 441 | $9,135 | $20.71 | 23d | 1 | 0.88mi |
| 52 Barrow St #2123 New York, NY | 1.0–2.0 | 1.0 | 547 | $6,420 | $11.73 | 11d | 3 | 0.92mi |
| 815 Broadway #204 New York, NY | 1.0 | 1.0 | 522 | $8,250 | $15.80 | 9d | 1 | 0.95mi |
| 400 Chambers St #587 New York, NY | 2.0 | 1.0–1.5 | 675 | $7,370 | $10.91 | 9d | 3 | 0.96mi |
| 180 Water St #537 New York, NY | 1.0–2.0 | 1.0–2.0 | 728 | $8,040 | $11.04 | 4d | 2 | 1.00mi |
| 177 Waverly Pl Unit 1075286P New York, NY | 1.0 | 1.0 | 452 | $10,000 | $22.12 | 25d | 1 | 1.00mi |
| 120 Christopher St #1886 New York, NY | 1.0–2.0 | 1.0 | 574 | $5,640 | $9.82 | 0d | 3 | 1.01mi |
| 209 1st Ave Unit 1370708P New York, NY | 1.0 | 1.0 | 602 | $12,000 | $19.93 | 25d | 1 | 1.01mi |
| 140 Broadway Unit 1298277P New York, NY | 1.0 | 1.0 | 699 | $9,406 | $13.46 | 23d | 1 | 1.03mi |
| 1 Union Sq S #1174 New York, NY | 2.0 | 1.0–2.0 | 775 | $10,120 | $13.06 | 11d | 3 | 1.04mi |
| 139 Christopher St Unit 1021914P New York, NY | 1.0–2.0 | 1.0 | 667 | $5,340 | $8.01 | 9d | 2 | 1.05mi |
| 140 Charles St Unit 14A New York, NY | 1.0 | 1.0 | 648 | $8,000 | $12.35 | 9d | 1 | 1.12mi |
| 535 Hudson St #1032 New York, NY | 1.0–2.0 | 1.0 | 550 | $6,030 | $10.96 | 9d | 2 | 1.12mi |
| 87 Perry St New York, NY | 2.0 | 2.0 | 748 | $18,500 | $24.73 | 25d | 1 | 1.14mi |
| 63 Wall St #1971 New York, NY | 1.0 | 1.0 | 489 | $5,120 | $10.46 | 0d | 2 | 1.16mi |
| 67 Wall St #13 New York, NY | 1.0–2.0 | 1.0 | 636 | $5,750 | $9.03 | 4d | 2 | 1.16mi |
| 75 Wall St Unit 251 New York, NY | 1.0 | 1.5 | 653 | $6,580 | $10.08 | 25d | 1 | 1.17mi |
| 75 Wall St New York, NY | 3.0 | 1.0–3.0 | 452 | $7,598 | $16.81 | 16d | 16 | 1.18mi |
| 95 Wall St New York, NY | 2.0 | 1.0–2.0 | 881 | $5,978 | $6.78 | 0d | 33 | 1.19mi |
| 389 S End Ave New York, NY | 3.0 | 1.0–2.0 | 1080 | $6,685 | $6.19 | 2d | 36 | 1.21mi |
| 10 Hanover Sq New York, NY | 2.0 | 1.0–2.0 | 790 | $5,761 | $7.29 | 0d | 25 | 1.23mi |
| 3 Hanover Sq New York, NY | 3.0 | 1.0–2.0 | 600 | $4,534 | $7.56 | 25d | 5 | 1.23mi |
| 108 W 15th St #205 New York, NY | 1.0–2.0 | 1.0 | 697 | $6,050 | $8.67 | 4d | 2 | 1.25mi |
| 290 W 12th St #1592 New York, NY | 1.0–2.0 | 1.0–2.0 | 515 | $7,110 | $13.81 | 9d | 2 | 1.25mi |
| 346 E 18th St Unit 1254596P New York, NY | 2.0 | 2.0 | 699 | $12,979 | $18.57 | 23d | 1 | 1.26mi |
| 130 W 15th St #1383 New York, NY | 1.0–2.0 | 1.0–2.0 | 844 | $8,990 | $10.65 | 0d | 2 | 1.27mi |
HOA detail condo
- Monthly dues
- $0 · $0/yr
- Likely covers
- trash
- Assessments
- None detected in remarks — confirm with the listing agent.
Listing history 5 events
-
2026-03-31status Pending
-
2026-03-30$789,000 Active
-
2022-02-22price $599,000
-
2022-02-05price $769,000
-
2021-07-15price $789,000
ⓘ Source: listings_history table (triggers on properties + properties_extension) + one-shot
backfill from property_details.listing_events for pre-trigger history.
Climate risk First Street
- Flood 1/10 Low FEMA zone X (unshaded) · 0% chance over 30 yrs
- Wildfire 1/10 Low
- Heat 6/10 Major 7 d/yr ≥99°F today · 15 d/yr by 30 yrs out
- Wind 6/10 Major 27% chance of damaging wind over 30 yrs
- Air quality 4/10 Moderate 5 unhealthy d/yr today · 7 by 30 yrs out
Nearby sold comps map
Loading sold comps map…
Walkable amenities ~0.75 mi
Loading nearby amenities…
Taxation est. · year 1
- Rental income
- $91,687
- − Mortgage interest
- −$44,196
- − Property taxes
- −$11,835
- − Insurance
- −$3,945
- − Repairs & maintenance
- −$7,335
- − Management
- −$7,335
- − Depreciation
- −$22,953
- Taxable loss
- −$5,912
- Est. tax savings @ 24.0%
- +$1,419
- After-tax cash flow
- $8,420/yr
For passive investors: Depreciation is non-cash, so a rental often shows a tax loss while cash-flowing — sheltering income. Rental losses are passive: they offset passive income freely, and up to $25,000/yr can offset ordinary (W-2) income if you actively participate and your MAGI is under $100k (phasing out to $0 by $150k); unused losses carry forward. On sale, claimed depreciation is recaptured at up to 25%, and gains may owe capital-gains tax (a 1031 exchange can defer both). Figures are a year-1 estimate at your 24.0% rate — not tax advice; consult a CPA.
Schools (NCES district)
No district data.
Livability — New York
- Score
- 75/100
- State rank
- #268
- US rank
- #4188
Category grades
Schools grade is shown separately in the Schools card above.
Census & demographics
- Census place
- New York, NY
- County
- New York County · 1,599,927 people
- City population
- 7,731,280
- Metro
- New York-Newark-Jersey City, NY-NJ-PA
- Population (ZIP)
- 27,219
- Household income
- $161,154
- Rent vs Own
- Severe rent burden
- 2000.0
Population outlook (New York County) Hauer SSP2
- Today (2025)
- 1,825,725 people
- By 2030
- 1,904,611 · +4.3%
- By 2040
- 2,052,719 · +12.4%
- By 2050
- 2,206,601 · +20.9%
- By 2075
- 2,509,427 · +37.4%
- By 2100
- 2,702,933 · +48.0%
Race, ethnicity, and origin ACS 2023
- Neighborhood character
- Diverse neighborhood (Simpson 0.62)
- Race & ethnicity
- White 53% Asian 31% Hispanic / Latino 8% Two or more races 7% Black 3%
- Hispanic origin (detail)
- Mexican 1%
- Common ancestry
- Scotch-Irish 4% Romanian 3% Scandinavian 3%
- Foreign-born
- 31% · China, Canada, South Korea
- Languages at home
- 65% English-only · Chinese 19% Other Indo-European 7% Spanish 3%
Political lean MEDSL · New York
- 2024 margin
- Solid D (+64.8) · D 82.4% · R 17.6%
- 2008→2024 swing
- -7.4pp toward R · 2008: 72.2pp · 2024: 64.8pp
- All cycles
- 2024: D+64.8 2020: D+74.5 2016: D+77.2 2012: D+69.6 2008: D+72.2
Not yet ingested
- Civics
- —
Market trends
- HPI YoY
- ▲ 10.12%
- Current HPI
- 239.8397
- Rent YoY
- ▲ 9.40%
- Metro
- New York-Newark-Jersey City, NY-NJ-PA
- State GDP YoY
- ▲ 2.60%
- F500 in state
- 92
Industry mix (Fortune 500 HQ in NY)
| Industry | F500 HQs | Revenue |
|---|---|---|
| Financial Services | 10 | $950B |
|
||
| Consumer Goods | 9 | $162B |
|
||
| Insurance | 4 | $225B |
|
||
| Telecommunications | 2 | $144B |
|
||
| Pharmaceuticals | 2 | $112B |
|
||
| Media / Entertainment | 2 | $69B |
|
||
Price history
+0.0% since first listed5 events — show timeline
- 2026-03-31 Pending — BNYMLS
- 2026-03-30 Listed $789,000 BNYMLS
- 2022-02-22 Price Changed $599,000 BNYMLS
- 2022-02-05 Price Changed $769,000 BNYMLS
- 2021-07-15 Price Changed $789,000 BNYMLS
Cash-flow waterfall
monthlySold comps — $/sqft
last 12 mo · ≤1 miLoading sold comps…