 🏷️ Likely Rental
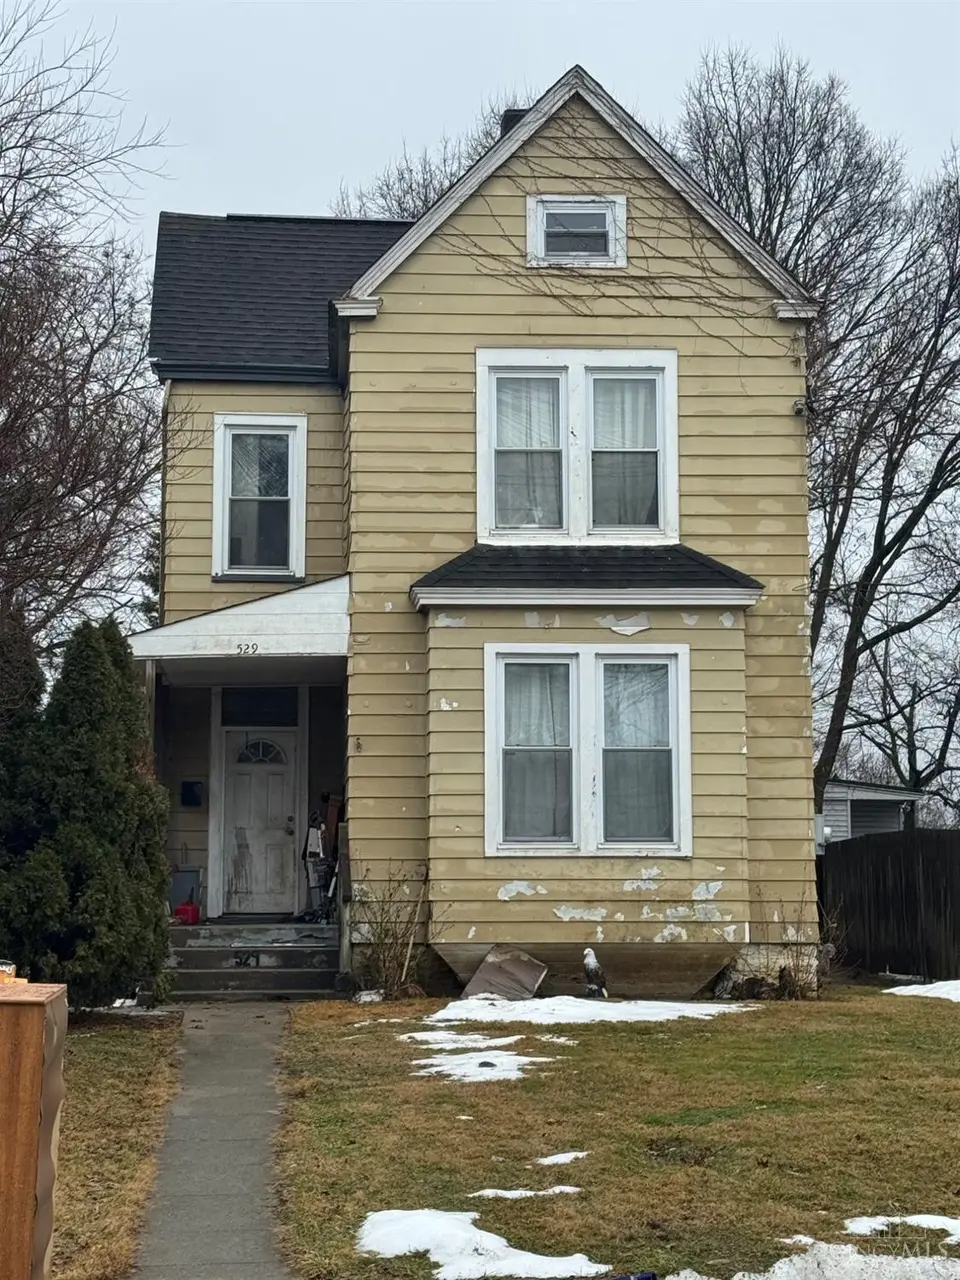
529 Elliott Ave · Arlington Heights, OH
Flood risk 1/10 · Minimal
- FEMA flood zone
- X (unshaded)
- Chance of flooding over 30 yrs
- 0.0%
- Est. flood insurance / yr
- $473 – $860
Fire risk 1/10 · Minimal
- Est. fire insurance / yr
- $713 – $1,323
Heat risk 5/10 · Moderate
- Hot days now (above 103°F)
- 7 days/yr
- Hot days in 30 yrs
- 19 days/yr
Wind risk 2/10 · Minimal
- Chance of severe wind over 30 yrs
- 1.0%
Air-quality risk 3/10 · Minor
- Unhealthy air days now
- 2 days/yr
- Unhealthy air days in 30 yrs
- 3 days/yr
Risk factors via First Street. Map © Google.
Why this score? — see what drove the B+ grade
The composite is a weighted blend of 9 inputs, each scored 0–100. Each bar is that input's sub-score; the figure is the points it added to the 100-point composite (weight × sub-score).
- Cash flow +30.0/30.0
- ARV discount +15.0/15.0
- 1% rule +10.0/10.0
- DSCR +10.0/10.0
- Rent growth +4.5/5.0
- Livability +3.7/5.0
- Condition / age +2.5/5.0
- Schools +1.6/10.0
- Appreciation +0.0/10.0
$119,900
🖨 Deal sheet 📄 Offer letter ✓ Due diligence
Listing remarks MLS
The property is tenant occupied. Current tenant is month to month and pays $1100 plus all utilities. The home is part of a portfolio that can be sold separate or together.HVAC, electric and plumbing updated within last 5 years.
Key facts
- Plumbing updated
- Hvac updated
- Electric updated
Tags
Neighborhood map
What this means for you Summary
Snapshot
- This is a 4-bed/1.0-bath single-family listed at $120k.
Deal economics
- At list price, monthly cash flow is $692 ($8k/yr) — positive.
- The deal already cash-flows at list — no discount required.
- Meets the 1% rule at list price ($2k rent vs $120k).
- Recommended offer: $106k (12.0% below list) — sets the bar for market timing.
Location & tenants
- Location reads 73/100 on livability (#334 in OH) — a middle-class / working-renter tenant base. Strengths: commute A+, cost of living A+, housing A-; Watch: health & safety C-, crime D, schools D-.
- Lockland Local (suburban): math 16% / reading 23% proficiency, ranked #632 of 656 in OH (top 96%) — low school quality limits family demand, transient renter base, plan for 1-2y turnover; 79% free/reduced lunch — lower-income household profile, screen leases tightly.
- Market conditions: Rents rising fast (+8.0%/yr); 47 active listings in the ZIP; 6 comparable units currently listed for rent nearby; rentals at typical pace (median 24d on market — plan ~3-4 weeks tenant-placement turnaround); 801 units permitted in Hamilton County in 2024 (190 in 5+ unit buildings).
- This rent runs 33% of the median local income ($69k/yr) — at the standard rent-burdened threshold; future hikes will face affordability resistance.
Forward outlook
- Local home prices are declining (-3.0%/yr); year-one equity from $829 of loan paydown is wiped out by about $4k of value loss. Plan a longer hold.
- At projected returns (-3.0% appreciation + 8.0% rent growth), your $34k cash investment doubles in ~5 years — after that, you're playing with house money.
Negotiation context
- It's been on market 126 days — a 12% lower offer ($106k) is reasonable based on typical stale-listing flexibility.
- 4 sale attempts since 19y ago; this cycle's ask has dropped $20k (14%) from the opening price — seller is motivated, your offer sets the floor, not the list.
- Current owner paid $10k; list at $120k implies a 1042% gain — meaningful room to come down on a strong offer.
Risks & watch-outs
- Watch-outs: built in 1890 — expect roof / HVAC / electrical / plumbing capex.
- Climate carrying-cost: extreme-heat days projected 7→19/yr by 2055 (HVAC capex compounding) — expect insurance premiums to compound above CPI over the hold.
Questions for the listing agent
- It's been on market 126 days. Have you received any prior offers? Is the seller open to a 12% concession, seller financing, or rate buy-down credit?
- Built in 1890 — when were the roof, HVAC, electrical panel, plumbing, and water heater last replaced?
- Why hasn't it sold? Are there any deal-killer items the seller is aware of (foundation, flood, title, zoning, code violations)?
- Is there a deadline driving the sale (1031 exchange, divorce, estate, relocation)? That informs how much negotiation room exists.
- Schools are D-rated, which usually means shorter tenancies and higher turnover. Who's the typical renter profile here, and what's been the actual vacancy rate?
- Crime grade is D in this area — have there been break-ins, vandalism, or insurance claims at this property in the last 3 years? What carrier currently insures it and at what premium?
- What's the average days-on-market for RENTAL listings here right now (not sales)? A rising rental-DOM trend means longer vacancies and softer asking-rent achievability than the comps imply.
- What's the recent tenant-quality profile in this submarket — average credit score on applications, eviction rate, late-payment / NSF rate, and stable-employment percentage? A property-management company in the area should have these aggregated.
- How much new for-sale + rental construction is in the pipeline within 1–3 miles? Heavy new supply typically softens prices + rents 12–24 months out; constrained supply supports both.
Investment metrics
- 1% rule
- 1.57% ✓
- Cap rate
- 13.22%
- Cash-on-cash
- 24.75%
- DSCR
- 2.10
- GRM
- 5.3
CMA / ARV
- ARV (median comp)
- $197,851
- List price
- $119,900
- Delta
- -39.40%
- Verdict
- UNDERPRICED
- Comps
- 20 within 1.0 mi
Show comp detail 12 sales within ~0.75 mi
| Address | Dist | Beds/Ba | Sqft | Sold | Price | $/sf | Match |
|---|---|---|---|---|---|---|---|
| 230 Ohio Cir | 0.36mi | 4/2.0 | 1,675 (-0%) | 11mo | $265,000 | $158 | 69 |
| 639 Arlington Ave | 0.17mi | 3/1.0 (-1) | 1,532 (-9%) | 11mo | $145,000 | $95 | 64 |
| 314 Elm St | 0.70mi | 4/1.0 | 1,651 (-2%) | 2mo | $159,900 | $97 | 63 |
| 410 Rolef Ave | 0.35mi | 4/2.0 | 1,818 (+8%) | 5mo | $222,500 | $122 | 62 |
| 8420 Anthony Wayne Ave | 0.37mi | 3/1.5 (-1) | 1,768 (+5%) | 15mo | $172,500 | $98 | 55 |
| 364 Elliott Ave | 0.27mi | 5/2.0 (+1) | 1,555 (-7%) | 15mo | $100,150 | $64 | 53 |
| 7755 Newbedford Ave | 0.75mi | 4/2.5 | 1,698 (+1%) | 7mo | $286,600 | $169 | 52 |
| 653 Harmes Ave | 0.67mi | 3/2.0 (-1) | 1,560 (-7%) | 4mo | $227,500 | $146 | 44 |
| 7829 Sunfield Dr | 0.66mi | 3/2.0 (-1) | 1,555 (-7%) | 4mo | $265,000 | $170 | 44 |
| 711 S Cooper Ave | 0.73mi | 3/1.0 (-1) | 1,590 (-5%) | 14mo | $225,000 | $142 | 40 |
| 7829 Greenland Pl | 0.68mi | 3/1.5 (-1) | 1,467 (-13%) | 10mo | $162,000 | $110 | 32 |
| 400 Bradley Ave | 0.71mi | 3/2.0 (-1) | 1,478 (-12%) | 15mo | $235,000 | $159 | 25 |
Match score weights: distance 35% · size 25% · config 20% · recency 20%. Top-matched comps best support the ARV.
Projected returns pro-forma
-3.0% appreciation · 8.0% rent growth · sell at horizon
- IRR
- 23.6%
- Equity multiple
- 2.03×
- Total profit
- $34,602
- Equity at exit
- $17,877
- IRR
- 34.5%
- Equity multiple
- 4.94×
- Total profit
- $132,136
- Equity at exit
- $10,367
Cash invested: $33,572 (down + closing). Projections, not guarantees.
Landlord ↔ Tenant lean methodology
- Overall (STATE)
- 73 Landlord-Friendly
- State Ohio
- 73 Landlord-Friendly · R+6
- County
- — inherits STATE
- City
- — inherits STATE
ZIP-level market 45215
- Rents YoY
- 8.0%
- Active inventory
- 47
- Price-to-rent
- 5.3×
Monthly cashflow live
- Estimated rent
- $1,879 high interval (Pro) →
- Mortgage (P&I)
- −$629
- Tax from tax record
- −$114 /mo · $1,364/yr
- Insurance
- −$50
- HOA
- −$0
- Vacancy / Maint / Mgmt
- −$395
- Net cashflow
- $692
Break-even live
UW: 25.0% down · 7.5% · 30yr · 1.5% tax · 5.0% vac · 8.0% maint · 8.0% mgmt
Financing live
Cash to close
- Down payment
- $29,975
- Closing costs
- $3,597
- Reserves months
- —
- Total cash needed
- —
Loan-product check · same deal, 3 products live
Conventional
25% down · 7.5% · 30yr
- Down + closing
- —
- Monthly P&I
- —
- Monthly cashflow
- —
- DSCR
- —
- Eligible?
- —
Personal DTI + credit; lowest rate.
DSCR
20% down · 8.5% · 30yr
- Down + closing
- —
- Monthly P&I
- —
- Monthly cashflow
- —
- DSCR
- —
- Eligible?
- —
No personal income docs; deal must DSCR.
Hard money
10% down · 12.0% · 12mo
- Down + closing
- —
- Monthly P&I
- —
- Monthly cashflow
- —
- DSCR
- —
- Eligible?
- —
Short-term bridge; refi at stabilization.
Rent comps 6 comps
| Address | Beds | Baths | Sqft | Rent | $/sqft | DOM | Units | Dist |
|---|---|---|---|---|---|---|---|---|
| 8346 Anthony Wayne Ave Cincinnati, OH | 3.0 | 2.0 | 1716 | $1,750 | $1.02 | 23d | 1 | 0.37mi |
| 332 Arlington Ave Cincinnati, OH | 3.0 | 2.0 | 1500 | $1,750 | $1.17 | 17d | 1 | 0.51mi |
| 7844 Glenorchard Dr Cincinnati, OH | 4.0 | 2.0 | 1400 | $1,800 | $1.29 | 14d | 1 | 0.61mi |
| 1634 Crest Hill Ave Unit 1 Cincinnati, OH | 5.0 | 2.0 | 2000 | $1,600 | $0.80 | 23d | 1 | 0.70mi |
| 1 E Lake Shore Dr Cincinnati, OH | 1.0–3.0 | 1.0–2.0 | 845 | $1,720 | $2.04 | 1d | 54 | 0.79mi |
| 301 W Benson St Unit 6 Cincinnati, OH | 3.0 | 2.0 | 1500 | $1,995 | $1.33 | 43d | 1 | 0.84mi |
Listing history 26 events
-
2026-06-18days on market $119,900 Active 126 DOM
-
2026-06-17days on market $119,900 Active 125 DOM
-
2026-06-16days on market $119,900 Active 124 DOM
-
2026-06-15days on market $119,900 Active 123 DOM
-
2026-06-13days on market $119,900 Active 121 DOM
-
2026-06-09days on market $119,900 Active 117 DOM
-
2026-06-08days on market $119,900 Active 116 DOM
-
2026-06-07days on market $119,900 Active 115 DOM
-
2026-06-05days on market $119,900 Active 112 DOM
-
2026-06-03days on market $119,900 Active 111 DOM
-
2026-06-02days on market $119,900 Active 110 DOM
-
2026-06-01days on market $119,900 Active 109 DOM
-
2026-05-31days on market $119,900 Active 108 DOM
-
2026-04-20price $119,900 229-char remark
Show marketing remark (229 chars)
The property is tenant occupied. Current tenant is month to month and pays $1100 plus all utilities. The home is part of a portfolio that can be sold separate or together.HVAC, electric and plumbing updated within last 5 years.
-
2026-02-12$139,900 Active 229-char remark
Show marketing remark (229 chars)
The property is tenant occupied. Current tenant is month to month and pays $1100 plus all utilities. The home is part of a portfolio that can be sold separate or together.HVAC, electric and plumbing updated within last 5 years.
-
2015-07-27soldstatus $10,500 Sold 219-char remark
Show marketing remark (219 chars)
Tenants Just Moved Out. Great opportunity for a single family ranch, Investment, or Owner Occupied. SOLD AS IS/WHERE IS. Buyers responsibility to research any and all CODE/HEALTH/Zoning Laws/Violations prior to closing
-
2015-07-17historical Accept Backup Offers 219-char remark
Show marketing remark (219 chars)
Tenants Just Moved Out. Great opportunity for a single family ranch, Investment, or Owner Occupied. SOLD AS IS/WHERE IS. Buyers responsibility to research any and all CODE/HEALTH/Zoning Laws/Violations prior to closing
-
2015-07-13price $14,900 219-char remark
Show marketing remark (219 chars)
Tenants Just Moved Out. Great opportunity for a single family ranch, Investment, or Owner Occupied. SOLD AS IS/WHERE IS. Buyers responsibility to research any and all CODE/HEALTH/Zoning Laws/Violations prior to closing
-
2015-07-03price $17,900 219-char remark
Show marketing remark (219 chars)
Tenants Just Moved Out. Great opportunity for a single family ranch, Investment, or Owner Occupied. SOLD AS IS/WHERE IS. Buyers responsibility to research any and all CODE/HEALTH/Zoning Laws/Violations prior to closing
-
2015-06-08price $25,000 219-char remark
Show marketing remark (219 chars)
Tenants Just Moved Out. Great opportunity for a single family ranch, Investment, or Owner Occupied. SOLD AS IS/WHERE IS. Buyers responsibility to research any and all CODE/HEALTH/Zoning Laws/Violations prior to closing
-
2015-06-08status Active 219-char remark
Show marketing remark (219 chars)
Tenants Just Moved Out. Great opportunity for a single family ranch, Investment, or Owner Occupied. SOLD AS IS/WHERE IS. Buyers responsibility to research any and all CODE/HEALTH/Zoning Laws/Violations prior to closing
-
2015-04-29historical Accept Backup Offers 219-char remark
Show marketing remark (219 chars)
Tenants Just Moved Out. Great opportunity for a single family ranch, Investment, or Owner Occupied. SOLD AS IS/WHERE IS. Buyers responsibility to research any and all CODE/HEALTH/Zoning Laws/Violations prior to closing
-
2015-03-04$40,000 Active 219-char remark
Show marketing remark (219 chars)
Tenants Just Moved Out. Great opportunity for a single family ranch, Investment, or Owner Occupied. SOLD AS IS/WHERE IS. Buyers responsibility to research any and all CODE/HEALTH/Zoning Laws/Violations prior to closing
-
2008-07-02historical
-
2007-09-07$90,000
-
2003-06-20soldstatus $101,000
ⓘ Source: listings_history table (triggers on properties + properties_extension) + one-shot
backfill from property_details.listing_events for pre-trigger history.
Tax reassessment forecast OH · Partial reset (capped growth)
- Current annual tax
- $1,364 · $114/mo
- Projected year-2 tax
- $1,617 · $135/mo
- Expected delta
- +$253/yr (+$21/mo · 18.6%)
ⓘ Screening estimate from a state-policy table — verify with the county assessor before closing.
Climate risk First Street
- Flood 1/10 Low FEMA zone X (unshaded) · 0% chance over 30 yrs
- Wildfire 1/10 Low
- Heat 5/10 Major 7 d/yr ≥103°F today · 19 d/yr by 30 yrs out
- Wind 2/10 Low 100% chance of damaging wind over 30 yrs
- Air quality 3/10 Moderate 2 unhealthy d/yr today · 3 by 30 yrs out
Nearby sold comps map
Loading sold comps map…
Walkable amenities ~0.75 mi
Loading nearby amenities…
Taxation est. · year 1
- Rental income
- $22,552
- − Mortgage interest
- −$6,716
- − Property taxes
- −$1,364
- − Insurance
- −$600
- − Repairs & maintenance
- −$1,804
- − Management
- −$1,804
- − Depreciation
- −$3,488
- Taxable income
- $6,776
- Est. tax owed @ 24.0%
- −$1,626
- After-tax cash flow
- $6,681/yr
For passive investors: Depreciation is non-cash, so a rental often shows a tax loss while cash-flowing — sheltering income. Rental losses are passive: they offset passive income freely, and up to $25,000/yr can offset ordinary (W-2) income if you actively participate and your MAGI is under $100k (phasing out to $0 by $150k); unused losses carry forward. On sale, claimed depreciation is recaptured at up to 25%, and gains may owe capital-gains tax (a 1031 exchange can defer both). Figures are a year-1 estimate at your 24.0% rate — not tax advice; consult a CPA.
Schools (NCES district)
- District
- Lockland Local
- NCES district ID
- 3904423
- Math proficiency
- 16% ▼ -4.00%
- Reading proficiency
- 23% ▼ -7.00%
- Median HH income
- $33,458
- Composite
- 15.89/100
- National rank
- #9256
- State rank
- #632 of 656 in OH
Livability — Arlington Heights
- Score
- 73/100
- State rank
- #334
- US rank
- #5481
Category grades
Schools grade is shown separately in the Schools card above.
Census & demographics
- Census place
- Arlington Heights, OH
- County
- Hamilton County · 701,295 people
- Metro
- Cincinnati, OH-KY-IN
- Population (ZIP)
- 30,586
- Household income
- $69,372
- Rent vs Own
- Severe rent burden
- 1529.0
Population outlook (Hamilton County) Hauer SSP2
- Today (2025)
- 826,054 people
- By 2030
- 830,947 · +0.6%
- By 2040
- 832,319 · +0.8%
- By 2050
- 822,428 · -0.4%
- By 2075
- 788,688 · -4.5%
- By 2100
- 710,674 · -14.0%
Race, ethnicity, and origin ACS 2023
- Neighborhood character
- Majority White (63%)
- Race & ethnicity
- White 63% Black 26% Two or more races 6% Hispanic / Latino 3% Asian 2%
- Common ancestry
- Italian 3% Slovak 2% Lithuanian 1%
- Foreign-born
- 4% · Canada
- Languages at home
- 95% English-only · Spanish 2% Other Indo-European 1% French/Haitian/Cajun 1%
Political lean MEDSL · Hamilton
- 2024 margin
- D (+14.9) · D 57.0% · R 42.1%
- 2008→2024 swing
- +7.9pp toward D · 2008: 7.0pp · 2024: 14.9pp
- All cycles
- 2024: D+14.9 2020: D+15.9 2016: D+9.5 2012: D+4.9 2008: D+7.0
Not yet ingested
- Civics
- —
Market trends
- HPI YoY
- ▼ -263.50%
- Current HPI
- 217.3319
- Rent YoY
- ▲ 8.02%
- Metro
- Cincinnati, OH-KY-IN
- State GDP YoY
- ▲ 1.98%
- F500 in state
- 48
Industry mix (Fortune 500 HQ in OH)
| Industry | F500 HQs | Revenue |
|---|---|---|
| Insurance | 3 | $145B |
|
||
| Industrial Machinery | 3 | $49B |
|
||
| Financial Services | 3 | $24B |
|
||
| Consumer Goods | 2 | $93B |
|
||
| Aerospace / Defense | 2 | $47B |
|
||
| Utilities | 2 | $33B |
|
||
Price history
+18.7% since first listed13 events — show timeline
- 2026-04-20 Price Changed $119,900 Cincy MLS
- 2026-02-12 Listed $139,900 Cincy MLS
- 2015-07-27 Sold (MLS) $10,500 Cincy MLS
- 2015-07-17 Contingent — Cincy MLS
- 2015-07-13 Price Changed $14,900 Cincy MLS
- 2015-07-03 Price Changed $17,900 Cincy MLS
- 2015-06-08 Price Changed $25,000 Cincy MLS
- 2015-06-08 Relisted — Cincy MLS
- 2015-04-29 Contingent — Cincy MLS
- 2015-03-04 Listed $40,000 Cincy MLS
- 2008-07-02 Listing Removed — Cincy MLS
- 2007-09-07 Listed $90,000 Cincy MLS
- 2003-06-20 Sold (Public Records) $101,000 Public Records
Property tax history
-3.9%/yrLatest (2025): $1,364 · +10.4% YoY. Source: county tax records.
Cash-flow waterfall
monthlySold comps — $/sqft
last 12 mo · ≤1 miLoading sold comps…