2758 N Ocqueoc Rd · Ocqueoc, MI
Flood risk 1/10 · Minimal
- FEMA flood zone
- —
- Chance of flooding over 30 yrs
- 0.0%
- Est. flood insurance / yr
- —
Fire risk 3/10 · Minor
- Est. fire insurance / yr
- $784 – $1,456
Heat risk 1/10 · Minimal
- Hot days now (above 93°F)
- 7 days/yr
- Hot days in 30 yrs
- 14 days/yr
Wind risk 1/10 · Minimal
- Chance of severe wind over 30 yrs
- —
Air-quality risk 1/10 · Minimal
- Unhealthy air days now
- 0 days/yr
- Unhealthy air days in 30 yrs
- 0 days/yr
Risk factors via First Street. Map © Google.
Why this score? — see what drove the D grade
The composite is a weighted blend of 9 inputs, each scored 0–100. Each bar is that input's sub-score; the figure is the points it added to the 100-point composite (weight × sub-score).
- Cash flow +16.2/30.0
- ARV discount +7.5/15.0
- DSCR +5.0/10.0
- 1% rule +3.2/10.0
- Schools +2.8/10.0
- Rent growth +2.5/5.0
- Livability +2.5/5.0
- Condition / age +2.5/5.0
- Appreciation +0.0/10.0
$112,000
🖨 Deal sheet (PDF) 📄 Offer letter ✓ Due diligence
Listing remarks
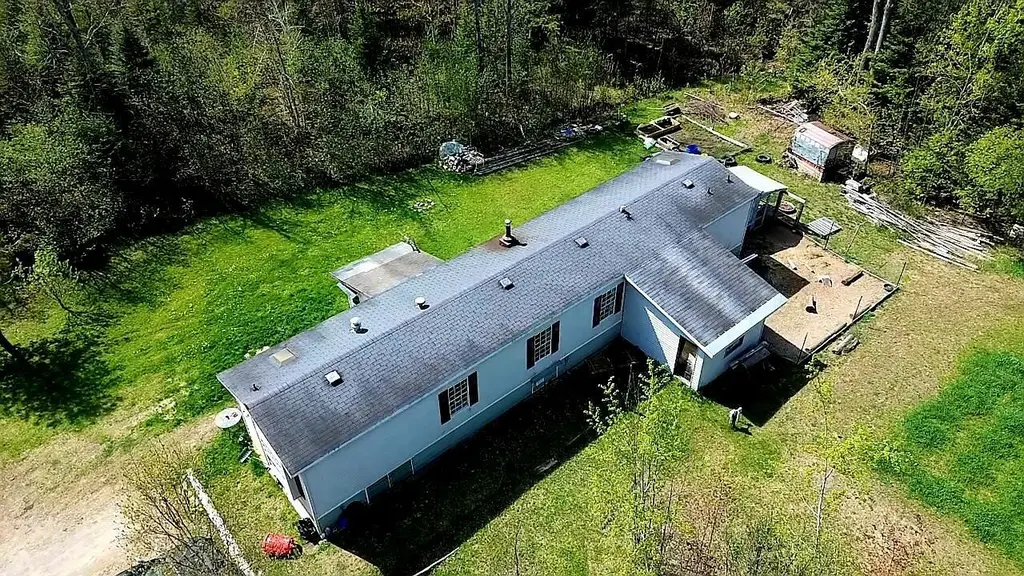
Looking for a place to hunt this year? Not only will you have your own 17 acres, but right across the road is 1000's of acres of state land. This 1999 home is a fixer upper, but it would make a great place to set up camp for your hunting or snowmobiling trip. More of a summer person? This is within a few miles of the Ocqueoc Falls and Lake Huron. Living here would make quick trip to the UP or Mackinaw. The commute to Gaylord, Petoskey and Alpena are all within an hour. The two car garage gives you a place to keep your toys out of the weather, complete with a wood burner. There is an additional lean too next to the garage for extra storage. There is a wood shed to keep your firewood dry. Ou
Key facts
- Mobile home
- Wood stove
- Wood burner
Tags
Property features AI
Exterior
- Parking: Detached 2-car garage
- Utilities: Well water; Septic tank
- Home design: Single-family residence; Residential acreage (17 acres)
- Construction: Slab foundation
- Exterior features: Garden; Paved road access
Interior
- Kitchen: Refrigerator; Oven; Range
- Bathrooms: 1 full bathroom; 1 half bathroom
- Heating & cooling: Forced air heating; Propane heating available; Wood heating (wood stove)
- Interior features: Wood-burning stove; Garden (visible from interior)
- Laundry & utility: Laundry on main level
Neighborhood map
What this means for you Summary
Snapshot
- This is a 3-bed/1.5-bath single-family listed at $112k.
Deal economics
- At list price, monthly cash flow is $59 ($704/yr) — positive.
- The deal already cash-flows at list — no discount required.
- To meet the 1% rule (rent ≥ 1% of price), the offer needs to be $92k (18.1% below list).
- Recommended offer: $92k (18.1% below list) — sets the bar for 1% rule.
Location & tenants
- Location reads: area grade D — affects rentability + tenant quality, not the cash-flow math above.
- Onaway Area Community School District (rural): math 27% / reading 40% proficiency, ranked #328 of 540 in MI (top 61%) — families likely to look elsewhere, expect single-tenant / working-renter base with shorter leases.
- Zoned schools: Onaway Elementary School (math 32% / reading 32%, grade F, #814 of 1,397 statewide, top 61%, 257 students, 62% FRL); Onaway Middle School (math 27% / reading 47%, grade F, #248 of 493 statewide, top 53%, 124 students, 56% FRL); Onaway Senior High School (math 15% / reading 44%, grade F, #428 of 713 statewide, top 62%, 160 students, 48% FRL) — zoned schools at 55% FRL track the district average.
- Market conditions: 39 active listings in the ZIP; 46 units permitted in Presque Isle County in 2024 (0 in 5+ unit buildings).
Forward outlook
- Local home prices are declining (-3.0%/yr); year-one equity from $774 of loan paydown is wiped out by about $3k of value loss. Plan a longer hold.
- Presque Isle County population projected at -31% by 2050 — secular population decline; favor cash flow + early exit over multi-decade hold.
Negotiation context
- It's been on market 31 days — a 3% lower offer ($109k) is reasonable based on typical stale-listing flexibility.
Questions for the listing agent
- It's been on market 31 days. Have you received any prior offers? Is the seller open to a 18% concession, seller financing, or rate buy-down credit?
- Is there a deadline driving the sale (1031 exchange, divorce, estate, relocation)? That informs how much negotiation room exists.
- The area grade is low — what's the realistic commute time and amenity access for the typical tenant pool here? Any planned neighborhood developments (good or bad) we should know about?
- What's the average days-on-market for RENTAL listings here right now (not sales)? A rising rental-DOM trend means longer vacancies and softer asking-rent achievability than the comps imply.
- What's the recent tenant-quality profile in this submarket — average credit score on applications, eviction rate, late-payment / NSF rate, and stable-employment percentage? A property-management company in the area should have these aggregated.
- How much new for-sale + rental construction is in the pipeline within 1–3 miles? Heavy new supply typically softens prices + rents 12–24 months out; constrained supply supports both.
Investment metrics
- 1% rule
- 0.82% ✗
- Cap rate
- 6.92%
- Cash-on-cash
- 2.24%
- DSCR
- 1.10
- GRM
- 10.2
CMA / ARV
No comps found within radius.
Projected returns pro-forma
-3.0% appreciation · 3.0% rent growth · sell at horizon
- IRR
- -12.8%
- Equity multiple
- 0.54×
- Total profit
- $-14,467
- Equity at exit
- $16,700
- IRR
- -3.9%
- Equity multiple
- 0.74×
- Total profit
- $-8,002
- Equity at exit
- $9,684
Cash invested: $31,360 (down + closing). Projections, not guarantees.
Landlord ↔ Tenant lean methodology
- Overall (STATE)
- 62 Landlord-Friendly
- State Michigan
- 62 Landlord-Friendly · EVEN
- County
- — inherits STATE
- City
- — inherits STATE
ZIP-level market 49759
- Home prices YoY
- -28.4%
- Active inventory
- 39
- Price-to-rent
- 10.2×
Monthly cashflow live
- Estimated rent
- $917 medium interval (Pro) →
- Mortgage (P&I)
- −$587
- Tax from tax record
- −$32 /mo · $384/yr
- Insurance
- −$47
- HOA
- −$0
- Vacancy / Maint / Mgmt
- −$193
- Net cashflow
- $59
Break-even live
Sensitivity live
| Price | -10% $122 | -5% $90 | +0% $59 | +5% $27 | +10% $-5 |
|---|---|---|---|---|---|
| Rent | -10% $-14 | -5% $22 | +0% $59 | +5% $95 | +10% $131 |
| Rate | -1.0pp $115 | -0.5pp $87 | base $59 | +0.5pp $30 | +1.0pp $0 |
UW: 25.0% down · 7.5% · 30yr · 1.5% tax · 5.0% vac · 8.0% maint · 8.0% mgmt
Financing live
Cash to close
- Down payment
- $28,000
- Closing costs
- $3,360
- Reserves months
- —
- Total cash needed
- —
Loan-product check · same deal, 3 products live
Conventional
25% down · 7.5% · 30yr
- Down + closing
- —
- Monthly P&I
- —
- Monthly cashflow
- —
- DSCR
- —
- Eligible?
- —
Personal DTI + credit; lowest rate.
DSCR
20% down · 8.5% · 30yr
- Down + closing
- —
- Monthly P&I
- —
- Monthly cashflow
- —
- DSCR
- —
- Eligible?
- —
No personal income docs; deal must DSCR.
Hard money
10% down · 12.0% · 12mo
- Down + closing
- —
- Monthly P&I
- —
- Monthly cashflow
- —
- DSCR
- —
- Eligible?
- —
Short-term bridge; refi at stabilization.
Listing history 18 events
-
2026-06-21days on market $112,000 Active 31 DOM
-
2026-06-21days on market $112,000 Active 30 DOM
-
2026-06-18days on market $112,000 Active 28 DOM
-
2026-06-17days on market $112,000 Active 27 DOM
-
2026-06-16days on market $112,000 Active 26 DOM
-
2026-06-15days on market $112,000 Active 25 DOM
-
2026-06-13days on market $112,000 Active 23 DOM
-
2026-06-12days on market $112,000 Active 22 DOM
-
2026-06-09days on market $112,000 Active 19 DOM
-
2026-06-08days on market $112,000 Active 18 DOM
-
2026-06-07days on market $112,000 Active 17 DOM
-
2026-06-07days on market $112,000 Active 16 DOM
-
2026-06-04days on market $112,000 Active 13 DOM
-
2026-06-02days on market $112,000 Active 12 DOM
-
2026-06-01days on market $112,000 Active 11 DOM
-
2026-05-31days on market $112,000 Active 10 DOM
-
2026-05-31days on market $112,000 Active 9 DOM
-
2026-05-19$112,000 Active
ⓘ Source: listings_history table (triggers on properties + properties_extension) + one-shot
backfill from property_details.listing_events for pre-trigger history.
Tax reassessment forecast MI · Partial reset (capped growth)
- Current annual tax
- $384 · $32/mo
- Projected year-2 tax
- $1,055 · $88/mo
- Expected delta
- +$670/yr (+$56/mo · 174.4%)
ⓘ Screening estimate from a state-policy table — verify with the county assessor before closing.
Climate risk First Street
- Flood 1/10 Low 0% chance over 30 yrs
- Wildfire 3/10 Moderate
- Heat 1/10 Low 7 d/yr ≥93°F today · 14 d/yr by 30 yrs out
- Wind 1/10 Low
- Air quality 1/10 Low 0 unhealthy d/yr today · 0 by 30 yrs out
Nearby sold comps map
Loading sold comps map…
Walkable amenities ~0.75 mi
Loading nearby amenities…
Taxation est. · year 1
- Rental income
- $11,007
- − Mortgage interest
- −$6,274
- − Property taxes
- −$384
- − Insurance
- −$560
- − Repairs & maintenance
- −$881
- − Management
- −$881
- − Depreciation
- −$3,258
- Taxable loss
- −$1,230
- Est. tax savings @ 24.0%
- +$295
- After-tax cash flow
- $999/yr
For passive investors: Depreciation is non-cash, so a rental often shows a tax loss while cash-flowing — sheltering income. Rental losses are passive: they offset passive income freely, and up to $25,000/yr can offset ordinary (W-2) income if you actively participate and your MAGI is under $100k (phasing out to $0 by $150k); unused losses carry forward. On sale, claimed depreciation is recaptured at up to 25%, and gains may owe capital-gains tax (a 1031 exchange can defer both). Figures are a year-1 estimate at your 24.0% rate — not tax advice; consult a CPA.
Schools (NCES district)
- District
- Onaway Area Community School District
- NCES district ID
- 2626400
- Math proficiency
- 27% ▼ -22.00%
- Reading proficiency
- 40% ▼ -5.00%
- Median HH income
- $36,848
- Composite
- 27.8/100
- National rank
- #6889
- State rank
- #328 of 540 in MI
Livability — Ocqueoc
No livability data for this city. (Only ~50 U.S. cities are tracked.)
Census & demographics
- Population (ZIP)
- 1,492
Population outlook (Presque Isle County) Hauer SSP2
- Today (2025)
- 11,675 people
- By 2030
- 10,939 · -6.3%
- By 2040
- 9,337 · -20.0%
- By 2050
- 8,046 · -31.1%
- By 2075
- 6,378 · -45.4%
- By 2100
- 5,045 · -56.8%
Race, ethnicity, and origin ACS 2023
- Neighborhood character
- Predominantly White (94%)
- Race & ethnicity
- White 94% Two or more races 3% Hispanic / Latino 2% Black 1%
- Common ancestry
- Romanian 12% Lithuanian 5% Slovak 3%
- Foreign-born
- 1% · Canada
- Languages at home
- 98% English-only · Spanish 1%
Political lean MEDSL · Presque Isle
- 2024 margin
- Strong R (+29.0) · D 34.7% · R 63.7% · Other 1.5%
- 2008→2024 swing
- -30.5pp toward R · 2008: 1.5pp · 2024: -29.0pp
- All cycles
- 2024: R+29.0 2020: R+29.1 2016: R+28.9 2012: R+8.5 2008: D+1.5
Not yet ingested
- Civics
- —
Market trends
- HPI YoY
- ▼ -61.37%
- Current HPI
- 155.061
- Rent YoY
- —
- Metro
- —
- State GDP YoY
- ▲ 1.37%
- F500 in state
- 28
Industry mix (Fortune 500 HQ in MI)
| Industry | F500 HQs | Revenue |
|---|---|---|
| Automotive Parts | 3 | $48B |
|
||
| Automotive | 2 | $372B |
|
||
| Chemicals | 1 | $45B |
|
||
| Automotive Retail | 1 | $29B |
|
||
| Healthcare / Medical Devices | 1 | $23B |
|
||
| Automotive Technology | 1 | $20B |
|
||
Price history
1 event — show timeline
- 2026-05-19 Listed $112,000 WWMLS
Property tax history
-1.8%/yrLatest (2025): $384 · -38.0% YoY. Source: county tax records.
Cash-flow waterfall
monthlySold comps — $/sqft
last 12 mo · ≤1 miLoading sold comps…