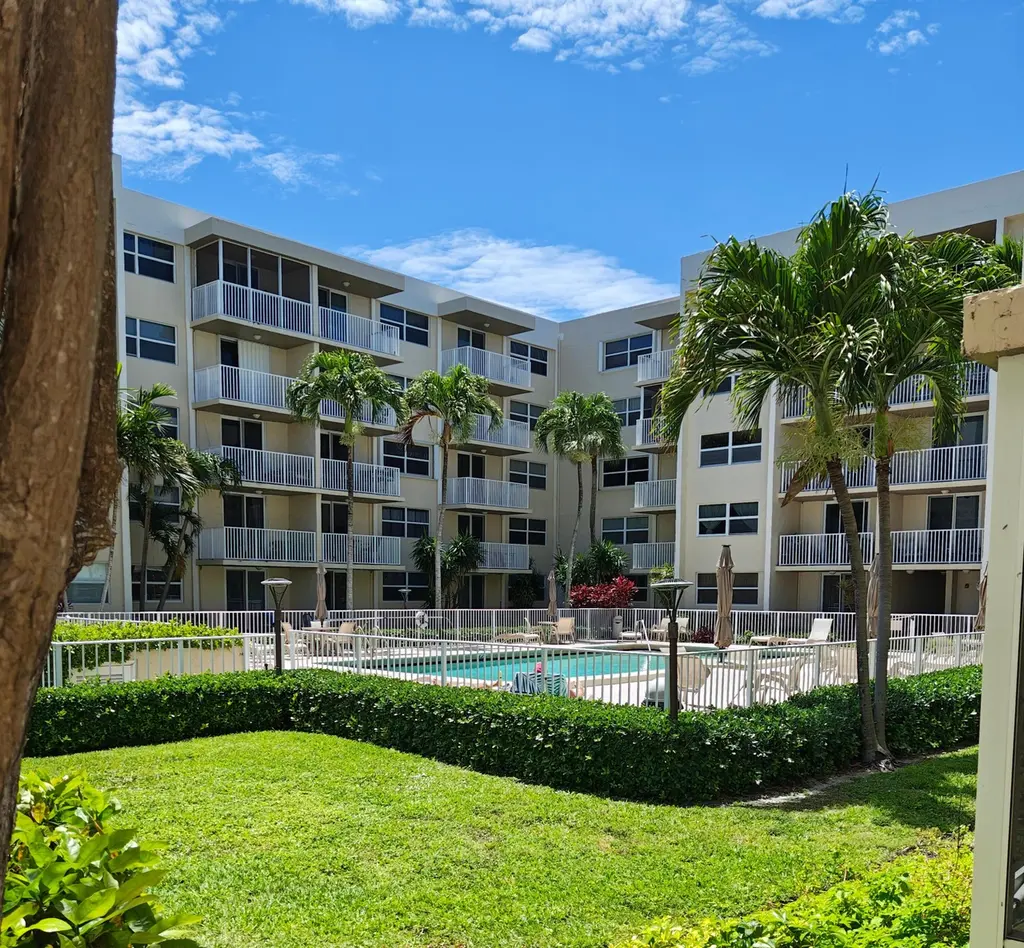
2929 S Ocean Blvd #2110 · Boca Raton, FL
Flood risk 3/10 · Minor
- FEMA flood zone
- X (unshaded)
- Chance of flooding over 30 yrs
- 0.1%
- Est. flood insurance / yr
- $507 – $1,088
Fire risk 1/10 · Minimal
- Est. fire insurance / yr
- $947 – $1,759
Heat risk 9/10 · Severe
- Hot days now (above 106°F)
- 7 days/yr
- Hot days in 30 yrs
- 26 days/yr
Wind risk 10/10 · Severe
- Chance of severe wind over 30 yrs
- 99.0%
Air-quality risk 2/10 · Minimal
- Unhealthy air days now
- 1 days/yr
- Unhealthy air days in 30 yrs
- 3 days/yr
Risk factors via First Street. Map © Google.
Why this score? — see what drove the D grade
The composite is a weighted blend of 9 inputs, each scored 0–100. Each bar is that input's sub-score; the figure is the points it added to the 100-point composite (weight × sub-score).
- Cash flow +12.5/30.0
- ARV discount +7.5/15.0
- Schools +4.3/10.0
- Livability +3.9/5.0
- DSCR +3.7/10.0
- Rent growth +3.6/5.0
- 1% rule +3.4/10.0
- Condition / age +2.5/5.0
- Appreciation +0.0/10.0
$322,500
🖨 Deal sheet (PDF) 📄 Offer letter ✓ Due diligence
Listing remarks
Large one bedroom 1.5 Bath Open Floor Plan condo! Across the Beach and Ocean. Unit is facing the pool and the Laundry Room is on the same floor. The unit is Fully Furnished so EVERYTHING you need is inside! with large Walk-in closet. A must see unit! Please note this is a SMOKE FREE BUILDING and NO PETS Policy! New AC 2025!
Key facts
- Open floor plan
- Large walk-in closet
- New ac
Tags
Property features AI
Finance
- HOA & community: Pets not allowed
Exterior
- Parking: Assigned and guest parking; Detached garage available; Has garage (1 parking space)
- Security: Other security features
- Utilities: Public water; Public sewer; Electricity connected; Sewer available
- Home design: Condominium; 4-story building; Second floor entry; Faces east
- Construction: Brick construction; Flat roof; Block foundation; Building name: Boca South Condominiums; Updated/remodeled
- Exterior features: Second-floor entry; Not waterfront
Interior
- Kitchen: Electric range; Dishwasher; Microwave; Refrigerator
- Bedrooms: One main-level bedroom (entry level 2)
- Flooring: Concrete; Tile; Wood
- Bathrooms: One full bathroom; One half bathroom
- Heating & cooling: Central heating; Other heating; Central air conditioning; Ceiling fans; Electric cooling; Wall/window unit(s)
- Interior features: Partially furnished; Disposal; Updated/remodeled unit
- Laundry & utility: Common area laundry room with multiple locations; Electric water heater
Neighborhood map
What this means for you Summary
Snapshot
- This is a 1-bed/1.5-bath condo listed at $322k.
Deal economics
- At list price, monthly cash flow is $-46 ($-551/yr) — negative.
- To cash-flow at today's rent, offer at most $314k (2.5% below list).
- To meet the 1% rule (rent ≥ 1% of price), the offer needs to be $270k (16.3% below list).
- Recommended offer: $270k (16.3% below list) — sets the bar for 1% rule.
- Cap rate 6.1% vs local median 2.8% in Boca Raton — top-decile yield for the area; either an underpriced asset or a hidden risk that comps aren't pricing in. Stress-test before assuming the spread holds.
Location & tenants
- Location reads 77/100 on livability (#192 in FL, #3,070 nationally) — a middle-class / working-renter tenant base. Strengths: employment A+, health & safety A+, crime B+; Watch: amenities D, cost of living F.
- Palm Beach (suburban): math 46% / reading 53% proficiency, ranked #34 of 73 in FL (top 47%) — families likely to look elsewhere, expect single-tenant / working-renter base with shorter leases.
- Zoned schools: Boca Raton Elementary School (math 47% / reading 52%, grade D, #1,088 of 2,144 statewide, top 53%, 365 students, 62% FRL); Boca Raton Community Middle School (math 59% / reading 61%, grade B, #135 of 571 statewide, top 24%, 1,225 students, 41% FRL); West Boca Raton High School (math 55% / reading 70%, grade B-, #93 of 667 statewide, top 14%, 2,271 students, 28% FRL).
- Market conditions: Rents rising fast (+4.6%/yr); 472 active listings in the ZIP; 40 comparable units currently listed for rent nearby; rentals at typical pace (median 25d on market — plan ~3-4 weeks tenant-placement turnaround); solid renter incomes; 3,974 units permitted in Palm Beach County in 2024 (1,012 in 5+ unit buildings).
- This rent runs 30% of the median local income ($107k/yr) — at the standard rent-burdened threshold; future hikes will face affordability resistance.
Forward outlook
- Local home prices are declining (-3.0%/yr); year-one equity from $2k of loan paydown is wiped out by about $10k of value loss. Plan a longer hold.
- Palm Beach County population projected at +30% by 2050 — long-run rental-demand tailwind backs the buy-and-hold thesis.
Negotiation context
- It's been on market 56 days — a 3% lower offer ($313k) is reasonable based on typical stale-listing flexibility.
- Current owner paid $198k; list at $322k implies a 63% gain — meaningful room to come down on a strong offer.
Risks & watch-outs
- Climate carrying-cost: severe wind risk, 99% chance of damaging wind over 30y; extreme-heat days projected 7→26/yr by 2055 (HVAC capex compounding) — expect insurance premiums to compound above CPI over the hold.
Questions for the listing agent
- What do current leases actually rent for vs. the listed asking? Can we see a recent rent roll and the last 12 months of T-12 income?
- It's been on market 56 days. Have you received any prior offers? Is the seller open to a 16% concession, seller financing, or rate buy-down credit?
- Built in 1974 — when were the roof, HVAC, electrical panel, plumbing, and water heater last replaced?
- Any open or pending special assessments — roof, HVAC, plumbing, elevator, façade? What's the per-unit balance and payoff schedule, and is the seller paying it off at close or rolling it to the buyer?
- Is there a deadline driving the sale (1031 exchange, divorce, estate, relocation)? That informs how much negotiation room exists.
- Schools are A-rated — typically a magnet for longer-tenancy family renters. What's the average tenant stay here, and is there a school-zone premium baked into asking?
- The area grade is low — what's the realistic commute time and amenity access for the typical tenant pool here? Any planned neighborhood developments (good or bad) we should know about?
- What's the average days-on-market for RENTAL listings here right now (not sales)? A rising rental-DOM trend means longer vacancies and softer asking-rent achievability than the comps imply.
- What's the recent tenant-quality profile in this submarket — average credit score on applications, eviction rate, late-payment / NSF rate, and stable-employment percentage? A property-management company in the area should have these aggregated.
- How much new apartment / multifamily construction is in the pipeline within 1–3 miles? Heavy new supply (>2% of stock underway) typically softens rents 12–24 months out; light construction supports rent growth.
Investment metrics
- 1% rule
- 0.84% ✗
- Cap rate
- 6.12%
- Cash-on-cash
- -0.61%
- DSCR
- 0.97
- GRM
- 10.0
CMA / ARV
No comps found within radius.
Projected returns pro-forma
-3.0% appreciation · 4.56% rent growth · sell at horizon
- IRR
- -15.6%
- Equity multiple
- 0.44×
- Total profit
- $-50,874
- Equity at exit
- $48,086
- IRR
- -4.7%
- Equity multiple
- 0.67×
- Total profit
- $-29,810
- Equity at exit
- $27,884
Cash invested: $90,300 (down + closing). Projections, not guarantees.
Landlord ↔ Tenant lean methodology
- Overall (STATE)
- 87 Strongly Landlord-Friendly
- State Florida
- 87 Strongly Landlord-Friendly · R+3
- County
- — inherits STATE
- City
- — inherits STATE
ZIP-level market 33432
- Rents YoY
- 4.6%
- Active inventory
- 472
- Price-to-rent
- 10.0×
Monthly cashflow live
- Estimated rent
- $2,698 high interval (Pro) →
- Mortgage (P&I)
- −$1,691
- Tax from tax record
- −$352 /mo · $4,222/yr
- Insurance
- −$134
- HOA
- −$0
- Vacancy / Maint / Mgmt
- −$567
- Net cashflow
- $-46
Break-even live
Sensitivity live
| Price | -10% $137 | -5% $45 | +0% $-46 | +5% $-137 | +10% $-228 |
|---|---|---|---|---|---|
| Rent | -10% $-259 | -5% $-153 | +0% $-46 | +5% $61 | +10% $167 |
| Rate | -1.0pp $116 | -0.5pp $36 | base $-46 | +0.5pp $-129 | +1.0pp $-215 |
UW: 25.0% down · 7.5% · 30yr · 1.5% tax · 5.0% vac · 8.0% maint · 8.0% mgmt
Financing live
Cash to close
- Down payment
- $80,625
- Closing costs
- $9,675
- Reserves months
- —
- Total cash needed
- —
Loan-product check · same deal, 3 products live
Conventional
25% down · 7.5% · 30yr
- Down + closing
- —
- Monthly P&I
- —
- Monthly cashflow
- —
- DSCR
- —
- Eligible?
- —
Personal DTI + credit; lowest rate.
DSCR
20% down · 8.5% · 30yr
- Down + closing
- —
- Monthly P&I
- —
- Monthly cashflow
- —
- DSCR
- —
- Eligible?
- —
No personal income docs; deal must DSCR.
Hard money
10% down · 12.0% · 12mo
- Down + closing
- —
- Monthly P&I
- —
- Monthly cashflow
- —
- DSCR
- —
- Eligible?
- —
Short-term bridge; refi at stabilization.
Rent comps 40 comps
| Address | Beds | Baths | Sqft | Rent | $/sqft | DOM | Units | Dist |
|---|---|---|---|---|---|---|---|---|
| 2929 S Ocean Blvd Boca Raton, FL | 1.0 | 1.5 | 761 | $2,825 | $3.71 | 15d | 2 | 0.05mi |
| 2851 S Ocean Blvd Boca Raton, FL | 1.0–2.0 | 1.0–2.0 | 1260 | $2,800 | $2.22 | 15d | 3 | 0.09mi |
| 3096 Cadiz Rd Boca Raton, FL | 1.0 | 1.0 | 750 | $2,700 | $3.60 | 25d | 1 | 0.11mi |
| 2760 Banyan Rd Unit 25A Boca Raton, FL | 2.0 | 2.0 | 905 | $2,500 | $2.76 | 19d | 1 | 0.14mi |
| 505 NE 20th Ave Deerfield Beach, FL | 1.0–3.0 | 1.0–2.0 | 1227 | $1,975 | $1.61 | 8d | 2 | 0.16mi |
| 2730 Banyan Rd Boca Raton, FL | 2.0 | 2.0 | 935 | $4,000 | $4.28 | 25d | 2 | 0.17mi |
| 2730 Banyan Rd #26 Boca Raton, FL | 2.0 | 2.0 | 905 | $5,400 | $5.97 | 4d | 1 | 0.17mi |
| 1932 NE 7th St #1 Deerfield Beach, FL | 1.0 | 1.0 | 600 | $2,099 | $3.50 | 25d | 1 | 0.18mi |
| 333 NE 21st Ave Deerfield Beach, FL | 1.0–2.0 | 1.5–2.5 | 870 | $2,500 | $2.87 | 14d | 6 | 0.27mi |
| 1969 NE 4th St Deerfield Beach, FL | 2.0 | 1.0 | 1100 | $3,200 | $2.91 | 25d | 1 | 0.27mi |
| 1910 NE 5th St Unit 8 Deerfield Beach, FL | 1.0 | 1.5 | 1000 | $2,800 | $2.80 | 8d | 1 | 0.31mi |
| 1910 NE 5th St Unit 8 Deerfield Beach, FL | 1.0 | 1.5 | 1000 | $2,800 | $2.80 | 25d | 1 | 0.31mi |
| 1913 NE 4th St Unit 1-9 Deerfield Beach, FL | 1.0 | 1.0 | 859 | $2,000 | $2.33 | 18d | 1 | 0.33mi |
| 1931 NE 2nd St Deerfield Beach, FL | 2.0 | 2.0 | 1001 | $5,000 | $5.00 | 25d | 2 | 0.41mi |
| 1907 NE 2nd St Deerfield Beach, FL | 1.0 | 1.0 | 675 | $2,050 | $3.04 | 11d | 1 | 0.43mi |
| 1960 NE 1st St Apt D7 Deerfield Beach, FL | 1.0 | 1.0 | 600 | $2,700 | $4.50 | 25d | 1 | 0.48mi |
| 2080 E Hillsboro Blvd #108 Deerfield Beach, FL | 1.0 | 2.0 | 696 | $5,000 | $7.18 | 8d | 1 | 0.54mi |
| 330 SE 20th Ave Deerfield Beach, FL | 2.0 | 2.0–2.5 | 1099 | $3,998 | $3.64 | 25d | 2 | 0.74mi |
| 330 SE 20th Ave Deerfield Beach, FL | 2.0 | 2.0–2.5 | 1099 | $3,948 | $3.59 | 20d | 2 | 0.74mi |
| 445 SE 21st Ave #201 Deerfield Beach, FL | 2.0 | 2.0 | 1065 | $3,100 | $2.91 | 25d | 1 | 0.79mi |
| 500 SE 21st Ave #509 Deerfield Beach, FL | 1.0 | 1.0 | 900 | $3,000 | $3.33 | 25d | 1 | 0.82mi |
| 230 N Federal Hwy #305 Deerfield Beach, FL | 2.0 | 2.0 | 993 | $2,600 | $2.62 | 15d | 1 | 0.83mi |
| 230 N Federal Hwy #205 Deerfield Beach, FL | 2.0 | 2.0 | 993 | $2,600 | $2.62 | 25d | 1 | 0.83mi |
| 1420 SE 3rd St Unit 24 Deerfield Beach, FL | 1.0 | 1.0 | 575 | $1,700 | $2.96 | 25d | 1 | 0.84mi |
| 1341 SE 3rd St Deerfield Beach, FL | 2.0 | 1.0 | 750 | $3,250 | $4.33 | 25d | 1 | 0.85mi |
| 381 SE 15th Ave Unit 1 Deerfield Beach, FL | 2.0 | 1.0 | 900 | $3,300 | $3.67 | 25d | 1 | 0.87mi |
| 322 N Federal Hwy #137 Deerfield Beach, FL | 2.0 | 2.0 | 950 | $2,400 | $2.53 | 25d | 1 | 0.87mi |
| 1221 SE 3rd St #3 Deerfield Beach, FL | 2.0 | 2.0 | 941 | $2,600 | $2.76 | 15d | 1 | 0.88mi |
| 1221 SE 3rd St Unit 4 Deerfield Beach, FL | 2.0 | 2.0 | 941 | $2,400 | $2.55 | 25d | 1 | 0.88mi |
| 1111 S Ocean Blvd Boca Raton, FL | 2.0–3.0 | 2.0–2.5 | 1313 | $2,500 | $1.90 | 25d | 3 | 0.91mi |
| 1261 SE 4th St #2 Deerfield Beach, FL | 2.0 | 2.0 | 771 | $2,200 | $2.85 | 15d | 1 | 0.92mi |
| 950 Ponce de Leon Rd Boca Raton, FL | 2.0 | 2.0 | 1093 | $2,525 | $2.31 | 10d | 1 | 0.95mi |
| 1017 SE 3rd St Unit 3 Deerfield Beach, FL | — | 1.0 | 700 | $1,750 | $2.50 | 14d | 1 | 0.96mi |
| 1102 SE 3rd St Unit 8 Deerfield Beach, FL | — | 1.0 | 550 | $1,400 | $2.55 | 14d | 1 | 0.98mi |
| 745 SE 19th Ave #112 Deerfield Beach, FL | 2.0 | 2.0 | 870 | $2,100 | $2.41 | 25d | 1 | 1.01mi |
| 800 SE 20th Ave Deerfield Beach, FL | 1.0–2.0 | 1.5–2.0 | 1087 | $2,750 | $2.53 | 19d | 2 | 1.02mi |
| 224 SE 9th Ave Deerfield Beach, FL | 1.0 | 1.0 | 650 | $1,645 | $2.53 | 25d | 1 | 1.08mi |
| 100 Royal Palm Way #2040 Boca Raton, FL | 1.0 | 1.5 | 900 | $1,195 | $1.33 | 25d | 1 | 1.09mi |
| 236 SE 9th Ave Deerfield Beach, FL | 1.0 | 1.0 | 650 | $1,645 | $2.53 | 14d | 1 | 1.09mi |
| 27 Royal Palm Way #503 Boca Raton, FL | 2.0 | 2.0 | 1081 | $2,500 | $2.31 | 5d | 1 | 1.09mi |
HOA detail condo
- Monthly dues
- $0 · $0/yr
- Likely covers
- pool
- Assessments
- None detected in remarks — confirm with the listing agent.
Listing history 20 events
-
2026-06-18days on market $322,500 Active 56 DOM
-
2026-06-17days on market $322,500 Active 55 DOM
-
2026-06-16days on market $322,500 Active 54 DOM
-
2026-06-15days on market $322,500 Active 53 DOM
-
2026-06-13days on market $322,500 Active 51 DOM
-
2026-06-09days on market $322,500 Active 47 DOM
-
2026-06-08days on market $322,500 Active 46 DOM
-
2026-06-07days on market $322,500 Active 45 DOM
-
2026-06-04pricedays on market $322,500 Active 42 DOM
-
2026-06-03days on market $324,500 Active 41 DOM
-
2026-06-02days on market $324,500 Active 40 DOM
-
2026-06-01days on market $324,500 Active 39 DOM
-
2026-05-31days on market $324,500 Active 38 DOM
-
2026-05-18price $324,500
-
2026-05-04price $325,000
-
2026-04-23$327,500 Active
-
2017-01-05soldstatus $198,000
-
2000-03-07soldstatus $68,300
-
1999-03-16soldstatus $65,000
-
1989-03-13soldstatus $75,000
ⓘ Source: listings_history table (triggers on properties + properties_extension) + one-shot
backfill from property_details.listing_events for pre-trigger history.
Tax reassessment forecast FL · Resets to sale price
- Current annual tax
- $4,222 · $352/mo
- Projected year-2 tax
- $4,222 · $352/mo
- Expected delta
- $0/yr ($0/mo · 0.0%)
ⓘ Screening estimate from a state-policy table — verify with the county assessor before closing.
Climate risk First Street
- Flood 3/10 Moderate FEMA zone X (unshaded) · 10% chance over 30 yrs
- Wildfire 1/10 Low
- Heat 9/10 Extreme 7 d/yr ≥106°F today · 26 d/yr by 30 yrs out
- Wind 10/10 Extreme 99% chance of damaging wind over 30 yrs
- Air quality 2/10 Low 1 unhealthy d/yr today · 3 by 30 yrs out
Nearby sold comps map
Loading sold comps map…
Walkable amenities ~0.75 mi
Loading nearby amenities…
Taxation est. · year 1
- Rental income
- $32,378
- − Mortgage interest
- −$18,065
- − Property taxes
- −$4,222
- − Insurance
- −$1,612
- − Repairs & maintenance
- −$2,590
- − Management
- −$2,590
- − Depreciation
- −$9,382
- Taxable loss
- −$6,084
- Est. tax savings @ 24.0%
- +$1,460
- After-tax cash flow
- $909/yr
For passive investors: Depreciation is non-cash, so a rental often shows a tax loss while cash-flowing — sheltering income. Rental losses are passive: they offset passive income freely, and up to $25,000/yr can offset ordinary (W-2) income if you actively participate and your MAGI is under $100k (phasing out to $0 by $150k); unused losses carry forward. On sale, claimed depreciation is recaptured at up to 25%, and gains may owe capital-gains tax (a 1031 exchange can defer both). Figures are a year-1 estimate at your 24.0% rate — not tax advice; consult a CPA.
Schools (NCES district)
- District
- Palm Beach
- NCES district ID
- 1201500
- Math proficiency
- 46% ▼ -16.00%
- Reading proficiency
- 53% ▼ -4.00%
- Median HH income
- $53,943
- Composite
- 42.72/100
- National rank
- #3160
- State rank
- #34 of 73 in FL
Livability — Boca Raton
- Score
- 77/100
- State rank
- #192
- US rank
- #3070
Category grades
Schools grade is shown separately in the Schools card above.
Census & demographics
- Census place
- Boca Raton, FL
- County
- Palm Beach County · 1,438,312 people
- City population
- 250,102
- Metro
- Miami-Fort Lauderdale-Pompano Beach, FL
- Population (ZIP)
- 21,834
- Household income
- $107,045
- Rent vs Own
- Severe rent burden
- 1461.0
Population outlook (Palm Beach County) Hauer SSP2
- Today (2025)
- 1,637,487 people
- By 2030
- 1,743,255 · +6.5%
- By 2040
- 1,948,712 · +19.0%
- By 2050
- 2,132,979 · +30.3%
- By 2075
- 2,530,027 · +54.5%
- By 2100
- 2,706,979 · +65.3%
Race, ethnicity, and origin ACS 2023
- Neighborhood character
- Predominantly White (72%)
- Race & ethnicity
- White 72% Hispanic / Latino 18% Two or more races 13% Black 4% Asian 2%
- Hispanic origin (detail)
- Mexican 3% Puerto Rican 5% Cuban 3%
- Common ancestry
- Scotch-Irish 4% Subsaharan African 4% Romanian 4%
- Foreign-born
- 20% · Canada, Jamaica, China
- Languages at home
- 77% English-only · Spanish 13% Other Indo-European 3% French/Haitian/Cajun 2%
Political lean MEDSL · Palm Beach
- 2024 margin
- Toss-up / Even · D 50.0% · R 49.2%
- 2008→2024 swing
- -22.1pp toward R · 2008: 22.9pp · 2024: 0.8pp
- All cycles
- 2024: D+0.8 2020: D+12.8 2016: D+15.3 2012: D+17.0 2008: D+22.9
Not yet ingested
- Civics
- —
Market trends
- HPI YoY
- ▼ -565.03%
- Current HPI
- 391.7799
- Rent YoY
- ▲ 4.56%
- Metro
- Miami-Fort Lauderdale-Pompano Beach, FL
- State GDP YoY
- ▲ 3.28%
- F500 in state
- 36
Industry mix (Fortune 500 HQ in FL)
| Industry | F500 HQs | Revenue |
|---|---|---|
| Industrial Technology | 2 | $29B |
|
||
| Insurance | 2 | $17B |
|
||
| Retail | 1 | $60B |
|
||
| Technology Distribution | 1 | $58B |
|
||
| Homebuilding | 1 | $35B |
|
||
| Technology Manufacturing | 1 | $35B |
|
||
Price history
+332.7% since first listed7 events — show timeline
- 2026-05-18 Price Changed $324,500 Beaches MLS
- 2026-05-04 Price Changed $325,000 Beaches MLS
- 2026-04-23 Listed $327,500 Beaches MLS
- 2017-01-05 Sold (Public Records) $198,000 Public Records
- 2000-03-07 Sold (Public Records) $68,300 Public Records
- 1999-03-16 Sold (Public Records) $65,000 Public Records
- 1989-03-13 Sold (Public Records) $75,000 Public Records
Property tax history
+5.0%/yrLatest (2025): $4,222 · +5.5% YoY. Source: county tax records.
Cash-flow waterfall
monthlySold comps — $/sqft
last 12 mo · ≤1 miLoading sold comps…