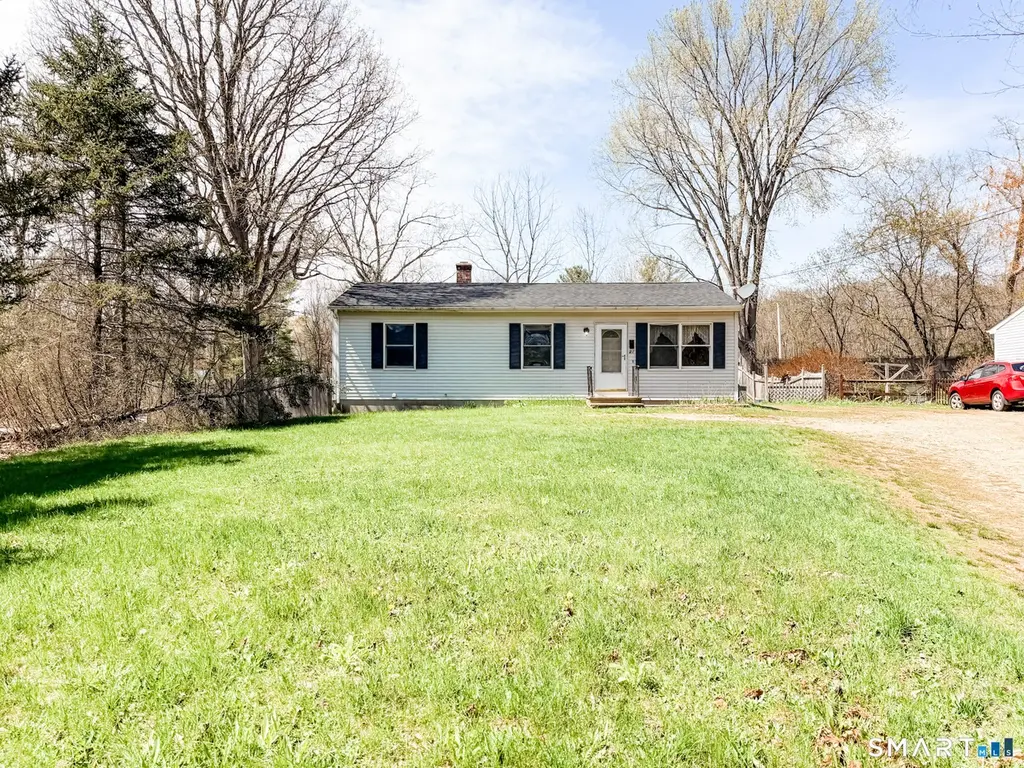
21 Potvin Ave · Moosup, CT
Flood risk 1/10 · Minimal
- FEMA flood zone
- X (unshaded)
- Chance of flooding over 30 yrs
- 0.0%
- Est. flood insurance / yr
- $473 – $860
Fire risk 2/10 · Minimal
- Est. fire insurance / yr
- $829 – $1,539
Heat risk 4/10 · Minor
- Hot days now (above 95°F)
- 7 days/yr
- Hot days in 30 yrs
- 15 days/yr
Wind risk 6/10 · Moderate
- Chance of severe wind over 30 yrs
- 65.0%
Air-quality risk 3/10 · Minor
- Unhealthy air days now
- 2 days/yr
- Unhealthy air days in 30 yrs
- 3 days/yr
Risk factors via First Street. Map © Google.
Why this score? — see what drove the C+ grade
The composite is a weighted blend of 9 inputs, each scored 0–100. Each bar is that input's sub-score; the figure is the points it added to the 100-point composite (weight × sub-score).
- Cash flow +17.2/30.0
- ARV discount +15.0/15.0
- Appreciation +9.6/10.0
- DSCR +5.3/10.0
- 1% rule +4.3/10.0
- Livability +3.4/5.0
- Schools +2.9/10.0
- Rent growth +2.5/5.0
- Condition / age +2.5/5.0
$215,000
🖨 Deal sheet (PDF) 📄 Offer letter ✓ Due diligence
Listing remarks
* * * HIGHEST BEST DEADLINE SUNDAY (4/26) at 7pm * * Single-level ranch offering easy living with great potential. This 3-bedroom, 1-bath home features a functional layout, ready for your personal touch and updates. NEWER ROOF (2024) The fully fenced backyard provides a private outdoor space perfect for pets, entertaining, or future enhancements. A fantastic opportunity to build equity and create something truly your own. Sold As Is.
Key facts
- Functional layout
- 0.3 acre lot
- Built 1989
Tags
Property features AI
Exterior
- Utilities: Public water connected; Public sewer connected
- Home design: Single-family home
- Construction: Frame construction; Concrete foundation
- Exterior features: Deck; Vinyl siding; Shingle roof
Interior
- Kitchen: Oven/Range; Refrigerator
- Bedrooms: 3 bedrooms
- Bathrooms: 1 full bathroom
- Heating & cooling: Hot water heat (oil furnace); Fuel tank located in basement; Hot water system (other)
- Interior features: Full basement; Has attic with hatch access; 5 total rooms
- Laundry & utility: Laundry in basement
Neighborhood map
What this means for you Summary
Snapshot
- This is a 3-bed/1.5-bath single-family listed at $215k.
Deal economics
- At list price, monthly cash flow is $152 ($2k/yr) — positive.
- The deal already cash-flows at list — no discount required.
- To meet the 1% rule (rent ≥ 1% of price), the offer needs to be $200k (7.0% below list).
- Recommended offer: $200k (7.0% below list) — sets the bar for 1% rule.
- Cap rate 7.1% vs local median 2.7% in Moosup — top-decile yield for the area; either an underpriced asset or a hidden risk that comps aren't pricing in. Stress-test before assuming the spread holds.
Location & tenants
- Location reads 67/100 on livability (#113 in CT) — a middle-class / working-renter tenant base. Strengths: crime A+, housing A+, cost of living A; Watch: employment D+, amenities F, commute F.
- Plainfield School District (town): math 24% / reading 41% proficiency, ranked #117 of 153 in CT (top 76%) — families likely to look elsewhere, expect single-tenant / working-renter base with shorter leases.
- Zoned schools: Moosup Elementary School (math 32% / reading 47%, grade F, #298 of 553 statewide, top 56%, 291 students, 57% FRL); Plainfield Central School (math 25% / reading 44%, grade F, #124 of 175 statewide, top 72%, 445 students, 57% FRL); Plainfield High School (math 17% / reading 42%, grade F, #139 of 194 statewide, top 74%, 535 students, 49% FRL) — zoned schools average 54% FRL vs 37% district-wide (17 pts higher); higher-poverty schools than district average — tighter screening recommended.
- Market conditions: 27 active listings in the ZIP; 1 comparable units currently listed for rent nearby; 149 units permitted in Northeastern Connecticut Planning Region in 2024 (0 in 5+ unit buildings).
Forward outlook
- In year one you build about $21k of equity ($1k loan paydown + $20k appreciation (9.2% local appreciation)).
- At projected returns (9.2% appreciation + 3.0% rent growth), your $60k cash investment doubles in ~3 years — after that, you're playing with house money.
- By year 2, paydown + projected appreciation supports a ~$34k cash-out refi (75% LTV) — recoverable capital for the next deal without selling this one.
Negotiation context
- Only 8 days on market — expect competitive offers; lowballing is unlikely to land.
- Current owner paid $30k; list at $215k implies a 617% gain — meaningful room to come down on a strong offer.
Risks & watch-outs
- Climate carrying-cost: major wind risk, 65% chance of damaging wind over 30y — expect insurance premiums to compound above CPI over the hold.
Questions for the listing agent
- Is there a deadline driving the sale (1031 exchange, divorce, estate, relocation)? That informs how much negotiation room exists.
- What's the average days-on-market for RENTAL listings here right now (not sales)? A rising rental-DOM trend means longer vacancies and softer asking-rent achievability than the comps imply.
- What's the recent tenant-quality profile in this submarket — average credit score on applications, eviction rate, late-payment / NSF rate, and stable-employment percentage? A property-management company in the area should have these aggregated.
- How much new for-sale + rental construction is in the pipeline within 1–3 miles? Heavy new supply typically softens prices + rents 12–24 months out; constrained supply supports both.
Investment metrics
- 1% rule
- 0.93% ✗
- Cap rate
- 7.14%
- Cash-on-cash
- 3.03%
- DSCR
- 1.13
- GRM
- 9.0
CMA / ARV
- ARV (on-the-fly)
- $272,640
- Comps found
- 4
Show comp detail 4 sales within ~0.75 mi
| Address | Dist | Beds/Ba | Sqft | Sold | Price | $/sf | Match |
|---|---|---|---|---|---|---|---|
| 21 Potvin Ave | 0.00mi | 3/1.0 | 960 (0%) | 1mo | $235,000 | $245 | 97 |
| 17 Daggett St | 0.19mi | 3/1.5 | 1,050 (+9%) | 10mo | $390,762 | $372 | 67 |
| 18 Highland St | 0.23mi | 3/1.5 | 1,088 (+13%) | 10mo | $260,000 | $239 | 59 |
| 27 Bitgood Vlg | 0.38mi | 3/1.0 | 816 (-15%) | 18mo | $232,000 | $284 | 40 |
Match score weights: distance 35% · size 25% · config 20% · recency 20%. Top-matched comps best support the ARV.
Projected returns pro-forma
9.19% appreciation · 3.0% rent growth · sell at horizon
- IRR
- 24.8%
- Equity multiple
- 2.91×
- Total profit
- $114,915
- Equity at exit
- $181,087
- IRR
- 22.1%
- Equity multiple
- 6.45×
- Total profit
- $328,212
- Equity at exit
- $377,845
Cash invested: $60,200 (down + closing). Projections, not guarantees.
Landlord ↔ Tenant lean methodology
- Overall (STATE)
- 27 Tenant-Leaning
- State Connecticut
- 27 Tenant-Leaning · D+7
- County
- — inherits STATE
- City
- — inherits STATE
ZIP-level market 06354
- Home prices YoY
- 3.0%
- Active inventory
- 27
- Price-to-rent
- 9.0×
Monthly cashflow live
- Estimated rent
- $2,000 medium interval (Pro) →
- Mortgage (P&I)
- −$1,127
- Tax from tax record
- −$211 /mo · $2,533/yr
- Insurance
- −$90
- HOA
- −$0
- Vacancy / Maint / Mgmt
- −$420
- Net cashflow
- $152
Break-even live
Sensitivity live
| Price | -10% $274 | -5% $213 | +0% $152 | +5% $91 | +10% $30 |
|---|---|---|---|---|---|
| Rent | -10% $-6 | -5% $73 | +0% $152 | +5% $231 | +10% $310 |
| Rate | -1.0pp $260 | -0.5pp $207 | base $152 | +0.5pp $96 | +1.0pp $39 |
UW: 25.0% down · 7.5% · 30yr · 1.5% tax · 5.0% vac · 8.0% maint · 8.0% mgmt
Financing live
Cash to close
- Down payment
- $53,750
- Closing costs
- $6,450
- Reserves months
- —
- Total cash needed
- —
Loan-product check · same deal, 3 products live
Conventional
25% down · 7.5% · 30yr
- Down + closing
- —
- Monthly P&I
- —
- Monthly cashflow
- —
- DSCR
- —
- Eligible?
- —
Personal DTI + credit; lowest rate.
DSCR
20% down · 8.5% · 30yr
- Down + closing
- —
- Monthly P&I
- —
- Monthly cashflow
- —
- DSCR
- —
- Eligible?
- —
No personal income docs; deal must DSCR.
Hard money
10% down · 12.0% · 12mo
- Down + closing
- —
- Monthly P&I
- —
- Monthly cashflow
- —
- DSCR
- —
- Eligible?
- —
Short-term bridge; refi at stabilization.
Rent comps 1 comps
| Address | Beds | Baths | Sqft | Rent | $/sqft | DOM | Units | Dist |
|---|---|---|---|---|---|---|---|---|
| 43-45 E Main St Unit 45 Moosup, CT | 3.0 | 1.0 | 1100 | $2,000 | $1.82 | 4d | 1 | 0.33mi |
Listing history 3 events
-
2026-04-30status Under Contract
-
2026-04-22$215,000 Active
-
1989-01-27soldstatus $30,000
ⓘ Source: listings_history table (triggers on properties + properties_extension) + one-shot
backfill from property_details.listing_events for pre-trigger history.
Tax reassessment forecast CT · Partial reset (capped growth)
- Current annual tax
- $2,533 · $211/mo
- Projected year-2 tax
- $3,567 · $297/mo
- Expected delta
- +$1,034/yr (+$86/mo · 40.8%)
ⓘ Screening estimate from a state-policy table — verify with the county assessor before closing.
Climate risk First Street
- Flood 1/10 Low FEMA zone X (unshaded) · 0% chance over 30 yrs
- Wildfire 2/10 Low
- Heat 4/10 Moderate 7 d/yr ≥95°F today · 15 d/yr by 30 yrs out
- Wind 6/10 Major 65% chance of damaging wind over 30 yrs
- Air quality 3/10 Moderate 2 unhealthy d/yr today · 3 by 30 yrs out
Nearby sold comps map
Loading sold comps map…
Walkable amenities ~0.75 mi
Loading nearby amenities…
Taxation est. · year 1
- Rental income
- $24,000
- − Mortgage interest
- −$12,043
- − Property taxes
- −$2,533
- − Insurance
- −$1,075
- − Repairs & maintenance
- −$1,920
- − Management
- −$1,920
- − Depreciation
- −$6,255
- Taxable loss
- −$1,746
- Est. tax savings @ 24.0%
- +$419
- After-tax cash flow
- $2,241/yr
For passive investors: Depreciation is non-cash, so a rental often shows a tax loss while cash-flowing — sheltering income. Rental losses are passive: they offset passive income freely, and up to $25,000/yr can offset ordinary (W-2) income if you actively participate and your MAGI is under $100k (phasing out to $0 by $150k); unused losses carry forward. On sale, claimed depreciation is recaptured at up to 25%, and gains may owe capital-gains tax (a 1031 exchange can defer both). Figures are a year-1 estimate at your 24.0% rate — not tax advice; consult a CPA.
Schools (NCES district)
- District
- Plainfield School District
- NCES district ID
- 0903270
- Math proficiency
- 24% ▼ -16.00%
- Reading proficiency
- 41% ▼ -17.00%
- Median HH income
- $62,056
- Composite
- 29.36/100
- National rank
- #6531
- State rank
- #117 of 153 in CT
Livability — Moosup
- Score
- 67/100
- State rank
- #113
- US rank
- #10397
Category grades
Schools grade is shown separately in the Schools card above.
Census & demographics
- Census place
- Moosup, CT
- Population (ZIP)
- 5,840
Population outlook (Northeastern Connecticut County) Hauer SSP2
- By 2040
- 104,160
Race, ethnicity, and origin ACS 2023
- Neighborhood character
- Predominantly White (85%)
- Race & ethnicity
- White 85% Asian 6% Hispanic / Latino 5% Two or more races 4% Black 1%
- Common ancestry
- Lithuanian 18% Romanian 10% Italian 2%
- Foreign-born
- 7% · Canada, China
- Languages at home
- 93% English-only · Other Indo-European 3% Spanish 2% Chinese 1%
Political lean MEDSL · Northeastern Connecticut
- 2024 margin
- R (+15.4) · D 41.5% · R 57.0% · Other 1.5%
- All cycles
- 2024: R+15.4
Not yet ingested
- Civics
- —
Market trends
- HPI YoY
- ▲ 9.19%
- Current HPI
- 318.3935
- Rent YoY
- —
- Metro
- —
- State GDP YoY
- ▲ 1.06%
- F500 in state
- 38
Industry mix (Fortune 500 HQ in CT)
| Industry | F500 HQs | Revenue |
|---|---|---|
| Industrial Machinery | 4 | $38B |
|
||
| Insurance | 3 | $71B |
|
||
| Financial Services | 2 | $25B |
|
||
| Transportation / Logistics | 2 | $18B |
|
||
| Healthcare | 1 | $247B |
|
||
| Telecommunications | 1 | $55B |
|
||
Price history
+616.7% since first listed3 events — show timeline
- 2026-04-30 Pending — Smart MLS
- 2026-04-22 Listed $215,000 Smart MLS
- 1989-01-27 Sold (Public Records) $30,000 Public Records
Property tax history
+0.4%/yrLatest (2022): $2,533 · -0.7% YoY. Source: county tax records.
Cash-flow waterfall
monthlySold comps — $/sqft
last 12 mo · ≤1 miLoading sold comps…