 Triplex
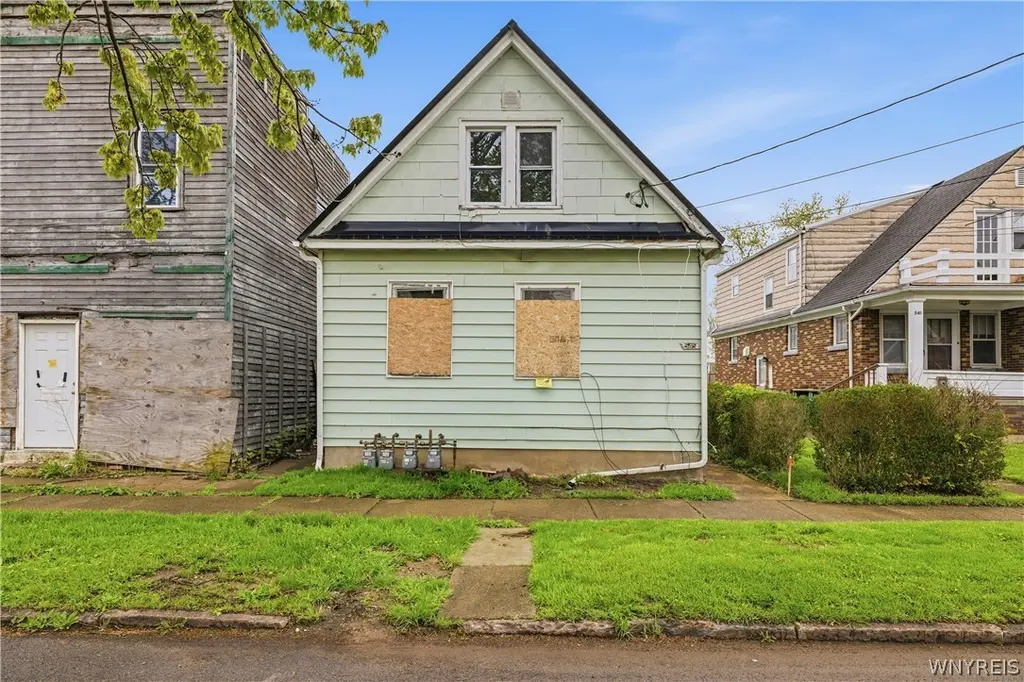
545 20th St · Niagara Falls, NY
Flood risk 6/10 · Moderate
- FEMA flood zone
- X (unshaded)
- Chance of flooding over 30 yrs
- 0.7%
- Est. flood insurance / yr
- $473 – $860
Fire risk 1/10 · Minimal
- Est. fire insurance / yr
- $691 – $1,283
Heat risk 2/10 · Minimal
- Hot days now (above 94°F)
- 7 days/yr
- Hot days in 30 yrs
- 15 days/yr
Wind risk 1/10 · Minimal
- Chance of severe wind over 30 yrs
- —
Air-quality risk 3/10 · Minor
- Unhealthy air days now
- 2 days/yr
- Unhealthy air days in 30 yrs
- 3 days/yr
Risk factors via First Street. Map © Google.
Why this score? — see what drove the A grade
The composite is a weighted blend of 9 inputs, each scored 0–100. Each bar is that input's sub-score; the figure is the points it added to the 100-point composite (weight × sub-score).
- Cash flow +30.0/30.0
- ARV discount +15.0/15.0
- 1% rule +10.0/10.0
- DSCR +10.0/10.0
- Appreciation +10.0/10.0
- Rent growth +4.7/5.0
- Livability +3.0/5.0
- Schools +2.5/10.0
- Condition / age +2.5/5.0
$89,999
🖨 Deal sheet 📄 Offer letter ✓ Due diligence
Multi-family units
County records classify this as Multi-Family (2-4 Unit). Listing-text estimate: 3 units. confirmed
Listing remarks
Welcome to 545 20th Street! This property is an investor’s dream opportunity. It features a durable metal roof installed within the past two years, along with well-maintained siding. The building includes three units: an upper apartment offering two spacious bedrooms, and two lower apartments, each with one bedroom. With some TLC and sweat equity, this property has strong potential to become a solid cash-flowing investment. This property may also be available as part of a package deal, including 1117 Pierce Ave, 608 20th Street, and 919 Cedar Ave.
Key facts
- 3,125 sq ft lot
- 2 parking spots
- Built 1910
Property features AI
Finance
- Other: Three total units with separate gas and electric meters (one meter per unit)
- Financial info: Owner pays water; water included in rent; Operative expenses include water/sewer
Exterior
- Parking: Two or more off-street parking spaces
- Utilities: Public water connected; Sewer connected
- Home design: Single-story multi-unit property; Resale condition; Wood siding
- Construction: Wood siding construction; Existing (previously built)
- Exterior features: Rectangular residential lot; City street frontage; Lot dimensions approximately 25 x 125
Interior
- Kitchen: Eat-in kitchen in one unit
- Bedrooms: Three units: two 1-bedroom units and one 2-bedroom unit
- Flooring: Hardwood; Tile; Vinyl; Varies
- Bathrooms: Three full bathrooms (one per unit)
- Heating & cooling: Gas forced-air heating
- Interior features: Full basement
- Laundry & utility: Gas water heater
Neighborhood map
What this means for you Summary
Snapshot
- This is a 1×2bd/1.0ba + 2×1bd/1.0ba units multifamily listed at $90k.
Deal economics
- At list price, monthly cash flow is $2k ($21k/yr) — positive. Per door: $574/mo.
- The deal already cash-flows at list — no discount required.
- Meets the 1% rule at list price ($3k rent vs $90k).
- Recommended offer: $87k (3.0% below list) — sets the bar for market timing.
- Cap rate 29.2% vs local median 7.7% in Niagara Falls — top-decile yield for the area; either an underpriced asset or a hidden risk that comps aren't pricing in. Stress-test before assuming the spread holds.
Location & tenants
- Location reads 60/100 on livability (#956 in NY) — a middle-class / working-renter tenant base. Strengths: cost of living A+, housing A+; Watch: schools F, crime F, amenities F.
- Niagara Falls City School District (urban): math 26% / reading 34% proficiency, ranked #578 of 590 in NY (top 98%) — families likely to look elsewhere, expect single-tenant / working-renter base with shorter leases; 66% free/reduced lunch — lower-income household profile, screen leases tightly.
- Market conditions: Rents rising fast (+8.8%/yr); 164 active listings in the ZIP; 13 comparable units currently listed for rent nearby; rentals at typical pace (median 15d on market — plan ~3-4 weeks tenant-placement turnaround); lower-income renter base — watch delinquency; 167 units permitted in Niagara County in 2024 (0 in 5+ unit buildings).
Forward outlook
- In year one you build about $10k of equity ($622 loan paydown + $9k appreciation (10.0% local appreciation)).
- Niagara County population projected at -19% by 2050 — secular population decline; favor cash flow + early exit over multi-decade hold.
- At projected returns (10.0% appreciation + 8.0% rent growth), your $25k cash investment doubles in ~1 year — after that, you're playing with house money.
- By year 4, paydown + projected appreciation supports a ~$34k cash-out refi (75% LTV) — recoverable capital for the next deal without selling this one.
Negotiation context
- It's been on market 45 days — a 3% lower offer ($87k) is reasonable based on typical stale-listing flexibility.
- 2 sale attempts since 4y ago; this cycle's ask has dropped $6k (6%) from the opening price — seller is motivated, your offer sets the floor, not the list.
- Current owner paid $26k; list at $90k implies a 253% gain — meaningful room to come down on a strong offer.
Risks & watch-outs
- Watch-outs: built in 1910 — expect roof / HVAC / electrical / plumbing capex.
- Climate carrying-cost: major flood risk — expect insurance premiums to compound above CPI over the hold.
Questions for the listing agent
- It's been on market 45 days. Have you received any prior offers? Is the seller open to a 3% concession, seller financing, or rate buy-down credit?
- Can we see the unit-by-unit rent roll, current vacancy, and any below-market leases? What's the average tenancy length?
- What capital expenditures (roof, boiler, parking lot, exteriors) have been made in the last 5 years, and what's planned in the next 2?
- Built in 1910 — when were the roof, HVAC, electrical panel, plumbing, and water heater last replaced?
- Is there a deadline driving the sale (1031 exchange, divorce, estate, relocation)? That informs how much negotiation room exists.
- Schools are F-rated, which usually means shorter tenancies and higher turnover. Who's the typical renter profile here, and what's been the actual vacancy rate?
- Crime grade is F in this area — have there been break-ins, vandalism, or insurance claims at this property in the last 3 years? What carrier currently insures it and at what premium?
- What's the average days-on-market for RENTAL listings here right now (not sales)? A rising rental-DOM trend means longer vacancies and softer asking-rent achievability than the comps imply.
- What's the recent tenant-quality profile in this submarket — average credit score on applications, eviction rate, late-payment / NSF rate, and stable-employment percentage? A property-management company in the area should have these aggregated.
- How much new apartment / multifamily construction is in the pipeline within 1–3 miles? Heavy new supply (>2% of stock underway) typically softens rents 12–24 months out; light construction supports rent growth.
Investment metrics
- 1% rule
- 3.29% ✓
- Cap rate
- 29.24%
- Cash-on-cash
- 81.94%
- DSCR
- 4.65
- GRM
- 2.5
CMA / ARV
- ARV (median comp)
- $130,593
- List price
- $89,999
- Delta
- -31.08%
- Verdict
- UNDERPRICED
- Comps
- 20 within 1.0 mi
Show comp detail 12 sales within ~0.75 mi
| Address | Dist | Beds/Ba | Sqft | Sold | Price | $/sf | Match |
|---|---|---|---|---|---|---|---|
| 548 19th St | 0.09mi | 4/2.0 | 1,265 (-8%) | 1mo | $62,500 | $49 | 77 |
| 746 17th St | 0.32mi | 4/2.0 | 1,475 (+7%) | 1mo | $72,000 | $49 | 69 |
| 614 20th St | 0.07mi | 4/2.0 | 1,570 (+14%) | 1mo | $100,000 | $64 | 69 |
| 443 21st St | 0.22mi | 3/2.0 (-1) | 1,428 (+4%) | 10mo | $65,000 | $46 | 66 |
| 445 18th St | 0.24mi | 4/2.0 | 1,320 (-4%) | 15mo | $55,000 | $42 | 65 |
| 2771 Livingston Ave | 0.57mi | 4/2.0 | 1,408 (+2%) | 7mo | $88,000 | $63 | 60 |
| 547 21st St | 0.07mi | 5/2.0 (+1) | 1,534 (+11%) | 12mo | $129,900 | $85 | 60 |
| 514 18th St | 0.16mi | 3/2.0 (-1) | 1,260 (-9%) | 14mo | $88,740 | $70 | 58 |
| 1208 17th St | 0.55mi | 3/2.0 (-1) | 1,378 (-0%) | 12mo | $92,500 | $67 | 55 |
| 1519 Whitney Ave | 0.61mi | 3/2.0 (-1) | 1,408 (+2%) | 12mo | $110,000 | $78 | 49 |
| 2234 Willow Ave | 0.70mi | 3/2.0 (-1) | 1,386 (+0%) | 11mo | $105,000 | $76 | 48 |
| 1970 Whitney Ave | 0.55mi | 3/2.0 (-1) | 1,562 (+13%) | 8mo | $122,000 | $78 | 36 |
Match score weights: distance 35% · size 25% · config 20% · recency 20%. Top-matched comps best support the ARV.
Projected returns pro-forma
10.0% appreciation · 8.0% rent growth · sell at horizon
- IRR
- 96.3%
- Equity multiple
- 7.92×
- Total profit
- $174,292
- Equity at exit
- $81,078
- IRR
- 92.8%
- Equity multiple
- 19.49×
- Total profit
- $465,915
- Equity at exit
- $174,848
Cash invested: $25,200 (down + closing). Projections, not guarantees.
Landlord ↔ Tenant lean methodology
- Overall (STATE)
- 15 Strongly Tenant-Friendly
- State New York
- 15 Strongly Tenant-Friendly · D+10
- County
- — inherits STATE
- City
- — inherits STATE
ZIP-level market 14301
- Home prices YoY
- 6.2%
- Rents YoY
- 8.8%
- Active inventory
- 164
- Price-to-rent
- 7.2×
Monthly cashflow live
- Estimated rent
- $2,960 medium interval (Pro) →
- Mortgage (P&I)
- −$472
- Tax from tax record
- −$108 /mo · $1,299/yr
- Insurance
- −$37
- HOA
- −$0
- Vacancy / Maint / Mgmt
- −$622
- Net cashflow
- $1,721
Break-even live
3-unit breakdown (identical units grouped — click to expand)
| Units | Beds | Baths | Est. rent |
|---|---|---|---|
| 1× unit | 2 | 1 | $1,040 |
| 2× units | 1 | 1 | $1,920 |
| #2 | 1 | 1 | $960 |
| #3 | 1 | 1 | $960 |
| Total (3 units) | $2,960 | ||
UW: 25.0% down · 7.5% · 30yr · 1.5% tax · 5.0% vac · 8.0% maint · 8.0% mgmt
Financing live
Cash to close
- Down payment
- $22,500
- Closing costs
- $2,700
- Reserves months
- —
- Total cash needed
- —
Loan-product check · same deal, 3 products live
Conventional
25% down · 7.5% · 30yr
- Down + closing
- —
- Monthly P&I
- —
- Monthly cashflow
- —
- DSCR
- —
- Eligible?
- —
Personal DTI + credit; lowest rate.
DSCR
20% down · 8.5% · 30yr
- Down + closing
- —
- Monthly P&I
- —
- Monthly cashflow
- —
- DSCR
- —
- Eligible?
- —
No personal income docs; deal must DSCR.
Hard money
10% down · 12.0% · 12mo
- Down + closing
- —
- Monthly P&I
- —
- Monthly cashflow
- —
- DSCR
- —
- Eligible?
- —
Short-term bridge; refi at stabilization.
Rent comps 13 comps
| Address | Beds | Baths | Sqft | Rent | $/sqft | DOM | Units | Dist |
|---|---|---|---|---|---|---|---|---|
| 2020 Forest Ave Niagara Falls, NY | 4.0 | 2.0 | 1600 | $1,500 | $0.94 | 17d | 1 | 0.36mi |
| 420 25th St Niagara Falls, NY | 3.0 | 1.0 | 1101 | $1,500 | $1.36 | 43d | 1 | 0.38mi |
| 1427 Fort Ave Unit 2 Niagara Falls, NY | 3.0 | 1.0 | 1058 | $950 | $0.90 | 43d | 1 | 0.40mi |
| 1001 17th St Niagara Falls, NY | 3.0 | 1.0 | 1152 | $1,800 | $1.56 | 23d | 1 | 0.43mi |
| 754 15th St Niagara Falls, NY | 3.0 | 1.0 | 990 | $1,100 | $1.11 | 23d | 1 | 0.44mi |
| 784 15th St Niagara Falls, NY | 3.0 | 1.5 | 1380 | $1,350 | $0.98 | 3d | 1 | 0.49mi |
| 2727 Monroe Ave Niagara Falls, NY | 3.0 | 1.0 | 960 | $1,500 | $1.56 | 10d | 1 | 0.52mi |
| 2420 Mackenna Ave Unit 1 Niagara Falls, NY | 4.0 | 1.0 | 1300 | $1,390 | $1.07 | 1d | 1 | 0.59mi |
| 3036 Welch Ave Niagara Falls, NY | 3.0 | 1.0 | 1000 | $1,500 | $1.50 | 1d | 1 | 0.75mi |
| 724 Augustus Pl Niagara Falls, NY | 4.0 | 1.0 | 1200 | $1,500 | $1.25 | 43d | 1 | 0.83mi |
| 3225 Belden Pl Niagara Falls, NY | 5.0 | 1.5 | 1344 | $1,750 | $1.30 | 1d | 1 | 0.87mi |
| 3340 Simmons Ave Niagara Falls, NY | 3.0 | 1.0 | 1008 | $1,550 | $1.54 | 14d | 1 | 0.98mi |
| 642 Ashland Ave Niagara Falls, NY | 3.0 | 1.0 | 1238 | $1,100 | $0.89 | 3d | 1 | 1.10mi |
Listing history 20 events
-
2026-06-18days on market $89,999 Active 45 DOM
-
2026-06-17days on market $89,999 Active 44 DOM
-
2026-06-16days on market $89,999 Active 43 DOM
-
2026-06-15days on market $89,999 Active 42 DOM
-
2026-06-13days on market $89,999 Active 40 DOM
-
2026-06-13days on market $89,999 Active 39 DOM
-
2026-06-10days on market $89,999 Active 37 DOM
-
2026-06-09days on market $89,999 Active 36 DOM
-
2026-06-08days on market $89,999 Active 35 DOM
-
2026-06-07pricedays on market $89,999 Active 34 DOM
-
2026-06-03days on market $96,000 Active 30 DOM
-
2026-06-02days on market $96,000 Active 29 DOM
-
2026-06-01days on market $96,000 Active 28 DOM
-
2026-05-31days on market $96,000 Active 27 DOM
-
2026-05-04$96,000 Active 559-char remark
-
2023-03-31historical
-
2022-09-23$99,900 Active
-
2008-05-30soldstatus $25,500
-
2006-07-25soldstatus $227,000
-
2006-07-25soldstatus $365,000
ⓘ Source: listings_history table (triggers on properties + properties_extension) + one-shot
backfill from property_details.listing_events for pre-trigger history.
Tax reassessment forecast NY · Partial reset (capped growth)
- Current annual tax
- $1,299 · $108/mo
- Projected year-2 tax
- $1,410 · $118/mo
- Expected delta
- +$111/yr (+$9/mo · 8.5%)
ⓘ Screening estimate from a state-policy table — verify with the county assessor before closing.
Climate risk First Street
- Flood 6/10 Major FEMA zone X (unshaded) · 70% chance over 30 yrs
- Wildfire 1/10 Low
- Heat 2/10 Low 7 d/yr ≥94°F today · 15 d/yr by 30 yrs out
- Wind 1/10 Low
- Air quality 3/10 Moderate 2 unhealthy d/yr today · 3 by 30 yrs out
Nearby sold comps map
Loading sold comps map…
Walkable amenities ~0.75 mi
Loading nearby amenities…
Taxation est. · year 1
- Rental income
- $35,520
- − Mortgage interest
- −$5,041
- − Property taxes
- −$1,299
- − Insurance
- −$450
- − Repairs & maintenance
- −$2,842
- − Management
- −$2,842
- − Depreciation
- −$2,618
- Taxable income
- $20,428
- Est. tax owed @ 24.0%
- −$4,903
- After-tax cash flow
- $15,745/yr
For passive investors: Depreciation is non-cash, so a rental often shows a tax loss while cash-flowing — sheltering income. Rental losses are passive: they offset passive income freely, and up to $25,000/yr can offset ordinary (W-2) income if you actively participate and your MAGI is under $100k (phasing out to $0 by $150k); unused losses carry forward. On sale, claimed depreciation is recaptured at up to 25%, and gains may owe capital-gains tax (a 1031 exchange can defer both). Figures are a year-1 estimate at your 24.0% rate — not tax advice; consult a CPA.
Schools (NCES district)
- District
- Niagara Falls City School District
- NCES district ID
- 3620820
- Math proficiency
- 26% ▼ -10.00%
- Reading proficiency
- 34% ▲ 3.00%
- Median HH income
- $32,488
- Composite
- 24.5/100
- National rank
- #7655
- State rank
- #578 of 590 in NY
Livability — Niagara Falls
- Score
- 60/100
- State rank
- #956
- US rank
- #18749
Category grades
Schools grade is shown separately in the Schools card above.
Census & demographics
- Census place
- Niagara Falls, NY
- County
- Niagara County · 157,377 people
- City population
- 62,983
- Metro
- Buffalo-Cheektowaga, NY
- Population (ZIP)
- 10,923
- Household income
- $34,549
- Rent vs Own
- Severe rent burden
- 954.0
Population outlook (Niagara County) Hauer SSP2
- Today (2025)
- 204,149 people
- By 2030
- 197,900 · -3.1%
- By 2040
- 182,239 · -10.7%
- By 2050
- 165,198 · -19.1%
- By 2075
- 129,416 · -36.6%
- By 2100
- 96,222 · -52.9%
Race, ethnicity, and origin ACS 2023
- Neighborhood character
- Diverse neighborhood (Simpson 0.58)
- Race & ethnicity
- White 59% Black 25% Two or more races 8% Hispanic / Latino 8% Asian 2%
- Hispanic origin (detail)
- Puerto Rican 3% Cuban 2%
- Common ancestry
- Romanian 6% Slovak 2% Lithuanian 1%
- Foreign-born
- 5% · Canada, China, Dominican Republic
- Languages at home
- 90% English-only · Spanish 6% Other Indo-European 3% Chinese 1%
Political lean MEDSL · Niagara
- 2024 margin
- R (+14.9) · D 42.5% · R 57.5%
- 2008→2024 swing
- -15.9pp toward R · 2008: 1.0pp · 2024: -14.9pp
- All cycles
- 2024: R+14.9 2020: R+9.7 2016: R+19.0 2012: D+0.6 2008: D+1.0
Not yet ingested
- Civics
- —
Market trends
- HPI YoY
- ▲ 15.41%
- Current HPI
- 266.1457
- Rent YoY
- ▲ 8.79%
- Metro
- Buffalo-Cheektowaga, NY
- State GDP YoY
- ▲ 2.60%
- F500 in state
- 92
Industry mix (Fortune 500 HQ in NY)
| Industry | F500 HQs | Revenue |
|---|---|---|
| Financial Services | 10 | $950B |
|
||
| Consumer Goods | 9 | $162B |
|
||
| Insurance | 4 | $225B |
|
||
| Telecommunications | 2 | $144B |
|
||
| Pharmaceuticals | 2 | $112B |
|
||
| Media / Entertainment | 2 | $69B |
|
||
Price history
-60.4% since first listed7 events — show timeline
- 2026-06-04 Price Changed $89,999 WNYREIS
- 2026-05-04 Listed $96,000 WNYREIS
- 2023-03-31 Listing Removed — WNYREIS
- 2022-09-23 Listed $99,900 WNYREIS
- 2008-05-30 Sold (Public Records) $25,500 Public Records
- 2006-07-25 Sold (Public Records) $365,000 Public Records
- 2006-07-25 Sold (Public Records) $227,000 Public Records
Property tax history
+5.8%/yrLatest (2025): $1,299 · +19.3% YoY. Source: county tax records.
Cash-flow waterfall
monthlySold comps — $/sqft
last 12 mo · ≤1 miLoading sold comps…