236 NW Shumpert St · Fort Walton Beach, FL
Flood risk 1/10 · Minimal
- FEMA flood zone
- X (unshaded)
- Chance of flooding over 30 yrs
- 0.0%
- Est. flood insurance / yr
- $507 – $1,088
Fire risk 1/10 · Minimal
- Est. fire insurance / yr
- $947 – $1,759
Heat risk 10/10 · Severe
- Hot days now (above 104°F)
- 7 days/yr
- Hot days in 30 yrs
- 22 days/yr
Wind risk 9/10 · Severe
- Chance of severe wind over 30 yrs
- 99.0%
Air-quality risk 2/10 · Minimal
- Unhealthy air days now
- 1 days/yr
- Unhealthy air days in 30 yrs
- 2 days/yr
Risk factors via First Street. Map © Google.
Why this score? — see what drove the C grade
The composite is a weighted blend of 9 inputs, each scored 0–100. Each bar is that input's sub-score; the figure is the points it added to the 100-point composite (weight × sub-score).
- Cash flow +17.6/30.0
- ARV discount +15.0/15.0
- DSCR +5.5/10.0
- Schools +5.2/10.0
- 1% rule +4.7/10.0
- Livability +4.0/5.0
- Rent growth +2.8/5.0
- Condition / age +2.5/5.0
- Appreciation +0.0/10.0
$199,000
🖨 Deal sheet 📄 Offer letter ✓ Due diligence
Listing remarks
Conveniently located just minutes from the beautiful beaches of Okaloosa Island and the shopping, dining, and entertainment of downtown Fort Walton Beach, this property offers a great opportunity for investors, renovators, or buyers looking to make a home their own. Being sold AS IS, the home features a spacious driveway, covered carport, and mature landscaping that adds character and curb appeal. The backyard includes a detached workshop, perfect for hobbies, storage, or additional workspace. With a desirable location and plenty of potential, this property is ready for its next chapter.
Key facts
- Covered carport
- Detached workshop
- Spacious driveway
Tags
Property features AI
Finance
- HOA & community: Subdivision: MUNICIPAL S/D 1ST ADDN
Exterior
- Parking: 2 covered parking spaces; 4 driveway spaces; Carport
- Utilities: Public water; Public sewer; Electric service; Phone service; TV cable
- Home design: Florida cottage style; Single-story
- Construction: Built in 1962; Block and frame construction; Shingle roof
- Exterior features: Private yard; Chain-link fencing; Corner lot; Paved county road frontage; Workshop/outbuilding
Interior
- Bedrooms: 3 bedrooms, master bedroom on the first floor; All bedrooms located on the first floor
- Flooring: Tile flooring; Vinyl flooring; Carpet flooring
- Bathrooms: 2 bathrooms (1 full, 1 half)
- Heating & cooling: Central heating; Central air conditioning; Ceiling fans; Electric heat control; Electric water heater
- Interior features: Washer/dryer hookup
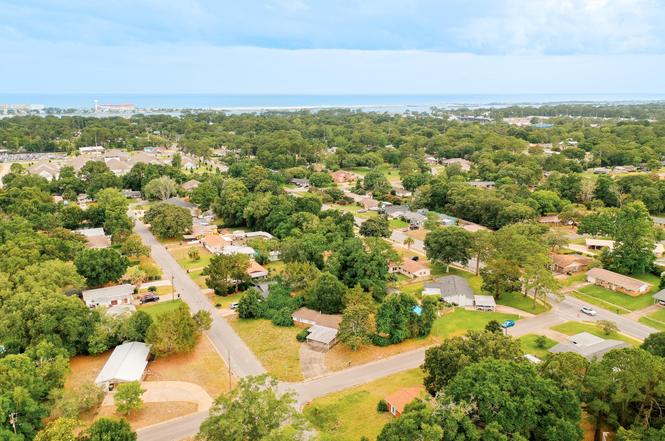
Neighborhood map
What this means for you Summary
Snapshot
- This is a 3-bed/2.0-bath single-family listed at $199k.
Deal economics
- At list price, monthly cash flow is $157 ($2k/yr) — positive.
- The deal already cash-flows at list — no discount required.
- To meet the 1% rule (rent ≥ 1% of price), the offer needs to be $193k (2.9% below list).
- Recommended offer: $193k (2.9% below list) — sets the bar for 1% rule.
- Cap rate 7.2% vs local median 0.9% in Fort Walton Beach — top-decile yield for the area; either an underpriced asset or a hidden risk that comps aren't pricing in. Stress-test before assuming the spread holds.
Location & tenants
- Location reads 80/100 on livability (#111 in FL, #1,628 nationally) — a professional / high-income tenant draw. Strengths: commute A+, housing A+, health & safety A+; Watch: amenities F.
- Okaloosa (other): math 60% / reading 60% proficiency, ranked #12 of 73 in FL (top 16%) — acceptable for families but not a draw, mixed tenant base, ~2y average lease.
- Zoned schools: Annette P. Edwins Elementary School (math 47% / reading 42%, grade F, #1,288 of 2,144 statewide, top 62%, 453 students, 80% FRL); Fort Walton Beach High School (math 54% / reading 58%, grade C, #131 of 667 statewide, top 20%, 1,620 students, 42% FRL) — zoned schools average 61% FRL vs 36% district-wide (25 pts higher); higher-poverty schools than district average — tighter screening recommended.
- Market conditions: Rents rising (+1.3%/yr); 341 active listings in the ZIP; 38 comparable units currently listed for rent nearby; rentals at typical pace (median 21d on market — plan ~3-4 weeks tenant-placement turnaround); 1,268 units permitted in Okaloosa County in 2024 (175 in 5+ unit buildings).
- This rent runs 35% of the median local income ($65k/yr) — at the standard rent-burdened threshold; future hikes will face affordability resistance.
Forward outlook
- Local home prices are declining (-3.0%/yr); year-one equity from $1k of loan paydown is wiped out by about $6k of value loss. Plan a longer hold.
- Okaloosa County population projected at +37% by 2050 — long-run rental-demand tailwind backs the buy-and-hold thesis.
Negotiation context
- Only 1 days on market — expect competitive offers; lowballing is unlikely to land.
- 4 sale attempts since 11y ago with the ask held roughly flat each time — persistent listings suggest the price (not the market) is what's stuck; bring a comps-based counter.
- Current owner paid $12k; list at $199k implies a 1624% gain — meaningful room to come down on a strong offer.
Risks & watch-outs
- Climate carrying-cost: severe wind risk, 99% chance of damaging wind over 30y; extreme-heat days projected 7→22/yr by 2055 (HVAC capex compounding) — expect insurance premiums to compound above CPI over the hold.
Questions for the listing agent
- Built in 1962 — when were the roof, HVAC, electrical panel, plumbing, and water heater last replaced?
- Is there a deadline driving the sale (1031 exchange, divorce, estate, relocation)? That informs how much negotiation room exists.
- What's the average days-on-market for RENTAL listings here right now (not sales)? A rising rental-DOM trend means longer vacancies and softer asking-rent achievability than the comps imply.
- What's the recent tenant-quality profile in this submarket — average credit score on applications, eviction rate, late-payment / NSF rate, and stable-employment percentage? A property-management company in the area should have these aggregated.
- How much new for-sale + rental construction is in the pipeline within 1–3 miles? Heavy new supply typically softens prices + rents 12–24 months out; constrained supply supports both.
Investment metrics
- 1% rule
- 0.97% ✗
- Cap rate
- 7.24%
- Cash-on-cash
- 3.38%
- DSCR
- 1.15
- GRM
- 8.6
CMA / ARV
- ARV (on-the-fly)
- $283,584
- Comps found
- 12
Show comp detail 12 sales within ~0.75 mi
| Address | Dist | Beds/Ba | Sqft | Sold | Price | $/sf | Match |
|---|---|---|---|---|---|---|---|
| 307 NW Sikes Cir | 0.15mi | 3/2.0 | 1,258 (-1%) | 2mo | $325,000 | $258 | 90 |
| 308 NW Victoria Ave | 0.12mi | 3/2.0 | 1,383 (+9%) | 0mo | $310,000 | $224 | 79 |
| 16 SW Temple Ave | 0.46mi | 3/1.5 | 1,252 (-1%) | 1mo | $295,000 | $236 | 74 |
| 312 SW Hollywood Blvd SW | 0.36mi | 3/1.0 | 1,230 (-3%) | 3mo | $275,000 | $224 | 72 |
| 315 NW Leah Miller Dr | 0.32mi | 3/2.0 | 1,134 (-10%) | 1mo | $289,900 | $256 | 67 |
| 224 NW Gilda Pl | 0.31mi | 3/1.5 | 1,151 (-9%) | 3mo | $200,000 | $174 | 66 |
| 213 NW Moriarty St | 0.47mi | 3/1.0 | 1,326 (+5%) | 0mo | $269,000 | $203 | 66 |
| 387 NW Canterbury Cir | 0.68mi | 3/2.0 | 1,294 (+2%) | 1mo | $384,900 | $297 | 64 |
| 105 SW Cedar Ave | 0.70mi | 3/1.5 | 1,288 (+2%) | 3mo | $279,900 | $217 | 60 |
| 204 SW Coral Dr | 0.75mi | 3/2.0 | 1,218 (-4%) | 1mo | $379,500 | $312 | 58 |
| 132 NW Loizos Dr | 0.37mi | 4/1.5 (+1) | 1,412 (+12%) | 2mo | $290,000 | $205 | 55 |
| 131 NW Moriarty St | 0.57mi | 3/1.0 | 1,158 (-8%) | 1mo | $140,000 | $121 | 54 |
Match score weights: distance 35% · size 25% · config 20% · recency 20%. Top-matched comps best support the ARV.
Projected returns pro-forma
-3.0% appreciation · 1.33% rent growth · sell at horizon
- IRR
- -12.9%
- Equity multiple
- 0.54×
- Total profit
- $-25,411
- Equity at exit
- $29,672
- IRR
- -6.6%
- Equity multiple
- 0.61×
- Total profit
- $-21,813
- Equity at exit
- $17,206
Cash invested: $55,720 (down + closing). Projections, not guarantees.
Landlord ↔ Tenant lean methodology
- Overall (STATE)
- 87 Strongly Landlord-Friendly
- State Florida
- 87 Strongly Landlord-Friendly · R+3
- County
- — inherits STATE
- City
- — inherits STATE
ZIP-level market 32548
- Home prices YoY
- -31.1%
- Rents YoY
- 1.3%
- Active inventory
- 341
- Price-to-rent
- 8.6×
Monthly cashflow live
- Estimated rent
- $1,931 high interval (Pro) →
- Mortgage (P&I)
- −$1,044
- Tax from tax record
- −$242 /mo · $2,907/yr
- Insurance
- −$83
- HOA
- −$0
- Vacancy / Maint / Mgmt
- −$406
- Net cashflow
- $157
Break-even live
UW: 25.0% down · 7.5% · 30yr · 1.5% tax · 5.0% vac · 8.0% maint · 8.0% mgmt
Financing live
Cash to close
- Down payment
- $49,750
- Closing costs
- $5,970
- Reserves months
- —
- Total cash needed
- —
Loan-product check · same deal, 3 products live
Conventional
25% down · 7.5% · 30yr
- Down + closing
- —
- Monthly P&I
- —
- Monthly cashflow
- —
- DSCR
- —
- Eligible?
- —
Personal DTI + credit; lowest rate.
DSCR
20% down · 8.5% · 30yr
- Down + closing
- —
- Monthly P&I
- —
- Monthly cashflow
- —
- DSCR
- —
- Eligible?
- —
No personal income docs; deal must DSCR.
Hard money
10% down · 12.0% · 12mo
- Down + closing
- —
- Monthly P&I
- —
- Monthly cashflow
- —
- DSCR
- —
- Eligible?
- —
Short-term bridge; refi at stabilization.
Rent comps 38 comps
| Address | Beds | Baths | Sqft | Rent | $/sqft | DOM | Units | Dist |
|---|---|---|---|---|---|---|---|---|
| 322 Kathleen Pl NW Fort Walton Beach, FL | 4.0 | 2.0 | 1532 | $2,490 | $1.63 | 13d | 1 | 0.35mi |
| 305 Leah Miller Dr NW Fort Walton Beach, FL | 3.0 | 1.5 | 1334 | $2,000 | $1.50 | 21d | 1 | 0.41mi |
| 110 Loizos Dr NW Fort Walton Beach, FL | 3.0 | 2.0 | 1148 | $2,200 | $1.92 | 43d | 1 | 0.54mi |
| 358 Coral Dr SW Fort Walton Beach, FL | 3.0 | 2.0 | 1350 | $1,800 | $1.33 | 43d | 1 | 0.57mi |
| 44 Wright Pkwy NW Fort Walton Beach, FL | 2.0 | 1.0 | 1000 | $1,350 | $1.35 | 21d | 1 | 0.60mi |
| 218 Rose Marie Ln SW Fort Walton Beach, FL | 3.0 | 1.0 | 1208 | $1,750 | $1.45 | 21d | 1 | 0.61mi |
| 17 Cape Dr NW Unit B Fort Walton Beach, FL | 3.0 | 2.0 | 1462 | $1,995 | $1.36 | 13d | 1 | 0.62mi |
| 413 Sea Rover Ln NW Unit F Fort Walton Beach, FL | 2.0 | 1.5 | 1035 | $1,600 | $1.55 | 21d | 1 | 0.79mi |
| 413 Sea Rover Ln NW Unit F Fort Walton Beach, FL | 2.0 | 1.5 | 1035 | $1,600 | $1.55 | 13d | 1 | 0.79mi |
| 405 Marshall Ct Fort Walton Beach, FL | 2.0 | 2.0 | 1000 | $1,495 | $1.50 | 43d | 1 | 0.81mi |
| 402 Marshall Ct NW #6 Fort Walton Beach, FL | 2.0 | 2.0 | 1050 | $1,500 | $1.43 | 21d | 1 | 0.87mi |
| 1850 Stella Ln Unit 4-411 Fort Walton Beach, FL | 2.0 | 2.0 | 980 | $1,650 | $1.68 | 13d | 1 | 0.98mi |
| 1850 Stella Ln Unit 4-417 Fort Walton Beach, FL | 2.0 | 2.0 | 980 | $1,800 | $1.84 | 43d | 1 | 0.98mi |
| 115 Beal Pkwy NW Fort Walton Beach, FL | 2.0 | 2.5 | 1440 | $1,995 | $1.39 | 43d | 1 | 0.99mi |
| 1861 Stella Ln Fort Walton Beach, FL | 2.0 | 2.0 | 980 | $1,650 | $1.68 | 13d | 5 | 0.99mi |
| 1855 Stella Ln Unit 6-617 Fort Walton Beach, FL | 2.0 | 2.0 | 980 | $1,650 | $1.68 | 13d | 1 | 1.03mi |
| 1851 Stella Ln Unit 5-538 Fort Walton Beach, FL | 2.0 | 2.0 | 980 | $1,650 | $1.68 | 13d | 1 | 1.04mi |
| 490 Soundview Ct Mary Esther, FL | 3.0 | 2.5 | 1678 | $3,200 | $1.91 | 21d | 1 | 1.21mi |
| 646 Virginia Oak Ct Fort Walton Beach, FL | 2.0 | 1.5 | 1278 | $1,545 | $1.21 | 13d | 1 | 1.21mi |
| 13 Chatelaine Cir SE Fort Walton Beach, FL | 3.0 | 3.0 | 1728 | $2,100 | $1.22 | 13d | 1 | 1.22mi |
| 119 Beal Pkwy SE #203 Fort Walton Beach, FL | 2.0 | 2.0 | 1588 | $2,150 | $1.35 | 21d | 1 | 1.22mi |
| 1863 Norwood Ct Unit 4 Fort Walton Beach, FL | 2.0 | 2.0 | 960 | $1,350 | $1.41 | 43d | 1 | 1.22mi |
| 30 Harbeson Ave NE Fort Walton Beach, FL | 4.0 | 2.5 | 1717 | $2,250 | $1.31 | 43d | 1 | 1.22mi |
| 645 Virginia Oak Ct Fort Walton Beach, FL | 2.0 | 1.5 | 1254 | $1,900 | $1.52 | 13d | 1 | 1.23mi |
| 1850 Norwood Ct Unit 2 Fort Walton Beach, FL | 2.0 | 2.0 | 960 | $1,350 | $1.41 | 21d | 1 | 1.24mi |
| 1855 Norwood Ct Fort Walton Beach, FL | 2.0 | 2.0 | 960 | $1,400 | $1.46 | 43d | 1 | 1.25mi |
| 1855 Norwood Ct #5 Fort Walton Beach, FL | 2.0 | 2.0 | 960 | $1,350 | $1.41 | 43d | 1 | 1.25mi |
| 1851 Norwood Ct Unit 4 Fort Walton Beach, FL | 2.0 | 2.0 | 960 | $1,350 | $1.41 | 21d | 1 | 1.26mi |
| 940 Santa Rosa Blvd Fort Walton Beach, FL | 2.0 | 2.0 | 1000 | $2,200 | $2.20 | 21d | 4 | 1.26mi |
| 101 Church Ave SE Unit 204 Fort Walton Beach, FL | 2.0 | 1.0 | 945 | $1,676 | $1.77 | 43d | 1 | 1.28mi |
| 103 Church Ave SE Unit B Fort Walton Beach, FL | 2.0 | 1.0 | 930 | $1,300 | $1.40 | 21d | 1 | 1.28mi |
| 210 Pelham Rd Fort Walton Beach, FL | 1.0–2.0 | 1.0 | 809 | $1,500 | $1.85 | 13d | 2 | 1.29mi |
| 204 Devon Ct Fort Walton Beach, FL | 3.0 | 2.0 | 1599 | $2,000 | $1.25 | 44d | 1 | 1.29mi |
| 909 Santa Rosa Blvd #328 Fort Walton Beach, FL | 2.0 | 2.0 | 1035 | $2,600 | $2.51 | 43d | 1 | 1.30mi |
| 5 Laguna St #104 Fort Walton Beach, FL | 2.0 | 2.0 | 1269 | $2,575 | $2.03 | 44d | 1 | 1.40mi |
| 140 Opp Blvd NE Fort Walton Beach, FL | 2.0 | 1.5 | 896 | $1,750 | $1.95 | 43d | 1 | 1.42mi |
| 115 Hughes St NE Unit D2 Fort Walton Beach, FL | 2.0 | 1.0 | 1066 | $1,900 | $1.78 | 21d | 1 | 1.46mi |
| 120 Opp Blvd NE Fort Walton Beach, FL | 2.0 | 1.5 | 1240 | $1,700 | $1.37 | 21d | 1 | 1.47mi |
Listing history 2 events
-
2026-06-18remarks 594-char remark
-
2026-06-18$199,000 Active 1 DOM
ⓘ Source: listings_history table (triggers on properties + properties_extension) + one-shot
backfill from property_details.listing_events for pre-trigger history.
Tax reassessment forecast FL · Resets to sale price
- Current annual tax
- $2,907 · $242/mo
- Projected year-2 tax
- $2,907 · $242/mo
- Expected delta
- $0/yr ($0/mo · 0.0%)
ⓘ Screening estimate from a state-policy table — verify with the county assessor before closing.
Climate risk First Street
- Flood 1/10 Low FEMA zone X (unshaded) · 0% chance over 30 yrs
- Wildfire 1/10 Low
- Heat 10/10 Extreme 7 d/yr ≥104°F today · 22 d/yr by 30 yrs out
- Wind 9/10 Extreme 99% chance of damaging wind over 30 yrs
- Air quality 2/10 Low 1 unhealthy d/yr today · 2 by 30 yrs out
Nearby sold comps map
Loading sold comps map…
Walkable amenities ~0.75 mi
Loading nearby amenities…
Taxation est. · year 1
- Rental income
- $23,176
- − Mortgage interest
- −$11,147
- − Property taxes
- −$2,907
- − Insurance
- −$995
- − Repairs & maintenance
- −$1,854
- − Management
- −$1,854
- − Depreciation
- −$5,789
- Taxable loss
- −$1,370
- Est. tax savings @ 24.0%
- +$329
- After-tax cash flow
- $2,213/yr
For passive investors: Depreciation is non-cash, so a rental often shows a tax loss while cash-flowing — sheltering income. Rental losses are passive: they offset passive income freely, and up to $25,000/yr can offset ordinary (W-2) income if you actively participate and your MAGI is under $100k (phasing out to $0 by $150k); unused losses carry forward. On sale, claimed depreciation is recaptured at up to 25%, and gains may owe capital-gains tax (a 1031 exchange can defer both). Figures are a year-1 estimate at your 24.0% rate — not tax advice; consult a CPA.
Schools (NCES district)
- District
- Okaloosa
- NCES district ID
- 1201380
- Math proficiency
- 60% ▼ -12.00%
- Reading proficiency
- 60% ▼ -4.00%
- Median HH income
- $55,601
- Composite
- 51.62/100
- National rank
- #1705
- State rank
- #12 of 73 in FL
Livability — Fort Walton Beach
- Score
- 80/100
- State rank
- #111
- US rank
- #1628
Category grades
Schools grade is shown separately in the Schools card above.
Census & demographics
- Census place
- Fort Walton Beach, FL
- County
- Okaloosa County · 194,352 people
- City population
- 59,301
- Metro
- Crestview-Fort Walton Beach-Destin, FL
- Population (ZIP)
- 23,774
- Household income
- $65,342
- Rent vs Own
- Severe rent burden
- 889.0
Population outlook (Okaloosa County) Hauer SSP2
- Today (2025)
- 235,133 people
- By 2030
- 253,483 · +7.8%
- By 2040
- 289,537 · +23.1%
- By 2050
- 322,954 · +37.3%
- By 2075
- 399,624 · +70.0%
- By 2100
- 425,311 · +80.9%
Race, ethnicity, and origin ACS 2023
- Neighborhood character
- Diverse neighborhood (Simpson 0.57)
- Race & ethnicity
- White 63% Hispanic / Latino 13% Black 12% Two or more races 9% Asian 6%
- Hispanic origin (detail)
- Mexican 4% Puerto Rican 2%
- Common ancestry
- Italian 4% Slovak 3% Romanian 2%
- Foreign-born
- 12% · Canada, Jamaica
- Languages at home
- 84% English-only · Spanish 9% Other Asian/Pacific 3% Other Indo-European 1%
Political lean MEDSL · Okaloosa
- 2024 margin
- Solid R (+42.4) · D 28.2% · R 70.7% · Other 1.1%
- 2008→2024 swing
- +2.5pp toward D · 2008: -44.9pp · 2024: -42.4pp
- All cycles
- 2024: R+42.4 2020: R+39.1 2016: R+47.8 2012: R+49.4 2008: R+44.9
Not yet ingested
- Civics
- —
Market trends
- HPI YoY
- ▼ -123.88%
- Current HPI
- 274.8418
- Rent YoY
- ▲ 1.33%
- Metro
- Crestview-Fort Walton Beach-Destin, FL
- State GDP YoY
- ▲ 3.28%
- F500 in state
- 36
Industry mix (Fortune 500 HQ in FL)
| Industry | F500 HQs | Revenue |
|---|---|---|
| Industrial Technology | 2 | $29B |
|
||
| Insurance | 2 | $17B |
|
||
| Retail | 1 | $60B |
|
||
| Technology Distribution | 1 | $58B |
|
||
| Homebuilding | 1 | $35B |
|
||
| Technology Manufacturing | 1 | $35B |
|
||
Price history
+1623.8% since first listed7 events — show timeline
- 2026-06-16 Listed $199,000 ECAR
- 2015-10-09 Listing Removed — NAMLS
- 2015-10-09 Listing Removed — PARMLS
- 2015-05-14 Listed $89,900 PARMLS
- 2015-05-12 Listed $89,900 ECAR
- 2015-05-12 Listed $89,900 NAMLS
- 1977-01-01 Sold (Public Records) $11,544 Public Records
Property tax history
+5.1%/yrLatest (2025): $2,907 · +4.6% YoY. Source: county tax records.
Cash-flow waterfall
monthlySold comps — $/sqft
last 12 mo · ≤1 miLoading sold comps…