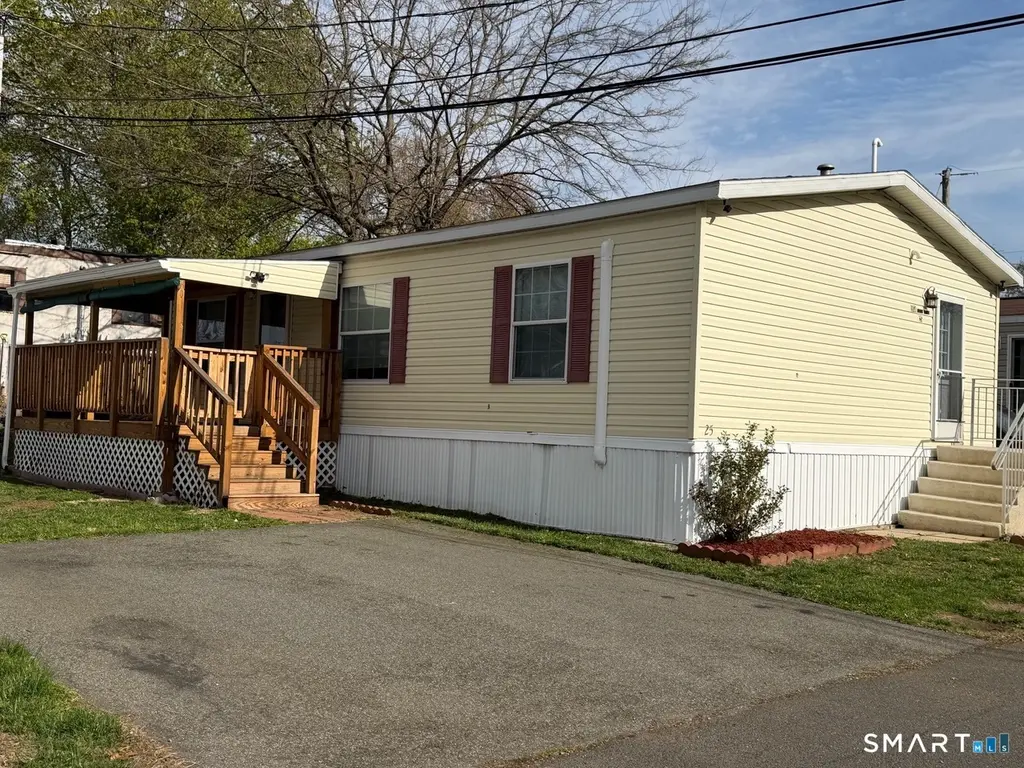
1950 N Broad St #25 · Meriden, CT
Flood risk No data
- FEMA flood zone
- —
- Chance of flooding over 30 yrs
- —
- Est. flood insurance / yr
- —
Fire risk No data
- Est. fire insurance / yr
- —
Heat risk No data
- Hot days now (above threshold)
- —
- Hot days in 30 yrs
- —
Wind risk No data
- Chance of severe wind over 30 yrs
- —
Air-quality risk No data
- Unhealthy air days now
- —
- Unhealthy air days in 30 yrs
- —
Risk factors via First Street. Map © Google.
Why this score? — see what drove the D+ grade
The composite is a weighted blend of 9 inputs, each scored 0–100. Each bar is that input's sub-score; the figure is the points it added to the 100-point composite (weight × sub-score).
- Cash flow +16.3/30.0
- ARV discount +7.5/15.0
- 1% rule +7.0/10.0
- DSCR +5.0/10.0
- Livability +4.2/5.0
- Schools +3.0/10.0
- Rent growth +2.9/5.0
- Condition / age +2.5/5.0
- Appreciation +0.0/10.0
$158,900
🖨 Deal sheet (PDF) 📄 Offer letter ✓ Due diligence
Listing remarks MLS
Pristine , nearly new titan mobile home. Features include fully applianced eat in kitchen. Open floor plan, vaulted ceilings, sky light in full bath, all window treatments, ceiling fan in living room. 95% 20 Yr 6% apr financing avail through seller. Owner is baystate savings bank. Home is ready to go. Quick closing, low low closing costs. This is a deal!!!! Home is energy star rated. Easy to heat and cool. Located in new section of pet friendly park.
Key facts
- New plumbing
- Extra outlets
- New electric
Tags
Property features AI
Finance
- Financial info: Professionally managed (off-site)
- HOA & community: Homeowners association with monthly fee; HOA fee includes trash pickup, water, sewer, property management, and road maintenance; HOA fee: $440 per month
Exterior
- Utilities: Public water connected; Public sewer connected; Electric tankless hot water; Above-ground fuel tank
- Home design: Single-family home; On leased land; Prefab construction
- Construction: Asphalt shingle roof; Slab foundation; Prefab construction
- Exterior features: Open lot; Vinyl siding
Interior
- Kitchen: Oven/Range; Refrigerator; Dishwasher
- Bedrooms: 2 bedrooms
- Bathrooms: 1 full bathroom
- Heating & cooling: Hot air heating; Propane-fueled heating
- Interior features: Central air conditioning; No basement
- Laundry & utility: Washer and dryer included; Laundry room located by back door on the main level
Neighborhood map
What this means for you Summary
Snapshot
- This is a 2-bed/1.0-bath manufactured listed at $159k.
Deal economics
- At list price, monthly cash flow is $87 ($1k/yr) — positive.
- The deal already cash-flows at list — no discount required.
- Meets the 1% rule at list price ($2k rent vs $159k).
- Recommended offer: $154k (3.0% below list) — sets the bar for market timing.
- Cap rate 6.9% vs local median 4.0% in Meriden — top-decile yield for the area; either an underpriced asset or a hidden risk that comps aren't pricing in. Stress-test before assuming the spread holds.
Location & tenants
- Location reads 85/100 on livability (#4 in CT, #505 nationally) — a professional / high-income tenant draw. Strengths: amenities A+, housing A+, health & safety A+.
- Meriden School District (suburban): math 27% / reading 41% proficiency, ranked #116 of 153 in CT (top 76%) — families likely to look elsewhere, expect single-tenant / working-renter base with shorter leases; 61% free/reduced lunch — lower-income household profile, screen leases tightly.
- Zoned schools: Nathan Hale School (math 31% / reading 44%, grade F, #317 of 553 statewide, top 57%, 523 students, 74% FRL); Washington Middle School (math 31% / reading 42%, grade F, #118 of 175 statewide, top 68%, 622 students, 81% FRL); Francis T. Maloney High School (math 20% / reading 45%, grade F, #125 of 194 statewide, top 66%, 1,264 students, 71% FRL).
- Market conditions: Rents rising (+1.6%/yr); 102 active listings in the ZIP; 2 comparable units currently listed for rent nearby; 1,059 units permitted in South Central Connecticut Planning Region in 2024 (779 in 5+ unit buildings).
- This rent runs 32% of the median local income ($71k/yr) — at the standard rent-burdened threshold; future hikes will face affordability resistance.
Forward outlook
- Local home prices are declining (-3.0%/yr); year-one equity from $1k of loan paydown is wiped out by about $5k of value loss. Plan a longer hold.
Negotiation context
- It's been on market 58 days — a 3% lower offer ($154k) is reasonable based on typical stale-listing flexibility.
- 4 sale attempts since 19y ago; this cycle's ask has dropped $10k (6%) from the opening price — seller is motivated, your offer sets the floor, not the list.
- Current owner paid $49k; list at $159k implies a 224% gain — meaningful room to come down on a strong offer.
Risks & watch-outs
- Watch-outs: HOA is 23% of rent.
Questions for the listing agent
- It's been on market 58 days. Have you received any prior offers? Is the seller open to a 3% concession, seller financing, or rate buy-down credit?
- What does the HOA fee cover, when was the last increase, and are there any pending special assessments or reserve-fund shortfalls?
- Is there a deadline driving the sale (1031 exchange, divorce, estate, relocation)? That informs how much negotiation room exists.
- The area grade is low — what's the realistic commute time and amenity access for the typical tenant pool here? Any planned neighborhood developments (good or bad) we should know about?
- What's the average days-on-market for RENTAL listings here right now (not sales)? A rising rental-DOM trend means longer vacancies and softer asking-rent achievability than the comps imply.
- What's the recent tenant-quality profile in this submarket — average credit score on applications, eviction rate, late-payment / NSF rate, and stable-employment percentage? A property-management company in the area should have these aggregated.
- How much new for-sale + rental construction is in the pipeline within 1–3 miles? Heavy new supply typically softens prices + rents 12–24 months out; constrained supply supports both.
Investment metrics
- 1% rule
- 1.20% ✓
- Cap rate
- 6.95%
- Cash-on-cash
- 2.34%
- DSCR
- 1.10
- GRM
- 6.9
CMA / ARV
No comps found within radius.
Projected returns pro-forma
-3.0% appreciation · 1.65% rent growth · sell at horizon
- IRR
- -14.4%
- Equity multiple
- 0.49×
- Total profit
- $-22,554
- Equity at exit
- $23,693
- IRR
- -8.5%
- Equity multiple
- 0.51×
- Total profit
- $-21,829
- Equity at exit
- $13,739
Cash invested: $44,492 (down + closing). Projections, not guarantees.
Landlord ↔ Tenant lean methodology
- Overall (STATE)
- 27 Tenant-Leaning
- State Connecticut
- 27 Tenant-Leaning · D+7
- County
- — inherits STATE
- City
- — inherits STATE
ZIP-level market 06450
- Rents YoY
- 1.6%
- Active inventory
- 102
- Price-to-rent
- 6.9×
Monthly cashflow live
- Estimated rent
- $1,914 medium interval (Pro) →
- Mortgage (P&I)
- −$833
- Tax from tax record
- −$86 /mo · $1,028/yr
- Insurance
- −$66
- HOA
- −$440
- Vacancy / Maint / Mgmt
- −$402
- Net cashflow
- $87
Break-even live
Sensitivity live
| Price | -10% $177 | -5% $132 | +0% $87 | +5% $42 | +10% $-3 |
|---|---|---|---|---|---|
| Rent | -10% $-64 | -5% $11 | +0% $87 | +5% $162 | +10% $238 |
| Rate | -1.0pp $167 | -0.5pp $127 | base $87 | +0.5pp $46 | +1.0pp $4 |
UW: 25.0% down · 7.5% · 30yr · 1.5% tax · 5.0% vac · 8.0% maint · 8.0% mgmt
Financing live
Cash to close
- Down payment
- $39,725
- Closing costs
- $4,767
- Reserves months
- —
- Total cash needed
- —
Loan-product check · same deal, 3 products live
Conventional
25% down · 7.5% · 30yr
- Down + closing
- —
- Monthly P&I
- —
- Monthly cashflow
- —
- DSCR
- —
- Eligible?
- —
Personal DTI + credit; lowest rate.
DSCR
20% down · 8.5% · 30yr
- Down + closing
- —
- Monthly P&I
- —
- Monthly cashflow
- —
- DSCR
- —
- Eligible?
- —
No personal income docs; deal must DSCR.
Hard money
10% down · 12.0% · 12mo
- Down + closing
- —
- Monthly P&I
- —
- Monthly cashflow
- —
- DSCR
- —
- Eligible?
- —
Short-term bridge; refi at stabilization.
Rent comps 2 comps
| Address | Beds | Baths | Sqft | Rent | $/sqft | DOM | Units | Dist |
|---|---|---|---|---|---|---|---|---|
| 109 Blackstone St Unit 109 Meriden, CT | 2.0 | 1.5 | 1056 | $2,100 | $1.99 | 25d | 1 | 1.31mi |
| 19 Cambridge St Unit 2 Meriden, CT | 3.0 | 1.0 | 1100 | $2,100 | $1.91 | 45d | 1 | 1.49mi |
HOA detail
- Monthly dues
- $440 · $5,280/yr
Listing history 24 events
-
2026-06-22days on market $158,900 Active 58 DOM
-
2026-06-18days on market $158,900 Active 55 DOM
-
2026-06-17days on market $158,900 Active 54 DOM
-
2026-06-16days on market $158,900 Active 53 DOM
-
2026-06-15days on market $158,900 Active 52 DOM
-
2026-06-14pricedays on market $158,900 Active 50 DOM
-
2026-06-10days on market $168,900 Active 47 DOM
-
2026-06-09days on market $168,900 Active 46 DOM
-
2026-06-08days on market $168,900 Active 45 DOM
-
2026-06-07days on market $168,900 Active 44 DOM
-
2026-06-05days on market $168,900 Active 41 DOM
-
2026-06-03days on market $168,900 Active 40 DOM
-
2026-06-03days on market $168,900 Active 39 DOM
-
2026-06-01days on market $168,900 Active 38 DOM
-
2026-05-31days on market $168,900 Active 37 DOM
-
2026-04-24$168,900 Active 611-char remark
-
2010-02-22soldstatus $49,000
-
2010-02-19soldstatus $49,000 454-char remark
Show marketing remark (454 chars)
Pristine , nearly new titan mobile home. Features include fully applianced eat in kitchen. Open floor plan, vaulted ceilings, sky light in full bath, all window treatments, ceiling fan in living room. 95% 20 Yr 6% apr financing avail through seller. Owner is baystate savings bank. Home is ready to go. Quick closing, low low closing costs. This is a deal!!!! Home is energy star rated. Easy to heat and cool. Located in new section of pet friendly park.
-
2009-10-26$50,000 454-char remark
Show marketing remark (454 chars)
Pristine , nearly new titan mobile home. Features include fully applianced eat in kitchen. Open floor plan, vaulted ceilings, sky light in full bath, all window treatments, ceiling fan in living room. 95% 20 Yr 6% apr financing avail through seller. Owner is baystate savings bank. Home is ready to go. Quick closing, low low closing costs. This is a deal!!!! Home is energy star rated. Easy to heat and cool. Located in new section of pet friendly park.
-
2009-10-19soldstatus $61,884
-
2009-08-21historical
-
2009-03-21$69,900
-
2007-06-08soldstatus $79,500
-
2007-03-27$79,500
ⓘ Source: listings_history table (triggers on properties + properties_extension) + one-shot
backfill from property_details.listing_events for pre-trigger history.
Tax reassessment forecast CT · Partial reset (capped growth)
- Current annual tax
- $1,028 · $86/mo
- Projected year-2 tax
- $2,214 · $185/mo
- Expected delta
- +$1,186/yr (+$99/mo · 115.4%)
ⓘ Screening estimate from a state-policy table — verify with the county assessor before closing.
Nearby sold comps map
Loading sold comps map…
Walkable amenities ~0.75 mi
Loading nearby amenities…
Taxation est. · year 1
- Rental income
- $22,967
- − Mortgage interest
- −$8,901
- − Property taxes
- −$1,028
- − Insurance
- −$794
- − Repairs & maintenance
- −$1,837
- − Management
- −$1,837
- − HOA
- −$5,280
- − Depreciation
- −$4,623
- Taxable loss
- −$1,334
- Est. tax savings @ 24.0%
- +$320
- After-tax cash flow
- $1,362/yr
For passive investors: Depreciation is non-cash, so a rental often shows a tax loss while cash-flowing — sheltering income. Rental losses are passive: they offset passive income freely, and up to $25,000/yr can offset ordinary (W-2) income if you actively participate and your MAGI is under $100k (phasing out to $0 by $150k); unused losses carry forward. On sale, claimed depreciation is recaptured at up to 25%, and gains may owe capital-gains tax (a 1031 exchange can defer both). Figures are a year-1 estimate at your 24.0% rate — not tax advice; consult a CPA.
Schools (NCES district)
- District
- Meriden School District
- NCES district ID
- 0902400
- Math proficiency
- 27% ▼ -8.00%
- Reading proficiency
- 41% ▼ -6.00%
- Median HH income
- $53,883
- Composite
- 29.84/100
- National rank
- #6413
- State rank
- #116 of 153 in CT
Livability — Meriden
- Score
- 85/100
- State rank
- #4
- US rank
- #505
Category grades
Schools grade is shown separately in the Schools card above.
Census & demographics
- Census place
- Meriden, CT
- County
- New Haven County · 688,236 people
- City population
- 60,545
- Metro
- New Haven-Milford, CT
- Population (ZIP)
- 35,694
- Household income
- $71,250
- Rent vs Own
- Severe rent burden
- 1516.0
Population outlook (South Central Connecticut County) Hauer SSP2
- By 2040
- 608,362
Race, ethnicity, and origin ACS 2023
- Neighborhood character
- Diverse neighborhood (Simpson 0.60)
- Race & ethnicity
- White 51% Hispanic / Latino 36% Two or more races 16% Black 7% Asian 3%
- Hispanic origin (detail)
- Mexican 6% Puerto Rican 23% Dominican 3%
- Common ancestry
- Romanian 8% Lithuanian 4% Scotch-Irish 2%
- Foreign-born
- 10% · Canada, China, South Korea
- Languages at home
- 70% English-only · Spanish 25% Russian/Polish/Slavic 1% Other Indo-European 1%
Political lean MEDSL · South Central Connecticut
- 2024 margin
- Strong D (+20.1) · D 59.0% · R 38.9% · Other 2.1%
- All cycles
- 2024: D+20.1
Not yet ingested
- Civics
- —
Market trends
- HPI YoY
- ▼ -154.37%
- Current HPI
- 263.7288
- Rent YoY
- ▲ 1.65%
- Metro
- New Haven-Milford, CT
- State GDP YoY
- ▲ 1.06%
- F500 in state
- 38
Industry mix (Fortune 500 HQ in CT)
| Industry | F500 HQs | Revenue |
|---|---|---|
| Industrial Machinery | 4 | $38B |
|
||
| Insurance | 3 | $71B |
|
||
| Financial Services | 2 | $25B |
|
||
| Transportation / Logistics | 2 | $18B |
|
||
| Healthcare | 1 | $247B |
|
||
| Telecommunications | 1 | $55B |
|
||
Price history
+99.9% since first listed10 events — show timeline
- 2026-06-10 Price Changed $158,900 Smart MLS
- 2026-04-24 Listed $168,900 Smart MLS
- 2010-02-22 Sold (Public Records) $49,000 Public Records
- 2010-02-19 Sold (MLS) $49,000 Smart MLS
- 2009-10-26 Listed $50,000 Smart MLS
- 2009-10-19 Sold (Public Records) $61,884 Public Records
- 2009-08-21 Listing Removed — Smart MLS
- 2009-03-21 Listed $69,900 Smart MLS
- 2007-06-08 Sold (MLS) $79,500 Smart MLS
- 2007-03-27 Listed $79,500 Smart MLS
Property tax history
-4.6%/yrLatest (2023): $1,028 · +5.4% YoY. Source: county tax records.
Cash-flow waterfall
monthlySold comps — $/sqft
last 12 mo · ≤1 miLoading sold comps…