 Duplex
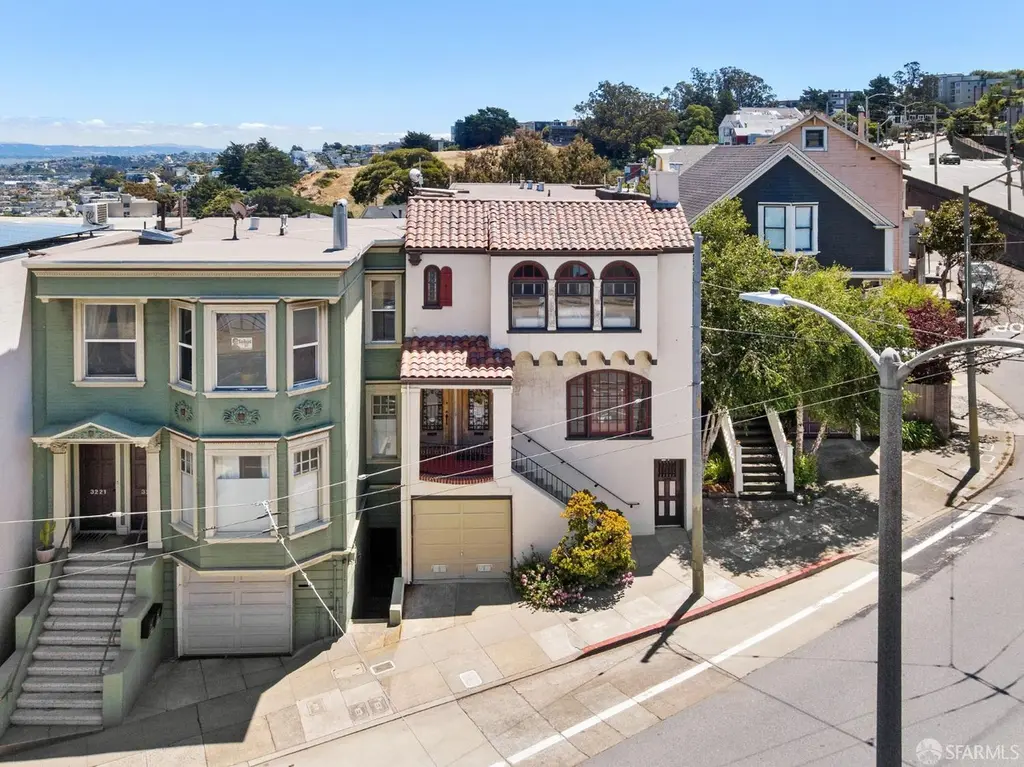
3225-3227 Market St · San Francisco, CA
Flood risk 1/10 · Minimal
- FEMA flood zone
- X (unshaded)
- Chance of flooding over 30 yrs
- 0.0%
- Est. flood insurance / yr
- $507 – $1,088
Fire risk 1/10 · Minimal
- Est. fire insurance / yr
- $659 – $1,223
Heat risk 2/10 · Minimal
- Hot days now (above 76°F)
- 7 days/yr
- Hot days in 30 yrs
- 17 days/yr
Wind risk 1/10 · Minimal
- Chance of severe wind over 30 yrs
- —
Air-quality risk 8/10 · Major
- Unhealthy air days now
- 15 days/yr
- Unhealthy air days in 30 yrs
- 15 days/yr
Risk factors via First Street. Map © Google.
Why this score? — see what drove the D grade
The composite is a weighted blend of 9 inputs, each scored 0–100. Each bar is that input's sub-score; the figure is the points it added to the 100-point composite (weight × sub-score).
- Appreciation +9.8/10.0
- ARV discount +9.4/15.0
- Cash flow +6.5/30.0
- Rent growth +5.0/5.0
- Schools +5.0/10.0
- Livability +3.8/5.0
- Condition / age +2.5/5.0
- 1% rule +1.6/10.0
- DSCR +0.8/10.0
$1,795,000
🖨 Deal sheet (PDF) 📄 Offer letter ✓ Due diligence
Multi-family units
County records classify this as Multi-Family (2-4 Unit). Listing-text estimate: 2 units. confirmed
Listing remarks
Why Buy a Condo When You Can Own the Whole Building? Two full-floor homes, spectacular city views, a two-car garage, and monthly income of $4,446 / month - all at a price that rivals many Castro condominiums. Commanding a prominent position on one of the Castro's most desirable residential streets, this exceptional two-unit residence blends historic San Francisco character with remarkable views, abundant natural light, and outstanding owner-user potential. Originally built in 1908 as an earthquake cottage and expanded into two full-floor flats in 1927, the building showcases elegant Spanish Revival influences with a striking stucco facade, arched windows, decorative architectural detailing,
Key facts
- Rear garden
- Private view deck
- Historic character
Tags
Property features AI
Finance
- Financial info: Property configured as multi-family with 3 total units (2 leased, 1 vacant); Unit mix: one penthouse (vacant, top floor), one 2-bed flat (tenant occupied), one tenant-occupied studio; Vacancy present: 1 unit
- HOA & community: No association fee
Exterior
- Parking: Garage parking; 2 total parking spaces (2-car garage)
- Security: Carbon monoxide detectors; Smoke detectors
- Utilities: Standard utility services (water, sewer, power implied)
- Home design: Residential income property (Duplex); Mediterranean/Spanish architectural style; Originally built in 1908
- Construction: Built in 1908
- Exterior features: Balcony/deck; Landscaped lot
Interior
- Kitchen: Dishwasher; Disposal; Microwave
- Bedrooms: Total of 4 bedrooms across the property; Unit 1 (Penthouse): 2 bedrooms; Unit 2 (Flat): 2 bedrooms; Unit 3: studio
- Flooring: Carpet; Tile; Wood
- Bathrooms: Total of 4 bathrooms (3 full, 1 partial); Unit 1: 1.5 baths; Unit 2: 1 bath; Unit 3: 1 bath (studio)
- Heating & cooling: Central heating; Fireplace insert heating; Wall furnace; No central cooling
- Interior features: Central heating with fireplace inserts and wall furnaces; Fireplace(s); Coin-operated laundry in a common area; Dishwasher, Disposal, Microwave, Tankless Water Heater, Washer/Dryer (varies by unit)
- Laundry & utility: Coin-operated washer/dryer in common area; Washer/Dryer available (varies by unit); Tankless water heater
Neighborhood map
What this means for you Summary
Snapshot
- This is a 2 × 2-bed/1.5-bath units multifamily listed at $1.79M.
Deal economics
- At list price, monthly cash flow is $-3k ($-36k/yr) — negative. Per door: $-2k/mo.
- To cash-flow at today's rent, offer at most $1.36M (24.3% below list).
- To meet the 1% rule (rent ≥ 1% of price), the offer needs to be $1.19M (33.8% below list).
- Recommended offer: $1.19M (33.8% below list) — sets the bar for 1% rule.
- Cap rate 4.3% vs local median 2.1% in San Francisco — top-decile yield for the area; either an underpriced asset or a hidden risk that comps aren't pricing in. Stress-test before assuming the spread holds.
Location & tenants
- Location reads 76/100 on livability (#90 in CA, #3,143 nationally) — a middle-class / working-renter tenant base. Strengths: amenities A+, commute A+, employment A+; Watch: crime F, cost of living F.
- San Francisco Unified (urban): math 50% / reading 56% proficiency, ranked #322 of 1,400 in CA (top 23%) — acceptable for families but not a draw, mixed tenant base, ~2y average lease.
- Market conditions: Rents rising fast (+14.4%/yr); 116 active listings in the ZIP; 15 comparable units currently listed for rent nearby; rentals at typical pace (median 25d on market — plan ~3-4 weeks tenant-placement turnaround); 47% of comp listings sitting > 30 days — soft ceiling on asking rent; high-income renter base; 750 units permitted in San Francisco County in 2024 (688 in 5+ unit buildings).
- At $11,880/mo this rent would consume 70% of the median local household income ($204k/yr) (locally 1336% of renters already pay >50% of income on rent) — very limited rent-growth headroom before tenants either downsize or default.
Forward outlook
- In year one you build about $183k of equity ($12k loan paydown + $171k appreciation (9.5% local appreciation)).
- San Francisco County population projected at +39% by 2050 — long-run rental-demand tailwind backs the buy-and-hold thesis.
- By year 2, paydown + projected appreciation supports a ~$294k cash-out refi (75% LTV) — recoverable capital for the next deal without selling this one.
Negotiation context
- Only 7 days on market — expect competitive offers; lowballing is unlikely to land.
Risks & watch-outs
- Watch-outs: built in 1908 — expect roof / HVAC / electrical / plumbing capex.
Questions for the listing agent
- What do current leases actually rent for vs. the listed asking? Can we see a recent rent roll and the last 12 months of T-12 income?
- Can we see the unit-by-unit rent roll, current vacancy, and any below-market leases? What's the average tenancy length?
- What capital expenditures (roof, boiler, parking lot, exteriors) have been made in the last 5 years, and what's planned in the next 2?
- Built in 1908 — when were the roof, HVAC, electrical panel, plumbing, and water heater last replaced?
- Is there a deadline driving the sale (1031 exchange, divorce, estate, relocation)? That informs how much negotiation room exists.
- Schools are B-rated — typically a magnet for longer-tenancy family renters. What's the average tenant stay here, and is there a school-zone premium baked into asking?
- Crime grade is F in this area — have there been break-ins, vandalism, or insurance claims at this property in the last 3 years? What carrier currently insures it and at what premium?
- The area grade is low — what's the realistic commute time and amenity access for the typical tenant pool here? Any planned neighborhood developments (good or bad) we should know about?
- What's the average days-on-market for RENTAL listings here right now (not sales)? A rising rental-DOM trend means longer vacancies and softer asking-rent achievability than the comps imply.
- What's the recent tenant-quality profile in this submarket — average credit score on applications, eviction rate, late-payment / NSF rate, and stable-employment percentage? A property-management company in the area should have these aggregated.
- How much new apartment / multifamily construction is in the pipeline within 1–3 miles? Heavy new supply (>2% of stock underway) typically softens rents 12–24 months out; light construction supports rent growth.
Investment metrics
- 1% rule
- 0.66% ✗
- Cap rate
- 4.27%
- Cash-on-cash
- -7.21%
- DSCR
- 0.68
- GRM
- 12.6
CMA / ARV
- ARV (on-the-fly)
- $1,874,589
- Comps found
- 12
Show comp detail 12 sales within ~0.75 mi
| Address | Dist | Beds/Ba | Sqft | Sold | Price | $/sf | Match |
|---|---|---|---|---|---|---|---|
| 465-471 Corbett Ave | 0.09mi | 4/4.0 | 2,740 (+9%) | 1mo | $1,450,000 | $529 | 77 |
| 321 Caselli Ave | 0.04mi | 3/3.5 (-1) | 2,250 (-11%) | 2mo | $2,480,000 | $1,102 | 71 |
| 136 Downey St | 0.53mi | 4/— | 2,490 (-1%) | 6mo | $1,900,000 | $763 | 68 |
| 10-12 A Saturn St | 0.27mi | 3/4.0 (-1) | 2,400 (-5%) | 7mo | $1,550,000 | $646 | 64 |
| 10-12 Grand View Ter | 0.22mi | 4/4.0 | 2,254 (-11%) | 5mo | $2,700,000 | $1,198 | 64 |
| 417-419 Eureka St | 0.46mi | 4/1.0 | 2,364 (-6%) | 6mo | $1,390,000 | $588 | 55 |
| 200 Hoffman Ave | 0.50mi | 3/2.0 (-1) | 2,688 (+6%) | 2mo | $2,700,000 | $1,004 | 55 |
| 64-66 Woodland Ave | 0.53mi | 5/3.0 (+1) | 2,760 (+9%) | 10mo | $2,050,000 | $743 | 47 |
| 4113-4115 20th St | 0.64mi | 3/4.0 (-1) | 2,300 (-9%) | 0mo | $2,000,000 | $870 | 46 |
| 514 Hill St | 0.67mi | 4/5.0 | 2,740 (+9%) | 10mo | $2,000,000 | $730 | 38 |
| 253 Hartford St | 0.61mi | 3/2.0 (-1) | 2,147 (-15%) | 2mo | $1,100,000 | $512 | 36 |
| 49 High St | 0.72mi | 4/1.0 | 2,830 (+12%) | 7mo | $1,688,888 | $597 | 32 |
Match score weights: distance 35% · size 25% · config 20% · recency 20%. Top-matched comps best support the ARV.
Projected returns pro-forma
9.51% appreciation · 8.0% rent growth · sell at horizon
- IRR
- 19.5%
- Equity multiple
- 2.57×
- Total profit
- $787,966
- Equity at exit
- $1,552,952
- IRR
- 19.1%
- Equity multiple
- 6.20×
- Total profit
- $2,613,068
- Equity at exit
- $3,283,030
Cash invested: $502,600 (down + closing). Projections, not guarantees.
Landlord ↔ Tenant lean methodology
- Overall (CITY)
- 0 Strongly Tenant-Friendly
- State California
- 18 Strongly Tenant-Friendly · D+13
- County
- — inherits STATE
- City San Francisco
- 0 Strongly Tenant-Friendly · D+57
ZIP-level market 94114
- Home prices YoY
- 4.4%
- Rents YoY
- 14.4%
- Active inventory
- 116
- Price-to-rent
- 25.2×
Monthly cashflow live
- Estimated rent
- $11,880 high interval (Pro) →
- Mortgage (P&I)
- −$9,413
- Tax est. 1.5%
- −$2,244 /mo · $26,925/yr
- Insurance
- −$748
- HOA
- −$0
- Vacancy / Maint / Mgmt
- −$2,495
- Net cashflow
- $-3,020
Break-even live
Sensitivity live
| Price | -10% $-1,779 | -5% $-2,399 | +0% $-3,020 | +5% $-3,640 | +10% $-4,260 |
|---|---|---|---|---|---|
| Rent | -10% $-3,958 | -5% $-3,489 | +0% $-3,020 | +5% $-2,550 | +10% $-2,081 |
| Rate | -1.0pp $-2,116 | -0.5pp $-2,563 | base $-3,020 | +0.5pp $-3,485 | +1.0pp $-3,958 |
2-unit breakdown (identical units grouped — click to expand)
| Units | Beds | Baths | Est. rent |
|---|---|---|---|
| 2× units | 2 | 1.5 | $11,880 |
| #1 | 2 | 1.5 | $5,940 |
| #2 | 2 | 1.5 | $5,940 |
| Total (2 units) | $11,880 | ||
UW: 25.0% down · 7.5% · 30yr · 1.5% tax · 5.0% vac · 8.0% maint · 8.0% mgmt
Financing live
Cash to close
- Down payment
- $448,750
- Closing costs
- $53,850
- Reserves months
- —
- Total cash needed
- —
Loan-product check · same deal, 3 products live
Conventional
25% down · 7.5% · 30yr
- Down + closing
- —
- Monthly P&I
- —
- Monthly cashflow
- —
- DSCR
- —
- Eligible?
- —
Personal DTI + credit; lowest rate.
DSCR
20% down · 8.5% · 30yr
- Down + closing
- —
- Monthly P&I
- —
- Monthly cashflow
- —
- DSCR
- —
- Eligible?
- —
No personal income docs; deal must DSCR.
Hard money
10% down · 12.0% · 12mo
- Down + closing
- —
- Monthly P&I
- —
- Monthly cashflow
- —
- DSCR
- —
- Eligible?
- —
Short-term bridge; refi at stabilization.
Rent comps 15 comps
| Address | Beds | Baths | Sqft | Rent | $/sqft | DOM | Units | Dist |
|---|---|---|---|---|---|---|---|---|
| 143 Corbett Ave San Francisco, CA | 4.0 | 4.0 | 2500 | $10,500 | $4.20 | 44d | 1 | 0.26mi |
| 270 Eureka St San Francisco, CA | 3.0 | 1.0 | 2024 | $6,995 | $3.46 | 3d | 1 | 0.37mi |
| 1265 Stanyan St San Francisco, CA | 3.0 | 2.0 | 2005 | $13,900 | $6.93 | 8d | 1 | 0.40mi |
| 701 Castro St San Francisco, CA | 5.0 | 4.0 | 3300 | $22,995 | $6.97 | 19d | 1 | 0.59mi |
| 753 Castro St San Francisco, CA | 4.0 | 3.0 | 2467 | $10,950 | $4.44 | 44d | 1 | 0.60mi |
| 13 Warren Dr San Francisco, CA | 3.0 | 3.0 | 1900 | $8,750 | $4.61 | 44d | 1 | 0.67mi |
| 1436 Waller St Unit 1436 San Francisco, CA | 3.0 | 2.0 | 1800 | $6,890 | $3.83 | 44d | 1 | 0.72mi |
| 4058 20th St San Francisco, CA | 3.0 | 2.0 | 1794 | $13,975 | $7.79 | 25d | 1 | 0.73mi |
| 65 High St Unit NA San Francisco, CA | 4.0 | 3.0 | 2315 | $9,950 | $4.30 | 44d | 1 | 0.74mi |
| 124 Alpine Ter San Francisco, CA | 3.0 | 2.0 | 2200 | $11,995 | $5.45 | 14d | 1 | 0.77mi |
| 124 Alpine Ter San Francisco, CA | 3.0 | 2.0 | 2200 | $11,995 | $5.45 | 11d | 1 | 0.77mi |
| 124 Alpine Ter San Francisco, CA | 3.0 | 2.0 | 2200 | $12,500 | $5.68 | 25d | 1 | 0.77mi |
| 22 Mountview Ct San Francisco, CA | 4.0 | 2.0 | 1900 | $7,400 | $3.89 | 44d | 1 | 0.83mi |
| 1059 Noe St San Francisco, CA | 3.0 | 2.5 | 2545 | $14,000 | $5.50 | 44d | 1 | 0.87mi |
| 1626 Noe St San Francisco, CA | 3.0 | 2.0 | 1870 | $12,000 | $6.42 | 25d | 1 | 1.34mi |
Listing history 7 events
-
2026-06-18days on market $1,795,000 Active 7 DOM
-
2026-06-17days on market $1,795,000 Active 6 DOM
-
2026-06-16days on market $1,795,000 Active 5 DOM
-
2026-06-15days on market $1,795,000 Active 4 DOM
-
2026-06-13days on market $1,795,000 Active 2 DOM
-
2026-06-13remarks 699-char remark
-
2026-06-13$1,795,000 Active 1 DOM
ⓘ Source: listings_history table (triggers on properties + properties_extension) + one-shot
backfill from property_details.listing_events for pre-trigger history.
Climate risk First Street
- Flood 1/10 Low FEMA zone X (unshaded) · 0% chance over 30 yrs
- Wildfire 1/10 Low
- Heat 2/10 Low 7 d/yr ≥76°F today · 17 d/yr by 30 yrs out
- Wind 1/10 Low
- Air quality 8/10 Severe 15 unhealthy d/yr today · 15 by 30 yrs out
Nearby sold comps map
Loading sold comps map…
Walkable amenities ~0.75 mi
Loading nearby amenities…
Taxation est. · year 1
- Rental income
- $142,560
- − Mortgage interest
- −$100,548
- − Property taxes
- −$26,925
- − Insurance
- −$8,975
- − Repairs & maintenance
- −$11,405
- − Management
- −$11,405
- − Depreciation
- −$52,218
- Taxable loss
- −$68,916
- Est. tax savings @ 24.0%
- +$16,540
- After-tax cash flow
- $-19,696/yr
For passive investors: Depreciation is non-cash, so a rental often shows a tax loss while cash-flowing — sheltering income. Rental losses are passive: they offset passive income freely, and up to $25,000/yr can offset ordinary (W-2) income if you actively participate and your MAGI is under $100k (phasing out to $0 by $150k); unused losses carry forward. On sale, claimed depreciation is recaptured at up to 25%, and gains may owe capital-gains tax (a 1031 exchange can defer both). Figures are a year-1 estimate at your 24.0% rate — not tax advice; consult a CPA.
Schools (NCES district)
- District
- San Francisco Unified
- NCES district ID
- 0634410
- Math proficiency
- 50% ▬ 0.00%
- Reading proficiency
- 56% ▲ 1.00%
- Median HH income
- $81,249
- Composite
- 50.14/100
- National rank
- #4088
- State rank
- #322 of 1400 in CA
Livability — San Francisco
- Score
- 76/100
- State rank
- #90
- US rank
- #3143
Category grades
Schools grade is shown separately in the Schools card above.
Census & demographics
- Census place
- San Francisco, CA
- County
- San Francisco County · 827,552 people
- City population
- 827,552
- Metro
- San Francisco-Oakland-Berkeley, CA
- Population (ZIP)
- 33,020
- Household income
- $204,134
- Rent vs Own
- Severe rent burden
- 1336.0
Population outlook (San Francisco County) Hauer SSP2
- Today (2025)
- 1,030,936 people
- By 2030
- 1,110,409 · +7.7%
- By 2040
- 1,270,010 · +23.2%
- By 2050
- 1,435,001 · +39.2%
- By 2075
- 1,779,074 · +72.6%
- By 2100
- 1,966,767 · +90.8%
Race, ethnicity, and origin ACS 2023
- Neighborhood character
- Predominantly White (65%)
- Race & ethnicity
- White 65% Asian 14% Two or more races 12% Hispanic / Latino 10% Black 2%
- Hispanic origin (detail)
- Mexican 5%
- Common ancestry
- Lithuanian 4% Italian 4% Romanian 3%
- Foreign-born
- 20% · Canada, China, Vietnam
- Languages at home
- 77% English-only · Spanish 6% Chinese 4% Other Indo-European 4%
Political lean MEDSL · San Francisco
- 2024 margin
- Solid D (+64.8) · D 80.3% · R 15.5% · Other 4.1%
- 2008→2024 swing
- -5.7pp toward R · 2008: 70.5pp · 2024: 64.8pp
- All cycles
- 2024: D+64.8 2020: D+72.5 2016: D+76.1 2012: D+70.2 2008: D+70.5
Not yet ingested
- Civics
- —
Market trends
- HPI YoY
- ▲ 9.51%
- Current HPI
- 223.6988
- Rent YoY
- ▲ 14.40%
- Metro
- San Francisco-Oakland-Berkeley, CA
- State GDP YoY
- ▲ 3.21%
- F500 in state
- 116
Industry mix (Fortune 500 HQ in CA)
| Industry | F500 HQs | Revenue |
|---|---|---|
| Technology | 27 | $1,492B |
|
||
| Financial Services | 3 | $174B |
|
||
| Retail | 3 | $44B |
|
||
| Insurance | 3 | $26B |
|
||
| Media / Entertainment | 2 | $115B |
|
||
| Pharmaceuticals / Biotech | 2 | $62B |
|
||
Price history
1 event — show timeline
- 2026-06-11 Listed $1,795,000 San Francisco MLS
Cash-flow waterfall
monthlySold comps — $/sqft
last 12 mo · ≤1 miLoading sold comps…