 🏷️ Likely Rental
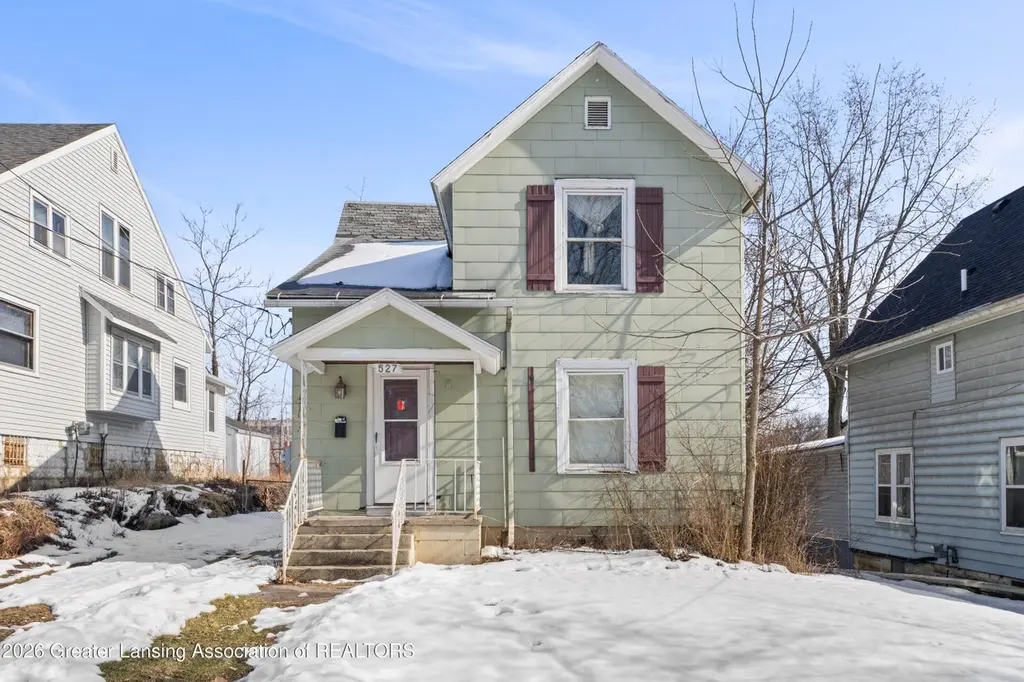
527 Beech St · Lansing, MI
Flood risk 6/10 · Moderate
- FEMA flood zone
- X (shaded)
- Chance of flooding over 30 yrs
- 0.75%
- Est. flood insurance / yr
- $473 – $860
Fire risk 1/10 · Minimal
- Est. fire insurance / yr
- $784 – $1,456
Heat risk 2/10 · Minimal
- Hot days now (above 96°F)
- 7 days/yr
- Hot days in 30 yrs
- 16 days/yr
Wind risk 2/10 · Minimal
- Chance of severe wind over 30 yrs
- —
Air-quality risk 2/10 · Minimal
- Unhealthy air days now
- 1 days/yr
- Unhealthy air days in 30 yrs
- 2 days/yr
Risk factors via First Street. Map © Google.
Why this score? — see what drove the B+ grade
The composite is a weighted blend of 9 inputs, each scored 0–100. Each bar is that input's sub-score; the figure is the points it added to the 100-point composite (weight × sub-score).
- Cash flow +30.0/30.0
- ARV discount +15.0/15.0
- 1% rule +10.0/10.0
- DSCR +10.0/10.0
- Rent growth +4.3/5.0
- Livability +4.0/5.0
- Condition / age +2.5/5.0
- Schools +1.9/10.0
- Appreciation +0.0/10.0
$70,000
🖨 Deal sheet 📄 Offer letter ✓ Due diligence
Listing remarks MLS
Attention investors and savvy buyers! Prime rental opportunity just minutes from Michigan State University, downtown Lansing, and major commuter routes. 527 Beech Street offers excellent potential for cash flow, appreciation, or a value-add project in a high-demand rental corridor. With a flexible floor plan, multiple living areas, and ample storage, this property is well suited for student rental, long-term tenants, or house-hack strategies. Convenient access to dining, shopping, entertainment, and public transportation enhances tenant appeal. Add this Lansing investment property to your portfolio and capitalize on strong local rental demand. Schedule your showing -- opportunities like this don't last.
Key facts
- Flexible floor plan
- Convenient access
- Ample storage
Tags
Neighborhood map
What this means for you Summary
Snapshot
- This is a 3-bed/1.0-bath single-family listed at $70k.
Deal economics
- At list price, monthly cash flow is $618 ($7k/yr) — positive.
- The deal already cash-flows at list — no discount required.
- Meets the 1% rule at list price ($1k rent vs $70k).
- Recommended offer: $64k (9.0% below list) — sets the bar for market timing.
- Cap rate 16.9% vs local median 6.0% in Lansing — top-decile yield for the area; either an underpriced asset or a hidden risk that comps aren't pricing in. Stress-test before assuming the spread holds.
Location & tenants
- Location reads 79/100 on livability (#94 in MI, #2,182 nationally) — a middle-class / working-renter tenant base. Strengths: amenities A+, commute A+, cost of living A+; Watch: employment D, schools F, crime F.
- Lansing Public School District (urban): math 14% / reading 23% proficiency, ranked #650 of 760 in MI (top 86%) — low school quality limits family demand, transient renter base, plan for 1-2y turnover; 68% free/reduced lunch — lower-income household profile, screen leases tightly.
- Market conditions: Rents rising fast (+7.0%/yr); 98 active listings in the ZIP; 26 comparable units currently listed for rent nearby; rentals lingering (median 44d on market — plan ~5-8 weeks vacancy on turnover, expect pricing pressure); 58% of comp listings sitting > 30 days — soft ceiling on asking rent; 350 units permitted in Ingham County in 2024 (186 in 5+ unit buildings).
- This rent runs 31% of the median local income ($54k/yr) — at the standard rent-burdened threshold; future hikes will face affordability resistance.
Forward outlook
- Local home prices are declining (-3.0%/yr); year-one equity from $484 of loan paydown is wiped out by about $2k of value loss. Plan a longer hold.
- Ingham County population projected at +11% by 2050 — modest demand growth; plan on rents tracking national, not racing it.
- At projected returns (-3.0% appreciation + 7.0% rent growth), your $20k cash investment doubles in ~3 years — after that, you're playing with house money.
Negotiation context
- It's been on market 120 days — a 9% lower offer ($64k) is reasonable based on typical stale-listing flexibility.
- 3 sale attempts since 17y ago with the ask held roughly flat each time — persistent listings suggest the price (not the market) is what's stuck; bring a comps-based counter.
- Current owner paid $10k; list at $70k implies a 600% gain — meaningful room to come down on a strong offer.
Risks & watch-outs
- Watch-outs: built in 1892 — expect roof / HVAC / electrical / plumbing capex.
- Climate carrying-cost: major flood risk — expect insurance premiums to compound above CPI over the hold.
Questions for the listing agent
- It's been on market 120 days. Have you received any prior offers? Is the seller open to a 9% concession, seller financing, or rate buy-down credit?
- Built in 1892 — when were the roof, HVAC, electrical panel, plumbing, and water heater last replaced?
- Why hasn't it sold? Are there any deal-killer items the seller is aware of (foundation, flood, title, zoning, code violations)?
- Is there a deadline driving the sale (1031 exchange, divorce, estate, relocation)? That informs how much negotiation room exists.
- Schools are F-rated, which usually means shorter tenancies and higher turnover. Who's the typical renter profile here, and what's been the actual vacancy rate?
- Crime grade is F in this area — have there been break-ins, vandalism, or insurance claims at this property in the last 3 years? What carrier currently insures it and at what premium?
- What's the average days-on-market for RENTAL listings here right now (not sales)? A rising rental-DOM trend means longer vacancies and softer asking-rent achievability than the comps imply.
- What's the recent tenant-quality profile in this submarket — average credit score on applications, eviction rate, late-payment / NSF rate, and stable-employment percentage? A property-management company in the area should have these aggregated.
- How much new for-sale + rental construction is in the pipeline within 1–3 miles? Heavy new supply typically softens prices + rents 12–24 months out; constrained supply supports both.
Investment metrics
- 1% rule
- 1.99% ✓
- Cap rate
- 16.89%
- Cash-on-cash
- 37.86%
- DSCR
- 2.68
- GRM
- 4.2
CMA / ARV
- ARV (median comp)
- $104,788
- List price
- $70,000
- Delta
- -33.20%
- Verdict
- UNDERPRICED
- Comps
- 20 within 1.0 mi
Show comp detail 12 sales within ~0.75 mi
| Address | Dist | Beds/Ba | Sqft | Sold | Price | $/sf | Match |
|---|---|---|---|---|---|---|---|
| 226 S 8th St | 0.30mi | 2/1.0 (-1) | 1,243 (-7%) | 4mo | $70,000 | $56 | 66 |
| 1116 Hickory St | 0.43mi | 3/1.5 | 1,232 (-8%) | 2mo | $70,612 | $57 | 63 |
| 1201 Climax St | 0.48mi | 3/2.0 | 1,408 (+5%) | 2mo | $157,000 | $112 | 63 |
| 213 S Bingham St | 0.47mi | 3/2.0 | 1,218 (-9%) | 0mo | $178,500 | $147 | 59 |
| 314 Bingham St | 0.40mi | 3/1.0 | 1,144 (-14%) | 2mo | $75,000 | $66 | 56 |
| 1022 S Grand Ave | 0.54mi | 3/1.0 | 1,478 (+11%) | 4mo | $42,500 | $29 | 54 |
| 129 E Elm St | 0.55mi | 4/2.0 (+1) | 1,433 (+7%) | 0mo | $159,900 | $112 | 53 |
| 316 Jones St | 0.47mi | 4/1.0 (+1) | 1,176 (-12%) | 1mo | $70,500 | $60 | 52 |
| 1240 Climax St | 0.57mi | 3/1.0 | 1,144 (-14%) | 0mo | $109,900 | $96 | 49 |
| 925 S Holmes St | 0.61mi | 3/2.5 | 1,478 (+11%) | 1mo | $139,900 | $95 | 47 |
| 514 Christiancy St | 0.74mi | 3/1.5 | 1,207 (-10%) | 4mo | $145,000 | $120 | 44 |
| 910 Vine St | 0.57mi | 4/3.0 (+1) | 1,508 (+13%) | 1mo | $145,000 | $96 | 38 |
Match score weights: distance 35% · size 25% · config 20% · recency 20%. Top-matched comps best support the ARV.
Projected returns pro-forma
-3.0% appreciation · 7.02% rent growth · sell at horizon
- IRR
- 38.4%
- Equity multiple
- 2.73×
- Total profit
- $33,935
- Equity at exit
- $10,437
- IRR
- 46.8%
- Equity multiple
- 6.43×
- Total profit
- $106,525
- Equity at exit
- $6,052
Cash invested: $19,600 (down + closing). Projections, not guarantees.
Landlord ↔ Tenant lean methodology
- Overall (STATE)
- 62 Landlord-Friendly
- State Michigan
- 62 Landlord-Friendly · EVEN
- County
- — inherits STATE
- City
- — inherits STATE
ZIP-level market 48912
- Rents YoY
- 7.0%
- Active inventory
- 98
- Price-to-rent
- 4.2×
Monthly cashflow live
- Estimated rent
- $1,395 high interval (Pro) →
- Mortgage (P&I)
- −$367
- Tax est. 1.5%
- −$88 /mo · $1,050/yr
- Insurance
- −$29
- HOA
- −$0
- Vacancy / Maint / Mgmt
- −$293
- Net cashflow
- $618
Break-even live
UW: 25.0% down · 7.5% · 30yr · 1.5% tax · 5.0% vac · 8.0% maint · 8.0% mgmt
Financing live
Cash to close
- Down payment
- $17,500
- Closing costs
- $2,100
- Reserves months
- —
- Total cash needed
- —
Loan-product check · same deal, 3 products live
Conventional
25% down · 7.5% · 30yr
- Down + closing
- —
- Monthly P&I
- —
- Monthly cashflow
- —
- DSCR
- —
- Eligible?
- —
Personal DTI + credit; lowest rate.
DSCR
20% down · 8.5% · 30yr
- Down + closing
- —
- Monthly P&I
- —
- Monthly cashflow
- —
- DSCR
- —
- Eligible?
- —
No personal income docs; deal must DSCR.
Hard money
10% down · 12.0% · 12mo
- Down + closing
- —
- Monthly P&I
- —
- Monthly cashflow
- —
- DSCR
- —
- Eligible?
- —
Short-term bridge; refi at stabilization.
Rent comps 26 comps
| Address | Beds | Baths | Sqft | Rent | $/sqft | DOM | Units | Dist |
|---|---|---|---|---|---|---|---|---|
| 507 S Hosmer St Lansing, MI | 2.0 | 1.0 | 1120 | $1,075 | $0.96 | 43d | 1 | 0.16mi |
| 805 Bement St Unit Hosmer 507 Lansing, MI | 2.0 | 1.0 | 1120 | $1,075 | $0.96 | 43d | 1 | 0.17mi |
| 605 S Grand Ave Unit 2 Lansing, MI | 4.0 | 1.0 | 1200 | $1,100 | $0.92 | 43d | 1 | 0.33mi |
| 401 S Washington Sq Unit 205 Lansing, MI | 2.0 | 1.0 | 968 | $1,355 | $1.40 | 43d | 1 | 0.41mi |
| 401 S Washington Sq Unit 201 Lansing, MI | 3.0 | 1.0 | 1254 | $1,560 | $1.24 | 43d | 1 | 0.42mi |
| 113 Pere Marquette Dr Lansing, MI | 1.0–2.0 | 1.0–2.0 | 1065 | $2,250 | $2.11 | 13d | 9 | 0.42mi |
| 1027 Climax St Lansing, MI | 3.0 | 1.5 | 1298 | $1,550 | $1.19 | 13d | 1 | 0.43mi |
| 1100 Malcolm X St Unit B Lansing, MI | 2.0 | 1.0 | 979 | $1,050 | $1.07 | 13d | 1 | 0.44mi |
| 208 S Bingham St Lansing, MI | 4.0 | 1.0 | 1020 | $1,500 | $1.47 | 13d | 1 | 0.46mi |
| 920 S Washington Ave Lansing, MI | 1.0–2.0 | 1.0–2.0 | 900 | $1,250 | $1.39 | 13d | 1 | 0.54mi |
| 910 Dakin St Lansing, MI | 3.0 | 1.0 | 908 | $1,295 | $1.43 | 43d | 1 | 0.69mi |
| 409 Lathrop St Lansing, MI | 2.0 | 1.0 | 1342 | $1,500 | $1.12 | 21d | 1 | 0.81mi |
| 921 Linden Grove Ave Lansing, MI | 3.0 | 1.0 | 1694 | $1,499 | $0.88 | 43d | 1 | 0.83mi |
| 433 Seymour Ave Unit 3 Lansing, MI | 3.0 | 1.0 | 1250 | $1,395 | $1.12 | 43d | 1 | 0.93mi |
| 620 May St Lansing, MI | 1.0–2.0 | 1.0–2.0 | 1126 | $1,578 | $1.40 | 13d | 12 | 0.97mi |
| 1629 E Michigan Ave Unit 306 Lansing, MI | 2.0 | 1.0 | 901 | $1,550 | $1.72 | 43d | 1 | 0.99mi |
| 524 N Walnut St Lansing, MI | 2.0 | 1.0 | 1000 | $1,150 | $1.15 | 43d | 1 | 1.02mi |
| 832 N Larch St Apt 3 Lansing, MI | 2.0 | 1.0 | 890 | $1,095 | $1.23 | 43d | 1 | 1.06mi |
| 329 S Clemens Ave Lansing, MI | 3.0 | 1.0 | 1194 | $1,400 | $1.17 | 21d | 1 | 1.11mi |
| 712 N Sycamore St Lansing, MI | 3.0 | 1.0 | 1100 | $1,650 | $1.50 | 21d | 1 | 1.28mi |
| 2222 E Michigan Ave Unit 411 Lansing, MI | 2.0 | 2.0 | 900 | $1,700 | $1.89 | 21d | 1 | 1.32mi |
| 2222 E Michigan Ave Unit 206 Lansing, MI | 2.0 | 2.0 | 900 | $1,700 | $1.89 | 43d | 1 | 1.32mi |
| 731 N Sycamore St Unit 1 Lansing, MI | 2.0 | 1.0 | 950 | $945 | $0.99 | 43d | 1 | 1.33mi |
| 1102 Clark St Lansing, MI | 3.0 | 1.0 | 1232 | $1,550 | $1.26 | 21d | 1 | 1.37mi |
| 1330 W Hillsdale St Lansing, MI | 3.0 | 1.0 | 1008 | $1,550 | $1.54 | 43d | 1 | 1.43mi |
| 414 N Hayford Ave Lansing, MI | 3.0 | 1.0 | 990 | $1,425 | $1.44 | 43d | 1 | 1.46mi |
Listing history 19 events
-
2026-06-16days on market $70,000 Active 120 DOM
-
2026-06-15days on market $70,000 Active 119 DOM
-
2026-06-14days on market $70,000 Active 117 DOM
-
2026-06-13days on market $70,000 Active 116 DOM
-
2026-06-10days on market $70,000 Active 114 DOM
-
2026-06-09days on market $70,000 Active 113 DOM
-
2026-06-08days on market $70,000 Active 112 DOM
-
2026-06-07days on market $70,000 Active 111 DOM
-
2026-06-05days on market $70,000 Active 108 DOM
-
2026-06-03days on market $70,000 Active 107 DOM
-
2026-06-02days on market $70,000 Active 106 DOM
-
2026-06-01days on market $70,000 Active 105 DOM
-
2026-05-31days on market $70,000 Active 104 DOM
-
2026-05-30days on market $70,000 Active 103 DOM
-
2026-02-16$70,000 Active 712-char remark
Show marketing remark (719 chars)
Attention investors and savvy buyers! Prime rental opportunity just minutes from Michigan State University, downtown Lansing, and major commuter routes. 527 Beech Street offers excellent potential for cash flow, appreciation, or a value-add project in a high-demand rental corridor. With a flexible floor plan, multiple living areas, and ample storage, this property is well suited for student rental, long-term tenants, or house-hack strategies. Convenient access to dining, shopping, entertainment, and public transportation enhances tenant appeal. Add this Lansing investment property to your portfolio and capitalize on strong local rental demand. Schedule your showing — opportunities like this don't last.
-
2026-02-16$70,000 Active 719-char remark
Show marketing remark (719 chars)
Attention investors and savvy buyers! Prime rental opportunity just minutes from Michigan State University, downtown Lansing, and major commuter routes. 527 Beech Street offers excellent potential for cash flow, appreciation, or a value-add project in a high-demand rental corridor. With a flexible floor plan, multiple living areas, and ample storage, this property is well suited for student rental, long-term tenants, or house-hack strategies. Convenient access to dining, shopping, entertainment, and public transportation enhances tenant appeal. Add this Lansing investment property to your portfolio and capitalize on strong local rental demand. Schedule your showing — opportunities like this don't last.
-
2010-09-03soldstatus $10,000
-
2009-12-04$19,900
-
2003-10-08soldstatus $42,000
ⓘ Source: listings_history table (triggers on properties + properties_extension) + one-shot
backfill from property_details.listing_events for pre-trigger history.
Climate risk First Street
- Flood 6/10 Major FEMA zone X (shaded) · 75% chance over 30 yrs
- Wildfire 1/10 Low
- Heat 2/10 Low 7 d/yr ≥96°F today · 16 d/yr by 30 yrs out
- Wind 2/10 Low
- Air quality 2/10 Low 1 unhealthy d/yr today · 2 by 30 yrs out
Nearby sold comps map
Loading sold comps map…
Walkable amenities ~0.75 mi
Loading nearby amenities…
Taxation est. · year 1
- Rental income
- $16,741
- − Mortgage interest
- −$3,921
- − Property taxes
- −$1,050
- − Insurance
- −$350
- − Repairs & maintenance
- −$1,339
- − Management
- −$1,339
- − Depreciation
- −$2,036
- Taxable income
- $6,705
- Est. tax owed @ 24.0%
- −$1,609
- After-tax cash flow
- $5,811/yr
For passive investors: Depreciation is non-cash, so a rental often shows a tax loss while cash-flowing — sheltering income. Rental losses are passive: they offset passive income freely, and up to $25,000/yr can offset ordinary (W-2) income if you actively participate and your MAGI is under $100k (phasing out to $0 by $150k); unused losses carry forward. On sale, claimed depreciation is recaptured at up to 25%, and gains may owe capital-gains tax (a 1031 exchange can defer both). Figures are a year-1 estimate at your 24.0% rate — not tax advice; consult a CPA.
Schools (NCES district)
- District
- Lansing Public School District
- NCES district ID
- 2621150
- Math proficiency
- 14% ▲ 1.00%
- Reading proficiency
- 23% ▲ 3.00%
- Median HH income
- $37,453
- Composite
- 18.76/100
- National rank
- #14002
- State rank
- #650 of 760 in MI
Livability — Lansing
- Score
- 79/100
- State rank
- #94
- US rank
- #2182
Category grades
Schools grade is shown separately in the Schools card above.
Census & demographics
- Census place
- Lansing, MI
- County
- Ingham County · 237,052 people
- City population
- 161,269
- Metro
- Lansing-East Lansing, MI
- Population (ZIP)
- 17,674
- Household income
- $54,429
- Rent vs Own
- Severe rent burden
- 1171.0
Population outlook (Ingham County) Hauer SSP2
- Today (2025)
- 300,362 people
- By 2030
- 307,808 · +2.5%
- By 2040
- 320,492 · +6.7%
- By 2050
- 333,223 · +10.9%
- By 2075
- 373,693 · +24.4%
- By 2100
- 392,021 · +30.5%
Race, ethnicity, and origin ACS 2023
- Neighborhood character
- Diverse neighborhood (Simpson 0.62)
- Race & ethnicity
- White 56% Black 22% Two or more races 12% Hispanic / Latino 10% Asian 4%
- Hispanic origin (detail)
- Mexican 6% Cuban 1%
- Common ancestry
- Romanian 5% Iranian 4% Lithuanian 3%
- Foreign-born
- 12% · Canada, Vietnam, China
- Languages at home
- 84% English-only · Spanish 5% French/Haitian/Cajun 1% Korean 1%
Political lean MEDSL · Ingham
- 2024 margin
- Strong D (+29.7) · D 63.9% · R 34.2% · Other 2.0%
- 2008→2024 swing
- -3.6pp toward R · 2008: 33.3pp · 2024: 29.7pp
- All cycles
- 2024: D+29.7 2020: D+32.2 2016: D+27.6 2012: D+27.9 2008: D+33.3
Not yet ingested
- Civics
- —
Market trends
- HPI YoY
- ▼ -167.67%
- Current HPI
- 171.1549
- Rent YoY
- ▲ 7.02%
- Metro
- Lansing-East Lansing, MI
- State GDP YoY
- ▲ 1.37%
- F500 in state
- 28
Industry mix (Fortune 500 HQ in MI)
| Industry | F500 HQs | Revenue |
|---|---|---|
| Automotive Parts | 3 | $48B |
|
||
| Automotive | 2 | $372B |
|
||
| Chemicals | 1 | $45B |
|
||
| Automotive Retail | 1 | $29B |
|
||
| Healthcare / Medical Devices | 1 | $23B |
|
||
| Automotive Technology | 1 | $20B |
|
||
Price history
+66.7% since first listed5 events — show timeline
- 2026-02-16 Listed $70,000 REALCOMP
- 2026-02-16 Listed $70,000 Greater Lansing AoR
- 2010-09-03 Sold (MLS) $10,000 Greater Lansing AoR
- 2009-12-04 Listed $19,900 Greater Lansing AoR
- 2003-10-08 Sold (Public Records) $42,000 Public Records
Property tax history
+7.3%/yrLatest (2025): $4,340 · +53.6% YoY. Source: county tax records.
Cash-flow waterfall
monthlySold comps — $/sqft
last 12 mo · ≤1 miLoading sold comps…