10640 E Brook Rd · Raintree Plantation, MO
Flood risk 1/10 · Minimal
- FEMA flood zone
- X (unshaded)
- Chance of flooding over 30 yrs
- 0.0%
- Est. flood insurance / yr
- $507 – $1,088
Fire risk 4/10 · Minor
- Est. fire insurance / yr
- $1,054 – $1,958
Heat risk 4/10 · Minor
- Hot days now (above 106°F)
- 7 days/yr
- Hot days in 30 yrs
- 20 days/yr
Wind risk 2/10 · Minimal
- Chance of severe wind over 30 yrs
- 1.0%
Air-quality risk 1/10 · Minimal
- Unhealthy air days now
- 0 days/yr
- Unhealthy air days in 30 yrs
- 0 days/yr
Risk factors via First Street. Map © Google.
Why this score? — see what drove the C+ grade
The composite is a weighted blend of 9 inputs, each scored 0–100. Each bar is that input's sub-score; the figure is the points it added to the 100-point composite (weight × sub-score).
- Cash flow +28.2/30.0
- DSCR +10.0/10.0
- 1% rule +8.3/10.0
- ARV discount +7.5/15.0
- Schools +3.0/10.0
- Rent growth +2.5/5.0
- Livability +2.5/5.0
- Condition / age +2.5/5.0
- Appreciation +0.0/10.0
$99,900
🖨 Deal sheet 📄 Offer letter ✓ Due diligence
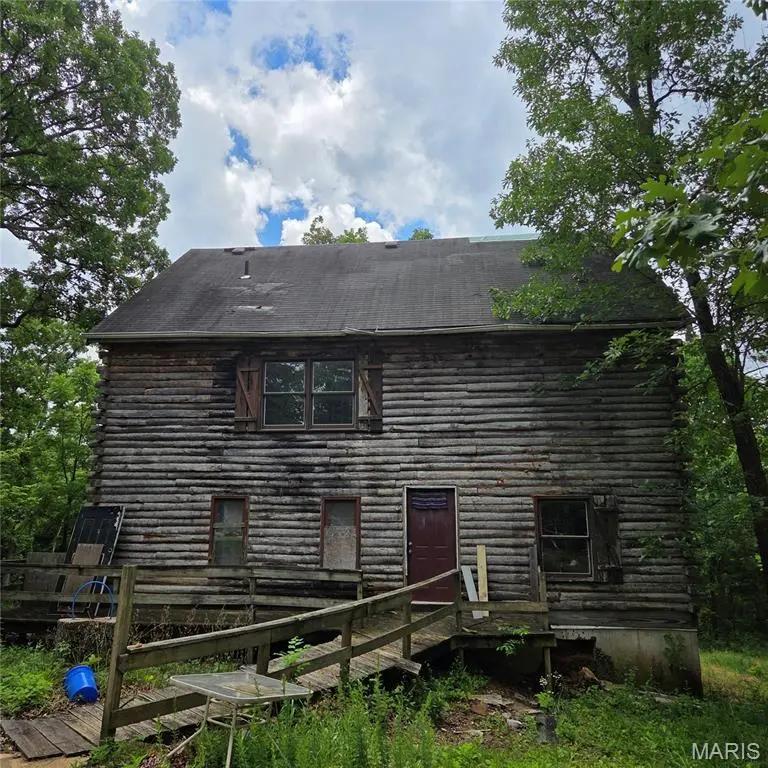
Listing remarks
Unique log cabin style home with over 2,300 sq ft of living space, over 5.8 acres and 2 caves. This house boasts 6 bedrooms and 2 full baths as well as a lot of space to entertain. This home has good bones but is in need of a full rehab.
Key facts
- 5.81 acre lot
- Built 1980
- Listed 9 days
Property features AI
Finance
- Other: Approximately 5.81 acres
Exterior
- Utilities: Well water; Septic tank; Electric service by Ameren; Electricity available
- Home design: Single family residence; Two levels; Residential property
- Construction: Log construction
- Exterior features: Adjoins wooded area; Heavy woods; Native plants on the lot
Interior
- Bedrooms: 6 bedrooms total; 2 bedrooms on the main level; 4 bedrooms on the upper level
- Bathrooms: 2 full bathrooms total; 1 full bathroom on the main level; 1 full bathroom on the upper level
- Interior features: Forced air heating; Central air conditioning; Basement with 8 ft+ poured concrete
Neighborhood map
What this means for you Summary
Snapshot
- This is a 6-bed/2.0-bath other listed at $100k.
Deal economics
- At list price, monthly cash flow is $318 ($4k/yr) — positive.
- The deal already cash-flows at list — no discount required.
- Meets the 1% rule at list price ($1k rent vs $100k).
- Cap rate 10.1% vs local median 1.8% in Raintree Plantation — top-decile yield for the area; either an underpriced asset or a hidden risk that comps aren't pricing in. Stress-test before assuming the spread holds.
Location & tenants
- Location reads: area grade C — affects rentability + tenant quality, not the cash-flow math above.
- Grandview R-II (rural): math 27% / reading 43% proficiency, ranked #205 of 324 in MO (top 63%) — families likely to look elsewhere, expect single-tenant / working-renter base with shorter leases.
- Zoned schools: Grandview Elem. (math 37% / reading 52%, grade F, #413 of 1,115 statewide, top 42%, 230 students, 51% FRL); Grandview High (math 17% / reading 52%, grade F, #321 of 521 statewide, top 67%, 261 students, 37% FRL) — zoned schools at 44% FRL track the district average.
- Market conditions: 24 active listings in the ZIP; 807 units permitted in Jefferson County in 2024 (104 in 5+ unit buildings).
Forward outlook
- Local home prices are declining (-3.0%/yr); year-one equity from $691 of loan paydown is wiped out by about $3k of value loss. Plan a longer hold.
- At projected returns (-3.0% appreciation + 3.0% rent growth), your $28k cash investment doubles in ~9 years — after that, you're playing with house money.
Negotiation context
- Only 9 days on market — expect competitive offers; lowballing is unlikely to land.
- 4 sale attempts since 3y ago with the ask held roughly flat each time — persistent listings suggest the price (not the market) is what's stuck; bring a comps-based counter.
Questions for the listing agent
- Is there a deadline driving the sale (1031 exchange, divorce, estate, relocation)? That informs how much negotiation room exists.
- What's the average days-on-market for RENTAL listings here right now (not sales)? A rising rental-DOM trend means longer vacancies and softer asking-rent achievability than the comps imply.
- What's the recent tenant-quality profile in this submarket — average credit score on applications, eviction rate, late-payment / NSF rate, and stable-employment percentage? A property-management company in the area should have these aggregated.
- How much new for-sale + rental construction is in the pipeline within 1–3 miles? Heavy new supply typically softens prices + rents 12–24 months out; constrained supply supports both.
Investment metrics
- 1% rule
- 1.33% ✓
- Cap rate
- 10.11%
- Cash-on-cash
- 13.65%
- DSCR
- 1.61
- GRM
- 6.3
CMA / ARV
No comps found within radius.
Projected returns pro-forma
-3.0% appreciation · 3.0% rent growth · sell at horizon
- IRR
- 3.8%
- Equity multiple
- 1.15×
- Total profit
- $4,120
- Equity at exit
- $14,895
- IRR
- 13.4%
- Equity multiple
- 2.07×
- Total profit
- $29,866
- Equity at exit
- $8,638
Cash invested: $27,972 (down + closing). Projections, not guarantees.
Landlord ↔ Tenant lean methodology
- Overall (STATE)
- 81 Strongly Landlord-Friendly
- State Missouri
- 81 Strongly Landlord-Friendly · R+10
- County
- — inherits STATE
- City
- — inherits STATE
ZIP-level market 63023
- Home prices YoY
- -17.6%
- Active inventory
- 24
- Price-to-rent
- 6.3×
Monthly cashflow live
- Estimated rent
- $1,331 medium interval (Pro) →
- Mortgage (P&I)
- −$524
- Tax from tax record
- −$168 /mo · $2,014/yr
- Insurance
- −$42
- HOA
- −$0
- Vacancy / Maint / Mgmt
- −$280
- Net cashflow
- $318
Break-even live
UW: 25.0% down · 7.5% · 30yr · 1.5% tax · 5.0% vac · 8.0% maint · 8.0% mgmt
Financing live
Cash to close
- Down payment
- $24,975
- Closing costs
- $2,997
- Reserves months
- —
- Total cash needed
- —
Loan-product check · same deal, 3 products live
Conventional
25% down · 7.5% · 30yr
- Down + closing
- —
- Monthly P&I
- —
- Monthly cashflow
- —
- DSCR
- —
- Eligible?
- —
Personal DTI + credit; lowest rate.
DSCR
20% down · 8.5% · 30yr
- Down + closing
- —
- Monthly P&I
- —
- Monthly cashflow
- —
- DSCR
- —
- Eligible?
- —
No personal income docs; deal must DSCR.
Hard money
10% down · 12.0% · 12mo
- Down + closing
- —
- Monthly P&I
- —
- Monthly cashflow
- —
- DSCR
- —
- Eligible?
- —
Short-term bridge; refi at stabilization.
Listing history 8 events
-
2026-06-18days on market $99,900 Active 9 DOM
-
2026-06-17days on market $99,900 Active 8 DOM
-
2026-06-16days on market $99,900 Active 7 DOM
-
2026-06-15days on market $99,900 Active 6 DOM
-
2026-06-14days on market $99,900 Active 4 DOM
-
2026-06-12days on market $99,900 Active 3 DOM
-
2026-06-09remarks 237-char remark
-
2026-06-09$99,900 Active 1 DOM
ⓘ Source: listings_history table (triggers on properties + properties_extension) + one-shot
backfill from property_details.listing_events for pre-trigger history.
Tax reassessment forecast MO · Resets to sale price
- Current annual tax
- $2,014 · $168/mo
- Projected year-2 tax
- $2,014 · $168/mo
- Expected delta
- $0/yr ($0/mo · -0.0%)
ⓘ Screening estimate from a state-policy table — verify with the county assessor before closing.
Climate risk First Street
- Flood 1/10 Low FEMA zone X (unshaded) · 0% chance over 30 yrs
- Wildfire 4/10 Moderate
- Heat 4/10 Moderate 7 d/yr ≥106°F today · 20 d/yr by 30 yrs out
- Wind 2/10 Low 100% chance of damaging wind over 30 yrs
- Air quality 1/10 Low 0 unhealthy d/yr today · 0 by 30 yrs out
Nearby sold comps map
Loading sold comps map…
Walkable amenities ~0.75 mi
Loading nearby amenities…
Taxation est. · year 1
- Rental income
- $15,972
- − Mortgage interest
- −$5,596
- − Property taxes
- −$2,014
- − Insurance
- −$500
- − Repairs & maintenance
- −$1,278
- − Management
- −$1,278
- − Depreciation
- −$2,906
- Taxable income
- $2,401
- Est. tax owed @ 24.0%
- −$576
- After-tax cash flow
- $3,241/yr
For passive investors: Depreciation is non-cash, so a rental often shows a tax loss while cash-flowing — sheltering income. Rental losses are passive: they offset passive income freely, and up to $25,000/yr can offset ordinary (W-2) income if you actively participate and your MAGI is under $100k (phasing out to $0 by $150k); unused losses carry forward. On sale, claimed depreciation is recaptured at up to 25%, and gains may owe capital-gains tax (a 1031 exchange can defer both). Figures are a year-1 estimate at your 24.0% rate — not tax advice; consult a CPA.
Schools (NCES district)
- District
- Grandview R-II
- NCES district ID
- 2913170
- Math proficiency
- 27% ▼ -14.00%
- Reading proficiency
- 43% ▼ -4.00%
- Median HH income
- $50,090
- Composite
- 30.3/100
- National rank
- #6277
- State rank
- #205 of 324 in MO
Livability — Raintree Plantation
No livability data for this city. (Only ~50 U.S. cities are tracked.)
Census & demographics
- Population (ZIP)
- 5,442
Population outlook (Jefferson County) Hauer SSP2
- Today (2025)
- 235,088 people
- By 2030
- 238,365 · +1.4%
- By 2040
- 240,156 · +2.2%
- By 2050
- 234,651 · -0.2%
- By 2075
- 214,569 · -8.7%
- By 2100
- 179,697 · -23.6%
Race, ethnicity, and origin ACS 2023
- Neighborhood character
- Predominantly White (94%)
- Race & ethnicity
- White 94% Two or more races 4%
- Common ancestry
- Slovak 4% Italian 4% Lithuanian 2%
Political lean MEDSL · Jefferson
- 2024 margin
- Solid R (+36.7) · D 31.0% · R 67.7% · Other 1.3%
- 2008→2024 swing
- -39.3pp toward R · 2008: 2.5pp · 2024: -36.7pp
- All cycles
- 2024: R+36.7 2020: R+33.9 2016: R+35.3 2012: R+12.7 2008: D+2.5
Not yet ingested
- Civics
- —
Market trends
- HPI YoY
- ▼ -44.73%
- Current HPI
- 209.9074
- Rent YoY
- —
- Metro
- —
- State GDP YoY
- ▲ 1.84%
- F500 in state
- 20
Industry mix (Fortune 500 HQ in MO)
| Industry | F500 HQs | Revenue |
|---|---|---|
| Healthcare | 1 | $163B |
|
||
| Insurance | 1 | $21B |
|
||
| Industrial Technology | 1 | $17B |
|
||
| Retail | 1 | $16B |
|
||
| Industrial Distribution | 1 | $10B |
|
||
| Utilities | 1 | $9B |
|
||
Price history
+17.5% since first listed9 events — show timeline
- 2026-06-09 Listed $99,900 MARIS as Distributed by MLS Grid
- 2025-04-18 Delisted — MARIS as Distributed by MLS Grid
- 2025-03-07 Listed $110,000 MARIS as Distributed by MLS Grid
- 2024-04-10 Delisted — MARIS as Distributed by MLS Grid
- 2024-03-20 Contingent — MARIS as Distributed by MLS Grid
- 2024-03-19 Listed $50,000 MARIS as Distributed by MLS Grid
- 2023-08-13 Delisted — MARIS as Distributed by MLS Grid
- 2023-08-03 Price Changed $67,000 MARIS as Distributed by MLS Grid
- 2023-07-18 Listed $85,000 MARIS as Distributed by MLS Grid
Property tax history
+2.4%/yrLatest (2025): $2,014 · +6.0% YoY. Source: county tax records.
Cash-flow waterfall
monthlySold comps — $/sqft
last 12 mo · ≤1 miLoading sold comps…