1263 Hillridge Dr · Macon-Bibb County, GA
Flood risk 1/10 · Minimal
- FEMA flood zone
- X (unshaded)
- Chance of flooding over 30 yrs
- 0.0%
- Est. flood insurance / yr
- $507 – $1,088
Fire risk 2/10 · Minimal
- Est. fire insurance / yr
- $963 – $1,789
Heat risk 7/10 · Major
- Hot days now (above 109°F)
- 7 days/yr
- Hot days in 30 yrs
- 18 days/yr
Wind risk 6/10 · Moderate
- Chance of severe wind over 30 yrs
- 66.0%
Air-quality risk 3/10 · Minor
- Unhealthy air days now
- 3 days/yr
- Unhealthy air days in 30 yrs
- 4 days/yr
Risk factors via First Street. Map © Google.
Why this score? — see what drove the C+ grade
The composite is a weighted blend of 9 inputs, each scored 0–100. Each bar is that input's sub-score; the figure is the points it added to the 100-point composite (weight × sub-score).
- Cash flow +30.0/30.0
- 1% rule +10.0/10.0
- DSCR +10.0/10.0
- ARV discount +4.5/15.0
- Rent growth +3.8/5.0
- Livability +2.5/5.0
- Condition / age +2.5/5.0
- Schools +1.2/10.0
- Appreciation +0.0/10.0
$38,000
🖨 Deal sheet 📄 Offer letter ✓ Due diligence
Listing remarks MLS
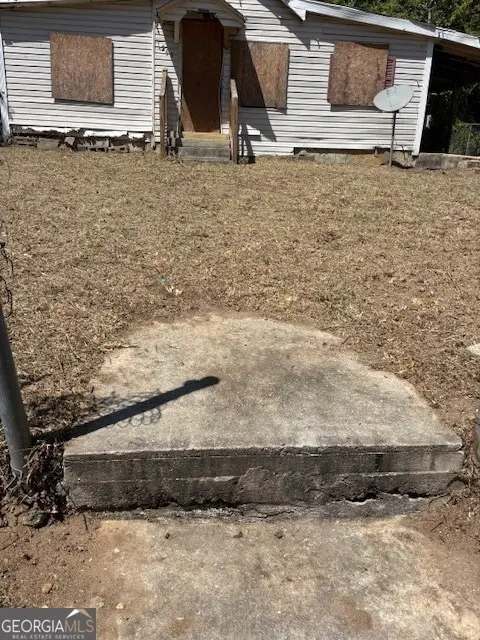
NOTICE TO RESIDENTIAL INVESTORS! Are you looking for a FIXER-UPPER? You have found it! New on the market, three bedrooms located in an established neighborhood. Quick and easy access to I-75, shopping, schools and eateries.
Key facts
- Eateries
- Shopping
- Quick access to i-75
Tags
Property features AI
Finance
- Other: Lot approximately 0.20 acre (8,712 sq ft); Subdivision: Bedingfield; Located in Macon, GA 31206
- HOA & community: No association
Exterior
- Parking: Off-street parking
- Utilities: Public water; Public sewer; Cable available; Electricity available; High-speed internet available; Natural gas available
- Home design: Single family residence; House structure; Resale property
- Construction: Built in 1955; Wood siding; Composition roof; Crawl space foundation
- Exterior features: City lot
Interior
- Kitchen: No appliances reported
- Bedrooms: Three bedrooms on the main level
- Flooring: Flooring listed as 'Other'
- Bathrooms: One full bathroom on the main level
- Heating & cooling: No heating; No cooling
- Interior features: One-level living; Family room; Additional living space labeled as 'Other'; Crawl space basement
- Laundry & utility: Laundry listed as 'Other'
Neighborhood map
What this means for you Summary
Snapshot
- This is a 3-bed/1.0-bath single-family listed at $38k.
Deal economics
- At list price, monthly cash flow is $531 ($6k/yr) — positive.
- The deal already cash-flows at list — no discount required.
- Meets the 1% rule at list price ($1k rent vs $38k).
- Recommended offer: $37k (3.0% below list) — sets the bar for market timing.
- Cap rate 23.1% vs local median 5.4% in Macon-Bibb County — top-decile yield for the area; either an underpriced asset or a hidden risk that comps aren't pricing in. Stress-test before assuming the spread holds.
Location & tenants
- Location reads: area grade C — affects rentability + tenant quality, not the cash-flow math above.
- Bibb County (urban): math 11% / reading 18% proficiency, ranked #161 of 174 in GA (top 92%) — low school quality limits family demand, transient renter base, plan for 1-2y turnover; 75% free/reduced lunch — lower-income household profile, screen leases tightly.
- Zoned schools: Bruce Elementary School (math 2% / reading 2%, grade F, #1,204 of 1,228 statewide, top 100%, 434 students, 100% FRL); Rutland Middle School (math 12% / reading 28%, grade F, #349 of 470 statewide, top 75%, 812 students, 100% FRL); Rutland High School (math 2% / reading 8%, grade F, #394 of 424 statewide, top 97%, 907 students, 100% FRL) — zoned schools average 100% FRL vs 75% district-wide (25 pts higher); higher-poverty schools than district average — tighter screening recommended.
- Market conditions: Rents rising fast (+5.0%/yr); 207 active listings in the ZIP; 29 comparable units currently listed for rent nearby; rentals lingering (median 44d on market — plan ~5-8 weeks vacancy on turnover, expect pricing pressure); 59% of comp listings sitting > 30 days — soft ceiling on asking rent; lower-income renter base — watch delinquency; 154 units permitted in Bibb County in 2024 (0 in 5+ unit buildings).
Forward outlook
- Local home prices are declining (-3.0%/yr); year-one equity from $263 of loan paydown is wiped out by about $1k of value loss. Plan a longer hold.
- Bibb County population projected at -12% by 2050 — secular population decline; favor cash flow + early exit over multi-decade hold.
- At projected returns (-3.0% appreciation + 5.0% rent growth), your $11k cash investment doubles in ~2 years — after that, you're playing with house money.
Negotiation context
- It's been on market 54 days — a 3% lower offer ($37k) is reasonable based on typical stale-listing flexibility.
- 7 sale attempts with the ask held roughly flat each time — persistent listings suggest the price (not the market) is what's stuck; bring a comps-based counter.
- Current owner paid $26k; 46% above their basis — modest negotiation headroom, anchor on the comps not their cost.
Risks & watch-outs
- Watch-outs: property tax is 3.6% of price; built in 1955 — expect roof / HVAC / electrical / plumbing capex.
- Climate carrying-cost: major wind risk, 66% chance of damaging wind over 30y; extreme-heat days projected 7→18/yr by 2055 (HVAC capex compounding) — expect insurance premiums to compound above CPI over the hold.
Questions for the listing agent
- It's been on market 54 days. Have you received any prior offers? Is the seller open to a 3% concession, seller financing, or rate buy-down credit?
- Built in 1955 — when were the roof, HVAC, electrical panel, plumbing, and water heater last replaced?
- Property tax is high relative to price — has the assessment been appealed recently, and will the sale trigger a re-assessment?
- Is there a deadline driving the sale (1031 exchange, divorce, estate, relocation)? That informs how much negotiation room exists.
- What's the average days-on-market for RENTAL listings here right now (not sales)? A rising rental-DOM trend means longer vacancies and softer asking-rent achievability than the comps imply.
- What's the recent tenant-quality profile in this submarket — average credit score on applications, eviction rate, late-payment / NSF rate, and stable-employment percentage? A property-management company in the area should have these aggregated.
- How much new for-sale + rental construction is in the pipeline within 1–3 miles? Heavy new supply typically softens prices + rents 12–24 months out; constrained supply supports both.
Investment metrics
- 1% rule
- 2.87% ✓
- Cap rate
- 23.07%
- Cash-on-cash
- 59.90%
- DSCR
- 3.67
- GRM
- 2.9
CMA / ARV
- ARV (median comp)
- $35,591
- List price
- $38,000
- Delta
- 6.77%
- Verdict
- FAIR
- Comps
- 20 within 1.0 mi
Show comp detail 12 sales within ~0.75 mi
| Address | Dist | Beds/Ba | Sqft | Sold | Price | $/sf | Match |
|---|---|---|---|---|---|---|---|
| 1322 Triple Hill Dr | 0.16mi | 2/1.0 (-1) | 1,117 (+3%) | 6mo | $27,500 | $25 | 77 |
| 1347 Schley St | 0.48mi | 3/1.0 | 1,063 (-2%) | 1mo | $45,500 | $43 | 74 |
| 1388 Lakeview Cir | 0.32mi | 2/1.0 (-1) | 1,140 (+6%) | 6mo | $35,000 | $31 | 65 |
| 4055 Emory Dr | 0.27mi | 3/1.0 | 1,216 (+13%) | 2mo | $58,000 | $48 | 65 |
| 1151 N Beddingfield Dr | 0.68mi | 3/1.0 | 1,080 (0%) | 9mo | $125,000 | $116 | 61 |
| 4370 Mikado Ave | 0.59mi | 2/1.5 (-1) | 1,098 (+2%) | 6mo | $50,000 | $46 | 57 |
| 1071 Sylvian Dr | 0.51mi | 3/1.0 | 1,001 (-7%) | 9mo | $53,000 | $53 | 56 |
| 3366 Pio Nono Cir | 0.60mi | 3/1.0 | 962 (-11%) | 8mo | $106,000 | $110 | 47 |
| 3366 Pio Nono Cir | 0.60mi | 3/1.0 | 962 (-11%) | 8mo | $106,000 | $110 | 47 |
| 4283 Worsham Ave | 0.65mi | 3/2.0 | 1,000 (-7%) | 8mo | $29,000 | $29 | 47 |
| 1317 Peavy Dr | 0.57mi | 2/1.0 (-1) | 936 (-13%) | 2mo | $52,000 | $56 | 44 |
| 1254 W Grenada Ter | 0.72mi | 3/2.0 | 1,188 (+10%) | 3mo | $100,000 | $84 | 43 |
Match score weights: distance 35% · size 25% · config 20% · recency 20%. Top-matched comps best support the ARV.
Projected returns pro-forma
-3.0% appreciation · 5.03% rent growth · sell at horizon
- IRR
- 61.2%
- Equity multiple
- 3.82×
- Total profit
- $29,998
- Equity at exit
- $5,666
- IRR
- 66.5%
- Equity multiple
- 8.48×
- Total profit
- $79,625
- Equity at exit
- $3,286
Cash invested: $10,640 (down + closing). Projections, not guarantees.
Landlord ↔ Tenant lean methodology
- Overall (STATE)
- 90 Strongly Landlord-Friendly
- State Georgia
- 90 Strongly Landlord-Friendly · R+3
- County
- — inherits STATE
- City
- — inherits STATE
ZIP-level market 31206
- Rents YoY
- 5.0%
- Active inventory
- 207
- Price-to-rent
- 2.9×
Monthly cashflow live
- Estimated rent
- $1,089 high interval (Pro) →
- Mortgage (P&I)
- −$199
- Tax from tax record
- −$114 /mo · $1,373/yr
- Insurance
- −$16
- HOA
- −$0
- Vacancy / Maint / Mgmt
- −$229
- Net cashflow
- $531
Break-even live
UW: 25.0% down · 7.5% · 30yr · 1.5% tax · 5.0% vac · 8.0% maint · 8.0% mgmt
Financing live
Cash to close
- Down payment
- $9,500
- Closing costs
- $1,140
- Reserves months
- —
- Total cash needed
- —
Loan-product check · same deal, 3 products live
Conventional
25% down · 7.5% · 30yr
- Down + closing
- —
- Monthly P&I
- —
- Monthly cashflow
- —
- DSCR
- —
- Eligible?
- —
Personal DTI + credit; lowest rate.
DSCR
20% down · 8.5% · 30yr
- Down + closing
- —
- Monthly P&I
- —
- Monthly cashflow
- —
- DSCR
- —
- Eligible?
- —
No personal income docs; deal must DSCR.
Hard money
10% down · 12.0% · 12mo
- Down + closing
- —
- Monthly P&I
- —
- Monthly cashflow
- —
- DSCR
- —
- Eligible?
- —
Short-term bridge; refi at stabilization.
Rent comps 29 comps
| Address | Beds | Baths | Sqft | Rent | $/sqft | DOM | Units | Dist |
|---|---|---|---|---|---|---|---|---|
| 1240 Rocky Creek Rd Unit A Macon, GA | 4.0 | 1.0 | 1342 | $1,090 | $0.81 | 21d | 1 | 0.12mi |
| 1289 Rocky Creek Rd Macon, GA | 2.0 | 1.0 | 1404 | $750 | $0.53 | 43d | 1 | 0.13mi |
| 1332 Hillridge Dr Macon, GA | 3.0 | 2.0 | 1050 | $1,050 | $1.00 | 13d | 1 | 0.18mi |
| 1156 Triple Hill Dr Macon, GA | 2.0 | 1.0 | 980 | $875 | $0.89 | 13d | 1 | 0.28mi |
| 4028 Saint Charles Pl Macon, GA | 3.0 | 1.0 | 900 | $800 | $0.89 | 21d | 1 | 0.50mi |
| 1260 Auburn Dr Macon, GA | 3.0 | 1.0 | 864 | $1,075 | $1.24 | 43d | 1 | 0.53mi |
| 1260 Auburn Dr Macon, GA | 3.0 | 1.0 | 864 | $1,295 | $1.50 | 21d | 1 | 0.53mi |
| 4322 Mikado Ave Macon, GA | 3.0 | 2.0 | 1344 | $1,230 | $0.92 | 21d | 1 | 0.55mi |
| 1148 N Beddingfield Dr Macon, GA | 3.0 | 1.0 | 1076 | $825 | $0.77 | 43d | 1 | 0.56mi |
| 906 Thomas St Macon, GA | 2.0 | 1.0 | 800 | $650 | $0.81 | 43d | 1 | 0.61mi |
| 955 Putnam St Unit 1 Macon, GA | 3.0 | 1.0 | 950 | $1,199 | $1.26 | 43d | 1 | 0.63mi |
| 3823 Saint Charles Pl Macon, GA | 3.0 | 1.0 | 1020 | $1,150 | $1.13 | 43d | 1 | 0.63mi |
| 832 Richmond St Macon, GA | 3.0 | 1.0 | 1364 | $925 | $0.68 | 21d | 1 | 0.65mi |
| 846 Bedingfield Ave Macon, GA | 3.0 | 1.5 | 1187 | $975 | $0.82 | 43d | 1 | 0.68mi |
| 3685 Rice Mill Rd Macon, GA | 3.0 | 1.0 | 1152 | $1,450 | $1.26 | 43d | 1 | 0.70mi |
| 3778 Spencer Cir Macon, GA | 3.0 | 1.0 | 864 | $1,300 | $1.50 | 21d | 1 | 0.72mi |
| 3837 Spencer Cir Macon, GA | 3.0 | 1.0 | 1080 | $1,300 | $1.20 | 43d | 1 | 0.80mi |
| 1164 Newberg Ave Macon, GA | 3.0 | 1.0 | 1100 | $1,195 | $1.09 | 43d | 1 | 0.88mi |
| 3238 Somerset Dr Macon, GA | 3.0 | 1.0 | 1100 | $975 | $0.89 | 13d | 1 | 0.96mi |
| 3709 Flamingo Dr Macon, GA | 3.0 | 1.0 | 1360 | $1,300 | $0.96 | 43d | 1 | 0.99mi |
| 837 Newberg Ave Macon, GA | 3.0 | 1.0 | 966 | $750 | $0.78 | 43d | 1 | 1.07mi |
| 4011 Marion Ave Macon, GA | 2.0 | 1.0 | 1200 | $1,200 | $1.00 | 21d | 1 | 1.08mi |
| 3149 Somerset Dr Macon, GA | 2.0 | 1.0 | 897 | $745 | $0.83 | 43d | 1 | 1.09mi |
| 524 Carmen Pl Macon, GA | 3.0 | 1.0 | 1175 | $1,050 | $0.89 | 43d | 1 | 1.10mi |
| 534 Lynmore Ave Macon, GA | 2.0 | 1.0 | 864 | $925 | $1.07 | 43d | 1 | 1.14mi |
| 3423 Flamingo Dr Macon, GA | 3.0 | 1.0 | 1048 | $895 | $0.85 | 43d | 1 | 1.15mi |
| 3080 Rice Mill Rd Macon, GA | 3.0 | 1.0 | 1100 | $950 | $0.86 | 43d | 1 | 1.22mi |
| 3080 Rice Mill Rd Unit C-1 Macon, GA | 3.0 | 1.5 | 1100 | $925 | $0.84 | 21d | 1 | 1.22mi |
| 1089 Brisbane St Macon, GA | 3.0 | 1.0 | 816 | $1,075 | $1.32 | 13d | 1 | 1.30mi |
Listing history 26 events
-
2026-06-19days on market $38,000 Active 54 DOM
-
2026-06-18days on market $38,000 Active 53 DOM
-
2026-06-17days on market $38,000 Active 52 DOM
-
2026-06-16days on market $38,000 Active 51 DOM
-
2026-06-15days on market $38,000 Active 50 DOM
-
2026-06-14days on market $38,000 Active 48 DOM
-
2026-06-13days on market $38,000 Active 47 DOM
-
2026-06-10days on market $38,000 Active 45 DOM
-
2026-06-09days on market $38,000 Active 44 DOM
-
2026-06-09days on market $38,000 Active 43 DOM
-
2026-06-07days on market $38,000 Active 42 DOM
-
2026-06-03days on market $38,000 Active 38 DOM
-
2026-06-02days on market $38,000 Active 37 DOM
-
2026-06-01days on market $38,000 Active 36 DOM
-
2026-05-31days on market $38,000 Active 35 DOM
-
2026-05-30days on market $38,000 Active 34 DOM
-
2026-04-28$38,000 Active 223-char remark
Show marketing remark (223 chars)
NOTICE TO RESIDENTIAL INVESTORS! Are you looking for a FIXER-UPPER? You have found it! New on the market, three bedrooms located in an established neighborhood. Quick and easy access to I-75, shopping, schools and eateries.
-
2026-04-25$38,000 New 227-char remark
-
2025-06-24soldstatus $26,000 Sold
-
2025-06-24soldstatus $26,000 Closed
-
2025-06-24soldstatus $26,000
-
2025-02-19status Active
-
2025-02-13historical Active Under Contract
-
2025-01-30$26,000 New
-
2025-01-30$26,000 Active
-
2025-01-30$26,000
ⓘ Source: listings_history table (triggers on properties + properties_extension) + one-shot
backfill from property_details.listing_events for pre-trigger history.
Tax reassessment forecast GA · Resets to sale price
- Current annual tax
- $1,373 · $114/mo
- Projected year-2 tax
- $1,373 · $114/mo
- Expected delta
- $0/yr ($0/mo · 0.0%)
ⓘ Screening estimate from a state-policy table — verify with the county assessor before closing.
Climate risk First Street
- Flood 1/10 Low FEMA zone X (unshaded) · 0% chance over 30 yrs
- Wildfire 2/10 Low
- Heat 7/10 Severe 7 d/yr ≥109°F today · 18 d/yr by 30 yrs out
- Wind 6/10 Major 66% chance of damaging wind over 30 yrs
- Air quality 3/10 Moderate 3 unhealthy d/yr today · 4 by 30 yrs out
Nearby sold comps map
Loading sold comps map…
Walkable amenities ~0.75 mi
Loading nearby amenities…
Taxation est. · year 1
- Rental income
- $13,073
- − Mortgage interest
- −$2,129
- − Property taxes
- −$1,373
- − Insurance
- −$190
- − Repairs & maintenance
- −$1,046
- − Management
- −$1,046
- − Depreciation
- −$1,105
- Taxable income
- $6,185
- Est. tax owed @ 24.0%
- −$1,484
- After-tax cash flow
- $4,889/yr
For passive investors: Depreciation is non-cash, so a rental often shows a tax loss while cash-flowing — sheltering income. Rental losses are passive: they offset passive income freely, and up to $25,000/yr can offset ordinary (W-2) income if you actively participate and your MAGI is under $100k (phasing out to $0 by $150k); unused losses carry forward. On sale, claimed depreciation is recaptured at up to 25%, and gains may owe capital-gains tax (a 1031 exchange can defer both). Figures are a year-1 estimate at your 24.0% rate — not tax advice; consult a CPA.
Schools (NCES district)
- District
- Bibb County
- NCES district ID
- 1300420
- Math proficiency
- 11% ▼ -14.00%
- Reading proficiency
- 18% ▼ -11.00%
- Median HH income
- $37,426
- Composite
- 12.13/100
- National rank
- #9654
- State rank
- #161 of 174 in GA
Livability — Macon-Bibb County
No livability data for this city. (Only ~50 U.S. cities are tracked.)
Census & demographics
- Census place
- Macon-Bibb County, GA
- County
- Bibb County · 164,332 people
- City population
- 143,186
- Metro
- Macon-Bibb County, GA
- Population (ZIP)
- 24,310
- Household income
- $30,042
- Rent vs Own
- Severe rent burden
- 1335.0
Population outlook (Bibb County) Hauer SSP2
- Today (2025)
- 148,772 people
- By 2030
- 145,904 · -1.9%
- By 2040
- 139,404 · -6.3%
- By 2050
- 131,603 · -11.5%
- By 2075
- 111,050 · -25.4%
- By 2100
- 83,346 · -44.0%
Race, ethnicity, and origin ACS 2023
- Neighborhood character
- Predominantly Black (76%)
- Race & ethnicity
- Black 76% White 12% Hispanic / Latino 8% Two or more races 4%
- Hispanic origin (detail)
- Mexican 5% Puerto Rican 1%
- Common ancestry
- Lithuanian 1% Italian 1%
- Foreign-born
- 4% · Canada
- Languages at home
- 91% English-only · Spanish 8%
Political lean MEDSL · Bibb
- 2024 margin
- Strong D (+22.4) · D 61.0% · R 38.5%
- 2008→2024 swing
- +4.4pp toward D · 2008: 18.0pp · 2024: 22.4pp
- All cycles
- 2024: D+22.4 2020: D+23.8 2016: D+20.2 2012: D+20.0 2008: D+18.0
Not yet ingested
- Civics
- —
Market trends
- HPI YoY
- ▼ -80.17%
- Current HPI
- 148.6765
- Rent YoY
- ▲ 5.03%
- Metro
- Macon-Bibb County, GA
- State GDP YoY
- ▲ 2.66%
- F500 in state
- 28
Industry mix (Fortune 500 HQ in GA)
| Industry | F500 HQs | Revenue |
|---|---|---|
| Paper / Packaging | 2 | $29B |
|
||
| Retail | 1 | $160B |
|
||
| Transportation / Logistics | 1 | $91B |
|
||
| Airlines | 1 | $62B |
|
||
| Consumer Goods | 1 | $47B |
|
||
| Utilities | 1 | $25B |
|
||
Price history
+46.2% since first listed11 events — show timeline
- 2026-04-28 Listed $38,000 CGMLS
- 2026-04-28 Listed $38,000 MGMLS
- 2026-04-25 Listed $38,000 GAMLS
- 2025-06-24 Sold (MLS) $26,000 CGMLS
- 2025-06-24 Sold (MLS) $26,000 MGMLS
- 2025-06-24 Sold (MLS) $26,000 GAMLS
- 2025-02-19 Relisted — MGMLS
- 2025-02-13 Contingent — MGMLS
- 2025-01-30 Listed $26,000 CGMLS
- 2025-01-30 Listed $26,000 MGMLS
- 2025-01-30 Listed $26,000 GAMLS
Property tax history
+29.9%/yrLatest (2025): $1,373 · +0.8% YoY. Source: county tax records.
Cash-flow waterfall
monthlySold comps — $/sqft
last 12 mo · ≤1 miLoading sold comps…