310 N Minier Ave · Minier, IL
Flood risk 1/10 · Minimal
- FEMA flood zone
- X (unshaded)
- Chance of flooding over 30 yrs
- 0.0%
- Est. flood insurance / yr
- $507 – $1,088
Fire risk 1/10 · Minimal
- Est. fire insurance / yr
- $804 – $1,492
Heat risk 3/10 · Minor
- Hot days now (above 106°F)
- 7 days/yr
- Hot days in 30 yrs
- 18 days/yr
Wind risk 2/10 · Minimal
- Chance of severe wind over 30 yrs
- 1.0%
Air-quality risk 2/10 · Minimal
- Unhealthy air days now
- 1 days/yr
- Unhealthy air days in 30 yrs
- 2 days/yr
Risk factors via First Street. Map © Google.
Why this score? — see what drove the C+ grade
The composite is a weighted blend of 9 inputs, each scored 0–100. Each bar is that input's sub-score; the figure is the points it added to the 100-point composite (weight × sub-score).
- Cash flow +27.0/30.0
- DSCR +9.4/10.0
- 1% rule +8.7/10.0
- ARV discount +7.5/15.0
- Livability +3.2/5.0
- Schools +2.7/10.0
- Rent growth +2.5/5.0
- Condition / age +2.5/5.0
- Appreciation +0.0/10.0
$84,900
🖨 Deal sheet 📄 Offer letter ✓ Due diligence
Listing remarks
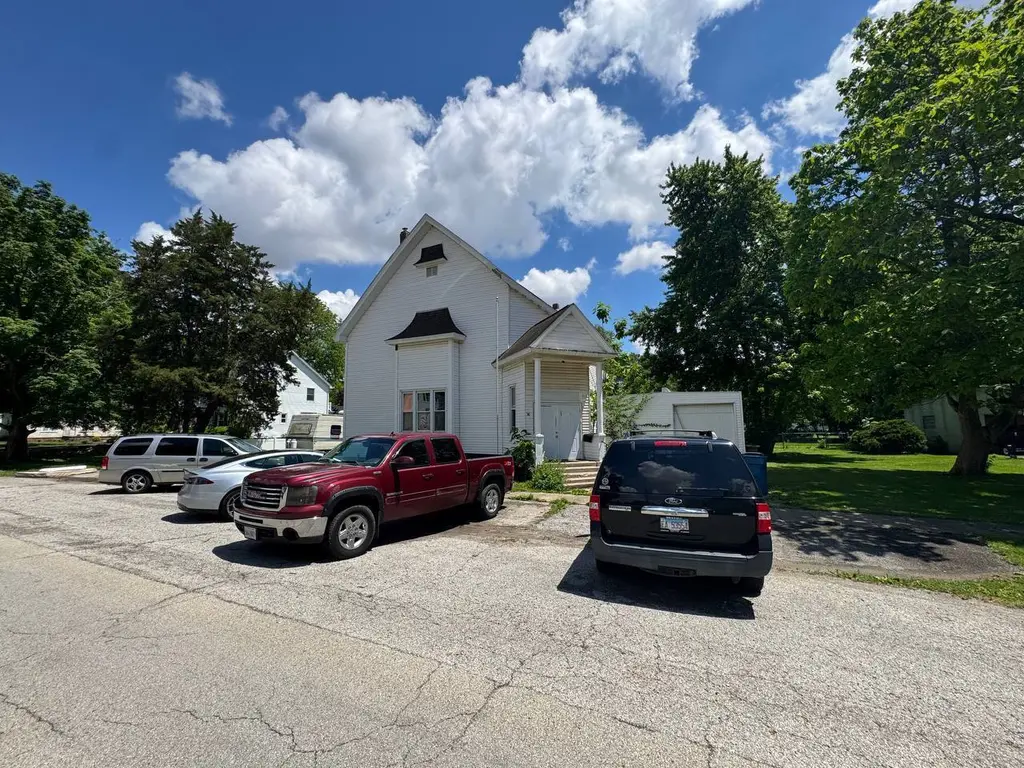
A truly rare 3bed/ 1bath with a standout feature of a loft space in the heart of Minier! 310 N Minier Ave is a former church thoughtfully customized into a home filled with character, history, and incredible potential. From the moment you walk in, the stunning woodwork, soaring ceilings, and oversized great room create a feeling unlike any traditional property. This is the kind of property that inspires vision. Whether you are an investor, creative buyer, or someone looking to transform a unique space into something extraordinary, the possibilities here are endless. The home does need work, but for the right buyer, this could become an absolute showpiece. Properties with this much persona
Key facts
- Former church
- Woodwork
- Soaring ceilings
Tags
Property features AI
Finance
- HOA & community: No master association fee required
Exterior
- Parking: Detached garage (2 parking spaces total)
- Utilities: Public water; Public sewer
- Home design: Detached single-family home; 1.5-story residence; Estimated living area; total finished space approximately 2,264 sq ft; Fee simple ownership; Property age over 100 years; Built before 1978
- Construction: Vinyl siding; Total finished/unfinshed area about 2,614 sq ft; Parcel number 191922207002
- Exterior features: Lot dimensions approximately 100 x 142; Lot size less than 0.25 acre
Interior
- Kitchen: Kitchen with eating area/table space (14 x 8)
- Bedrooms: Three bedrooms total; Master bedroom located on the second floor (12 x 25); Second bedroom on the main level (10 x 16); Third bedroom on the second level (10 x 14)
- Flooring: Hardwood flooring in living room, dining room, and master bedroom; Carpet in one bedroom; Ceramic tile in kitchen and one additional room
- Bathrooms: One full bathroom
- Heating & cooling: Forced air heating (natural gas); Central air conditioning
- Interior features: Six total rooms; Basement: full and crawl space
- Laundry & utility: Laundry room
Neighborhood map
What this means for you Summary
Snapshot
- This is a 3-bed/2.0-bath single-family listed at $85k.
Deal economics
- At list price, monthly cash flow is $239 ($3k/yr) — positive.
- The deal already cash-flows at list — no discount required.
- Meets the 1% rule at list price ($1k rent vs $85k).
Location & tenants
- Location reads 64/100 on livability (#663 in IL) — a middle-class / working-renter tenant base. Strengths: cost of living A+, housing A+, crime B; Watch: amenities F, commute F, health & safety F.
- Olympia CUSD 16 (rural): math 29% / reading 30% proficiency, ranked #237 of 620 in IL (top 38%) — low school quality limits family demand, transient renter base, plan for 1-2y turnover.
- Zoned schools: Olympia South Elem Sch (math 22% / reading 37%, grade F, #658 of 2,056 statewide, top 35%, 327 students, 0% FRL); Olympia High School (math 32% / reading 32%, grade F, #157 of 693 statewide, top 25%, 503 students, 0% FRL) — zoned schools average 0% FRL vs 30% district-wide (30 pts lower); this property's tenant base skews higher-income than the district average.
- Market conditions: 8 active listings in the ZIP; 77 units permitted in Tazewell County in 2024 (0 in 5+ unit buildings).
Forward outlook
- Local home prices are declining (-3.0%/yr); year-one equity from $587 of loan paydown is wiped out by about $3k of value loss. Plan a longer hold.
- Tazewell County population projected at -15% by 2050 — secular population decline; favor cash flow + early exit over multi-decade hold.
- At projected returns (-3.0% appreciation + 3.0% rent growth), your $24k cash investment doubles in ~10 years — after that, you're playing with house money.
Negotiation context
- Only 14 days on market — expect competitive offers; lowballing is unlikely to land.
Risks & watch-outs
- Watch-outs: property tax is 2.8% of price; built in 1860 — expect roof / HVAC / electrical / plumbing capex.
Questions for the listing agent
- Built in 1860 — when were the roof, HVAC, electrical panel, plumbing, and water heater last replaced?
- Property tax is high relative to price — has the assessment been appealed recently, and will the sale trigger a re-assessment?
- Is there a deadline driving the sale (1031 exchange, divorce, estate, relocation)? That informs how much negotiation room exists.
- Schools are D-rated, which usually means shorter tenancies and higher turnover. Who's the typical renter profile here, and what's been the actual vacancy rate?
- What's the average days-on-market for RENTAL listings here right now (not sales)? A rising rental-DOM trend means longer vacancies and softer asking-rent achievability than the comps imply.
- What's the recent tenant-quality profile in this submarket — average credit score on applications, eviction rate, late-payment / NSF rate, and stable-employment percentage? A property-management company in the area should have these aggregated.
- How much new for-sale + rental construction is in the pipeline within 1–3 miles? Heavy new supply typically softens prices + rents 12–24 months out; constrained supply supports both.
Investment metrics
- 1% rule
- 1.37% ✓
- Cap rate
- 9.67%
- Cash-on-cash
- 12.05%
- DSCR
- 1.54
- GRM
- 6.1
CMA / ARV
- ARV (on-the-fly)
- $221,872
- Comps found
- 6
Show comp detail 6 sales within ~0.75 mi
| Address | Dist | Beds/Ba | Sqft | Sold | Price | $/sf | Match |
|---|---|---|---|---|---|---|---|
| 214 N Maple Ave | 0.10mi | 3/2.0 | 2,305 (+2%) | 1mo | $200,000 | $87 | 92 |
| 302 N Minier Ave | 0.02mi | 4/2.0 (+1) | 1,964 (-13%) | 2mo | $255,000 | $130 | 70 |
| 314 S Maple Ave | 0.42mi | 4/2.0 (+1) | 2,232 (-1%) | 7mo | $196,000 | $88 | 67 |
| 309 N Pennsylvania Ave | 0.17mi | 3/3.0 | 2,480 (+10%) | 11mo | $228,000 | $92 | 63 |
| 221 S Darnall Dr | 0.60mi | 3/2.5 | 2,308 (+2%) | 15mo | $229,000 | $99 | 55 |
| 505 S School St | 0.60mi | 3/2.0 | 1,944 (-14%) | 22mo | $189,900 | $98 | 30 |
Match score weights: distance 35% · size 25% · config 20% · recency 20%. Top-matched comps best support the ARV.
Projected returns pro-forma
-3.0% appreciation · 3.0% rent growth · sell at horizon
- IRR
- 1.7%
- Equity multiple
- 1.06×
- Total profit
- $1,524
- Equity at exit
- $12,659
- IRR
- 11.3%
- Equity multiple
- 1.89×
- Total profit
- $21,208
- Equity at exit
- $7,341
Cash invested: $23,772 (down + closing). Projections, not guarantees.
Landlord ↔ Tenant lean methodology
- Overall (STATE)
- 43 Moderately Tenant-Leaning
- State Illinois
- 43 Moderately Tenant-Leaning · D+7
- County
- — inherits STATE
- City
- — inherits STATE
ZIP-level market 61759
- Home prices YoY
- -28.1%
- Active inventory
- 8
- Price-to-rent
- 6.1×
Monthly cashflow live
- Estimated rent
- $1,161 medium interval (Pro) →
- Mortgage (P&I)
- −$445
- Tax from tax record
- −$198 /mo · $2,370/yr
- Insurance
- −$35
- HOA
- −$0
- Vacancy / Maint / Mgmt
- −$244
- Net cashflow
- $239
Break-even live
UW: 25.0% down · 7.5% · 30yr · 1.5% tax · 5.0% vac · 8.0% maint · 8.0% mgmt
Financing live
Cash to close
- Down payment
- $21,225
- Closing costs
- $2,547
- Reserves months
- —
- Total cash needed
- —
Loan-product check · same deal, 3 products live
Conventional
25% down · 7.5% · 30yr
- Down + closing
- —
- Monthly P&I
- —
- Monthly cashflow
- —
- DSCR
- —
- Eligible?
- —
Personal DTI + credit; lowest rate.
DSCR
20% down · 8.5% · 30yr
- Down + closing
- —
- Monthly P&I
- —
- Monthly cashflow
- —
- DSCR
- —
- Eligible?
- —
No personal income docs; deal must DSCR.
Hard money
10% down · 12.0% · 12mo
- Down + closing
- —
- Monthly P&I
- —
- Monthly cashflow
- —
- DSCR
- —
- Eligible?
- —
Short-term bridge; refi at stabilization.
Listing history 12 events
-
2026-06-18days on market $84,900 Active 14 DOM
-
2026-06-17price $84,900 Active 13 DOM
-
2026-06-17days on market $99,900 Active 13 DOM
-
2026-06-16days on market $99,900 Active 12 DOM
-
2026-06-15days on market $99,900 Active 11 DOM
-
2026-06-13days on market $99,900 Active 9 DOM
-
2026-06-12days on market $99,900 Active 8 DOM
-
2026-06-09days on market $99,900 Active 5 DOM
-
2026-06-08days on market $99,900 Active 4 DOM
-
2026-06-07days on market $99,900 Active 3 DOM
-
2026-06-05remarks 699-char remark
-
2026-06-05$99,900 Active 1 DOM
ⓘ Source: listings_history table (triggers on properties + properties_extension) + one-shot
backfill from property_details.listing_events for pre-trigger history.
Tax reassessment forecast IL · Partial reset (capped growth)
- Current annual tax
- $2,370 · $198/mo
- Projected year-2 tax
- $2,370 · $198/mo
- Expected delta
- $0/yr ($0/mo · 0.0%)
ⓘ Screening estimate from a state-policy table — verify with the county assessor before closing.
Climate risk First Street
- Flood 1/10 Low FEMA zone X (unshaded) · 0% chance over 30 yrs
- Wildfire 1/10 Low
- Heat 3/10 Moderate 7 d/yr ≥106°F today · 18 d/yr by 30 yrs out
- Wind 2/10 Low 100% chance of damaging wind over 30 yrs
- Air quality 2/10 Low 1 unhealthy d/yr today · 2 by 30 yrs out
Nearby sold comps map
Loading sold comps map…
Walkable amenities ~0.75 mi
Loading nearby amenities…
Taxation est. · year 1
- Rental income
- $13,927
- − Mortgage interest
- −$4,756
- − Property taxes
- −$2,370
- − Insurance
- −$424
- − Repairs & maintenance
- −$1,114
- − Management
- −$1,114
- − Depreciation
- −$2,470
- Taxable income
- $1,679
- Est. tax owed @ 24.0%
- −$403
- After-tax cash flow
- $2,462/yr
For passive investors: Depreciation is non-cash, so a rental often shows a tax loss while cash-flowing — sheltering income. Rental losses are passive: they offset passive income freely, and up to $25,000/yr can offset ordinary (W-2) income if you actively participate and your MAGI is under $100k (phasing out to $0 by $150k); unused losses carry forward. On sale, claimed depreciation is recaptured at up to 25%, and gains may owe capital-gains tax (a 1031 exchange can defer both). Figures are a year-1 estimate at your 24.0% rate — not tax advice; consult a CPA.
Schools (NCES district)
- District
- Olympia CUSD 16
- NCES district ID
- 1729890
- Math proficiency
- 29% ▼ -4.00%
- Reading proficiency
- 30% ▼ -4.00%
- Median HH income
- $62,002
- Composite
- 26.94/100
- National rank
- #7081
- State rank
- #237 of 620 in IL
Livability — Minier
- Score
- 64/100
- State rank
- #663
- US rank
- #13613
Category grades
Schools grade is shown separately in the Schools card above.
Census & demographics
- Census place
- Minier, IL
- Population (ZIP)
- 1,263
Population outlook (Tazewell County) Hauer SSP2
- Today (2025)
- 131,252 people
- By 2030
- 128,028 · -2.5%
- By 2040
- 120,443 · -8.2%
- By 2050
- 111,872 · -14.8%
- By 2075
- 89,843 · -31.5%
- By 2100
- 66,468 · -49.4%
Race, ethnicity, and origin ACS 2023
- Neighborhood character
- Predominantly White (94%)
- Race & ethnicity
- White 94% Two or more races 4% Hispanic / Latino 1%
- Common ancestry
- Italian 4% Slovak 2% Lithuanian 2%
Political lean MEDSL · Tazewell
- 2024 margin
- Strong R (+26.7) · D 35.8% · R 62.5% · Other 1.8%
- 2008→2024 swing
- -20.6pp toward R · 2008: -6.0pp · 2024: -26.7pp
- All cycles
- 2024: R+26.7 2020: R+25.6 2016: R+28.5 2012: R+17.9 2008: R+6.0
Not yet ingested
- Civics
- —
Market trends
- HPI YoY
- ▼ -61.69%
- Current HPI
- 158.2252
- Rent YoY
- —
- Metro
- —
- State GDP YoY
- ▲ 1.59%
- F500 in state
- 60
Industry mix (Fortune 500 HQ in IL)
| Industry | F500 HQs | Revenue |
|---|---|---|
| Insurance | 4 | $201B |
|
||
| Consumer Goods | 4 | $87B |
|
||
| Industrial Machinery | 3 | $64B |
|
||
| Healthcare | 2 | $55B |
|
||
| Retail / Pharmacy | 1 | $148B |
|
||
| Agriculture / Food | 1 | $86B |
|
||
Price history
-81.0% since first listed3 events — show timeline
- 2026-06-04 Listed $99,900 MRED as Distributed by MLS Grid
- 2021-11-18 Sold (Public Records) $525,000 Public Records
- 2021-08-06 Listing Removed — RMLSA as Distributed by MLS Grid
Property tax history
+4.8%/yrLatest (2024): $2,370 · +11.6% YoY. Source: county tax records.
Cash-flow waterfall
monthlySold comps — $/sqft
last 12 mo · ≤1 miLoading sold comps…