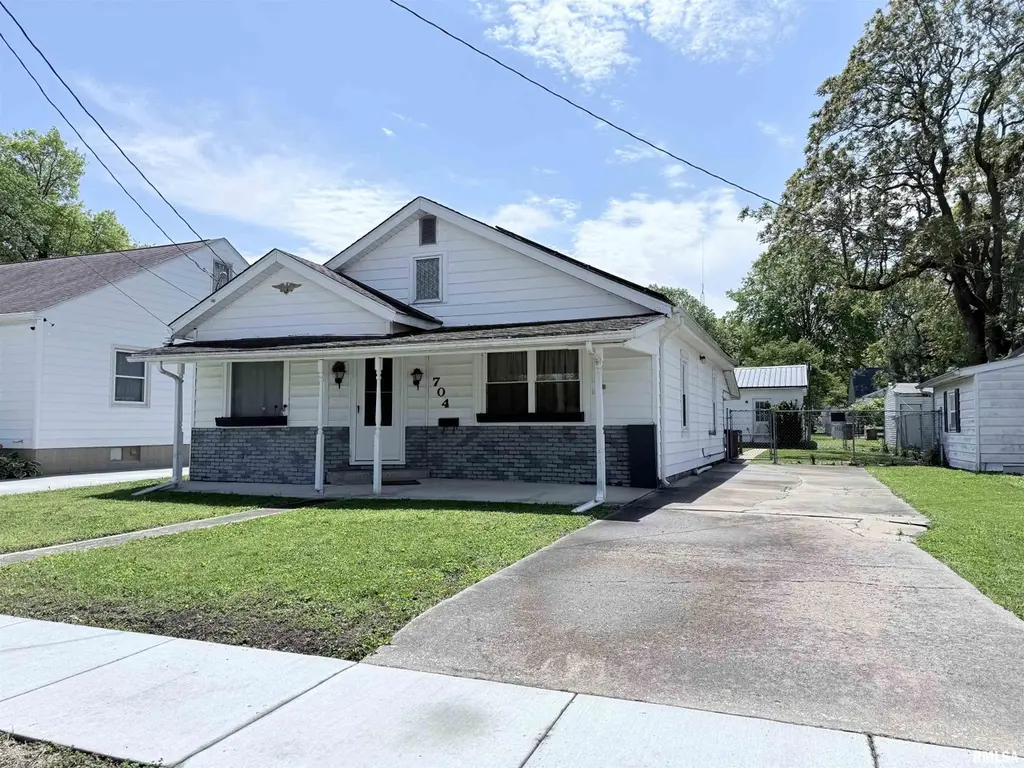
704 E Elm St · Taylorville, IL
Flood risk 1/10 · Minimal
- FEMA flood zone
- X (unshaded)
- Chance of flooding over 30 yrs
- 0.0%
- Est. flood insurance / yr
- $473 – $860
Fire risk 1/10 · Minimal
- Est. fire insurance / yr
- $804 – $1,492
Heat risk 4/10 · Minor
- Hot days now (above 105°F)
- 7 days/yr
- Hot days in 30 yrs
- 20 days/yr
Wind risk 2/10 · Minimal
- Chance of severe wind over 30 yrs
- 2.0%
Air-quality risk 2/10 · Minimal
- Unhealthy air days now
- 1 days/yr
- Unhealthy air days in 30 yrs
- 2 days/yr
Risk factors via First Street. Map © Google.
Why this score? — see what drove the D+ grade
The composite is a weighted blend of 9 inputs, each scored 0–100. Each bar is that input's sub-score; the figure is the points it added to the 100-point composite (weight × sub-score).
- Cash flow +15.8/30.0
- ARV discount +12.3/15.0
- 1% rule +5.3/10.0
- DSCR +4.9/10.0
- Livability +3.4/5.0
- Rent growth +2.5/5.0
- Condition / age +2.5/5.0
- Schools +2.0/10.0
- Appreciation +0.0/10.0
$79,900
🖨 Deal sheet (PDF) 📄 Offer letter ✓ Due diligence
Listing remarks
Welcome to 704 E. Elm Street, Taylorville — a beautifully equipped, cute and cozy 2-bedroom, 2-bathroom home that perfectly blends classic comfort with modern efficiency. From the moment you arrive, you’ll appreciate the incredible value and unique features this property has to offer. Interior Features Spacious Living Room: A welcoming and bright living space perfect for relaxing or entertaining guests. Main Floor Laundry: No trips to the laundromat or basement — the washer and dryer are included in the sale. Generous Master Suite: The large master bedroom serves as a true retreat, complete with its own private en-suite bathroom. Full Guest Bath: A second full bathroom ens
Key facts
- Wood back deck
- Main floor laundry
- Fenced in yard
Tags
Property features AI
Exterior
- Parking: Detached paved garage with space for 3 vehicles
- Utilities: Public water; Public sewer
- Home design: Single-family residence; Built in 1950
- Construction: Partial basement
- Exterior features: Level lot; Shingle roof
Interior
- Kitchen: Refrigerator
- Bedrooms: 2 bedrooms (both on the main level)
- Flooring: Laminate flooring throughout main living areas and bedrooms
- Bathrooms: 2 full bathrooms
- Heating & cooling: Forced air heating; Central air conditioning
- Interior features: Partial basement; Egress windows in bedrooms; No fireplaces
- Laundry & utility: Washer; Dryer
Neighborhood map
What this means for you Summary
Snapshot
- This is a 2-bed/3.0-bath single-family listed at $80k.
Deal economics
- At list price, monthly cash flow is $37 ($446/yr) — positive.
- The deal already cash-flows at list — no discount required.
- Meets the 1% rule at list price ($820 rent vs $80k).
- Recommended offer: $79k (1.5% below list) — sets the bar for market timing.
- Cap rate 6.9% vs local median 4.1% in Taylorville — top-decile yield for the area; either an underpriced asset or a hidden risk that comps aren't pricing in. Stress-test before assuming the spread holds.
Location & tenants
- Location reads 68/100 on livability (#478 in IL) — a middle-class / working-renter tenant base. Strengths: cost of living A+, housing A+, crime B+; Watch: employment D, amenities F, commute F.
- Taylorville CUSD 3 (town): math 14% / reading 31% proficiency, ranked #383 of 620 in IL (top 62%) — low school quality limits family demand, transient renter base, plan for 1-2y turnover.
- Zoned schools: North Elem School (537 students, 0% FRL); Taylorville Jr High School (math 14% / reading 42%, grade F, #284 of 665 statewide, top 44%, 683 students, 0% FRL); Taylorville Sr High School (math 12% / reading 17%, grade F, #479 of 693 statewide, top 71%, 781 students, 0% FRL) — zoned schools average 0% FRL vs 46% district-wide (46 pts lower); this property's tenant base skews higher-income than the district average.
- Market conditions: 87 active listings in the ZIP; 1 comparable units currently listed for rent nearby; 26 units permitted in Christian County in 2024 (0 in 5+ unit buildings).
Forward outlook
- Local home prices are declining (-3.0%/yr); year-one equity from $552 of loan paydown is wiped out by about $2k of value loss. Plan a longer hold.
- Christian County population projected at -24% by 2050 — secular population decline; favor cash flow + early exit over multi-decade hold.
Negotiation context
- It's been on market 24 days — a 2% lower offer ($79k) is reasonable based on typical stale-listing flexibility.
- 3 sale attempts since 17y ago with the ask held roughly flat each time — persistent listings suggest the price (not the market) is what's stuck; bring a comps-based counter.
Risks & watch-outs
- Watch-outs: built in 1950 — expect roof / HVAC / electrical / plumbing capex.
Questions for the listing agent
- Built in 1950 — when were the roof, HVAC, electrical panel, plumbing, and water heater last replaced?
- Is there a deadline driving the sale (1031 exchange, divorce, estate, relocation)? That informs how much negotiation room exists.
- Schools are F-rated, which usually means shorter tenancies and higher turnover. Who's the typical renter profile here, and what's been the actual vacancy rate?
- The area grade is low — what's the realistic commute time and amenity access for the typical tenant pool here? Any planned neighborhood developments (good or bad) we should know about?
- What's the average days-on-market for RENTAL listings here right now (not sales)? A rising rental-DOM trend means longer vacancies and softer asking-rent achievability than the comps imply.
- What's the recent tenant-quality profile in this submarket — average credit score on applications, eviction rate, late-payment / NSF rate, and stable-employment percentage? A property-management company in the area should have these aggregated.
- How much new for-sale + rental construction is in the pipeline within 1–3 miles? Heavy new supply typically softens prices + rents 12–24 months out; constrained supply supports both.
Investment metrics
- 1% rule
- 1.03% ✓
- Cap rate
- 6.85%
- Cash-on-cash
- 1.99%
- DSCR
- 1.09
- GRM
- 8.1
CMA / ARV
- ARV (on-the-fly)
- $89,424
- Comps found
- 12
Show comp detail 12 sales within ~0.75 mi
| Address | Dist | Beds/Ba | Sqft | Sold | Price | $/sf | Match |
|---|---|---|---|---|---|---|---|
| 902 E Oak St | 0.14mi | 2/1.5 | 1,008 (+4%) | 1mo | $65,000 | $64 | 80 |
| 816 E Stevenson St | 0.21mi | 3/1.0 (+1) | 952 (-2%) | 2mo | $130,000 | $137 | 72 |
| 709 E Heights Ave | 0.47mi | 3/1.5 (+1) | 960 (-1%) | 6mo | $140,000 | $146 | 60 |
| 402 E Adams St | 0.62mi | 2/1.0 | 933 (-4%) | 3mo | $86,000 | $92 | 54 |
| 708 E Franklin St | 0.53mi | 2/1.0 | 912 (-6%) | 5mo | $19,000 | $21 | 52 |
| 704 Hawley Ave | 0.66mi | 2/1.0 | 998 (+3%) | 7mo | $65,000 | $65 | 51 |
| 516 N Pawnee St | 0.26mi | 3/1.5 (+1) | 1,106 (+14%) | 7mo | $117,500 | $106 | 48 |
| 1221 E Park | 0.38mi | 2/1.0 | 850 (-13%) | 7mo | $6,900 | $8 | 47 |
| 314 N Clay St | 0.61mi | 2/1.0 | 1,056 (+9%) | 2mo | $122,000 | $116 | 47 |
| 318 Springfield Rd | 0.62mi | 2/2.0 | 1,097 (+13%) | 1mo | $129,900 | $118 | 44 |
| 408 S Cherokee St | 0.64mi | 2/1.0 | 870 (-10%) | 1mo | $55,000 | $63 | 44 |
| 1010 E Adams St | 0.65mi | 1/1.0 (-1) | 924 (-5%) | 7mo | $6,000 | $6 | 43 |
Match score weights: distance 35% · size 25% · config 20% · recency 20%. Top-matched comps best support the ARV.
Projected returns pro-forma
-3.0% appreciation · 3.0% rent growth · sell at horizon
- IRR
- -13.1%
- Equity multiple
- 0.53×
- Total profit
- $-10,532
- Equity at exit
- $11,913
- IRR
- -4.0%
- Equity multiple
- 0.74×
- Total profit
- $-5,928
- Equity at exit
- $6,908
Cash invested: $22,372 (down + closing). Projections, not guarantees.
Landlord ↔ Tenant lean methodology
- Overall (STATE)
- 43 Moderately Tenant-Leaning
- State Illinois
- 43 Moderately Tenant-Leaning · D+7
- County
- — inherits STATE
- City
- — inherits STATE
ZIP-level market 62568
- Active inventory
- 87
- Price-to-rent
- 8.1×
Monthly cashflow live
- Estimated rent
- $820 medium interval (Pro) →
- Mortgage (P&I)
- −$419
- Tax from tax record
- −$158 /mo · $1,900/yr
- Insurance
- −$33
- HOA
- −$0
- Vacancy / Maint / Mgmt
- −$172
- Net cashflow
- $37
Break-even live
Sensitivity live
| Price | -10% $82 | -5% $60 | +0% $37 | +5% $15 | +10% $-8 |
|---|---|---|---|---|---|
| Rent | -10% $-28 | -5% $5 | +0% $37 | +5% $70 | +10% $102 |
| Rate | -1.0pp $77 | -0.5pp $57 | base $37 | +0.5pp $16 | +1.0pp $-5 |
UW: 25.0% down · 7.5% · 30yr · 1.5% tax · 5.0% vac · 8.0% maint · 8.0% mgmt
Financing live
Cash to close
- Down payment
- $19,975
- Closing costs
- $2,397
- Reserves months
- —
- Total cash needed
- —
Loan-product check · same deal, 3 products live
Conventional
25% down · 7.5% · 30yr
- Down + closing
- —
- Monthly P&I
- —
- Monthly cashflow
- —
- DSCR
- —
- Eligible?
- —
Personal DTI + credit; lowest rate.
DSCR
20% down · 8.5% · 30yr
- Down + closing
- —
- Monthly P&I
- —
- Monthly cashflow
- —
- DSCR
- —
- Eligible?
- —
No personal income docs; deal must DSCR.
Hard money
10% down · 12.0% · 12mo
- Down + closing
- —
- Monthly P&I
- —
- Monthly cashflow
- —
- DSCR
- —
- Eligible?
- —
Short-term bridge; refi at stabilization.
Rent comps 1 comps
| Address | Beds | Baths | Sqft | Rent | $/sqft | DOM | Units | Dist |
|---|---|---|---|---|---|---|---|---|
| 913 N Taylorville Blvd Taylorville, IL | 2.0 | 2.0 | 896 | $820 | $0.92 | 23d | 1 | 1.17mi |
Listing history 29 events
-
2026-06-21days on market $79,900 Active 24 DOM
-
2026-06-21days on market $79,900 Active 23 DOM
-
2026-06-18days on market $79,900 Active 21 DOM
-
2026-06-17days on market $79,900 Active 20 DOM
-
2026-06-16days on market $79,900 Active 19 DOM
-
2026-06-15days on market $79,900 Active 18 DOM
-
2026-06-13days on market $79,900 Active 16 DOM
-
2026-06-12days on market $79,900 Active 15 DOM
-
2026-06-09days on market $79,900 Active 12 DOM
-
2026-06-08days on market $79,900 Active 11 DOM
-
2026-06-07days on market $79,900 Active 10 DOM
-
2026-06-07days on market $79,900 Active 9 DOM
-
2026-06-04days on market $79,900 Active 6 DOM
-
2026-06-02days on market $79,900 Active 5 DOM
-
2026-06-01days on market $79,900 Active 4 DOM
-
2026-05-31days on market $79,900 Active 3 DOM
-
2026-05-31days on market $79,900 Active 2 DOM
-
2026-05-27$79,900 Active
-
2021-08-06historical
-
2021-08-06historical
-
2021-04-15soldstatus $73,500
-
2021-04-14soldstatus $73,500
-
2021-02-05$74,900
-
2019-01-23historical
-
2016-03-08historical
-
2009-11-10soldstatus $51,000
-
2009-11-09soldstatus $51,000
-
2009-07-13$54,900
-
2004-12-23soldstatus $27,810
ⓘ Source: listings_history table (triggers on properties + properties_extension) + one-shot
backfill from property_details.listing_events for pre-trigger history.
Tax reassessment forecast IL · Partial reset (capped growth)
- Current annual tax
- $1,900 · $158/mo
- Projected year-2 tax
- $1,900 · $158/mo
- Expected delta
- $0/yr ($0/mo · 0.0%)
ⓘ Screening estimate from a state-policy table — verify with the county assessor before closing.
Climate risk First Street
- Flood 1/10 Low FEMA zone X (unshaded) · 0% chance over 30 yrs
- Wildfire 1/10 Low
- Heat 4/10 Moderate 7 d/yr ≥105°F today · 20 d/yr by 30 yrs out
- Wind 2/10 Low 2% chance of damaging wind over 30 yrs
- Air quality 2/10 Low 1 unhealthy d/yr today · 2 by 30 yrs out
Nearby sold comps map
Loading sold comps map…
Walkable amenities ~0.75 mi
Loading nearby amenities…
Taxation est. · year 1
- Rental income
- $9,840
- − Mortgage interest
- −$4,476
- − Property taxes
- −$1,900
- − Insurance
- −$400
- − Repairs & maintenance
- −$787
- − Management
- −$787
- − Depreciation
- −$2,324
- Taxable loss
- −$834
- Est. tax savings @ 24.0%
- +$200
- After-tax cash flow
- $646/yr
For passive investors: Depreciation is non-cash, so a rental often shows a tax loss while cash-flowing — sheltering income. Rental losses are passive: they offset passive income freely, and up to $25,000/yr can offset ordinary (W-2) income if you actively participate and your MAGI is under $100k (phasing out to $0 by $150k); unused losses carry forward. On sale, claimed depreciation is recaptured at up to 25%, and gains may owe capital-gains tax (a 1031 exchange can defer both). Figures are a year-1 estimate at your 24.0% rate — not tax advice; consult a CPA.
Schools (NCES district)
- District
- Taylorville CUSD 3
- NCES district ID
- 1738700
- Math proficiency
- 14% ▼ -17.00%
- Reading proficiency
- 31% ▼ -10.00%
- Median HH income
- $45,940
- Composite
- 19.53/100
- National rank
- #8764
- State rank
- #383 of 620 in IL
Livability — Taylorville
- Score
- 68/100
- State rank
- #478
- US rank
- #9895
Category grades
Schools grade is shown separately in the Schools card above.
Census & demographics
- Census place
- Taylorville, IL
- City population
- 16,035
- Population (ZIP)
- 16,035
Population outlook (Christian County) Hauer SSP2
- Today (2025)
- 31,182 people
- By 2030
- 29,787 · -4.5%
- By 2040
- 26,793 · -14.1%
- By 2050
- 23,757 · -23.8%
- By 2075
- 17,333 · -44.4%
- By 2100
- 11,573 · -62.9%
Race, ethnicity, and origin ACS 2023
- Neighborhood character
- Predominantly White (91%)
- Race & ethnicity
- White 91% Black 4% Two or more races 2% Hispanic / Latino 2% Asian 1%
- Common ancestry
- Lithuanian 2% Slovak 2% Romanian 1%
- Foreign-born
- 2% · Canada
- Languages at home
- 97% English-only · Spanish 2% Other Indo-European 1%
Political lean MEDSL · Christian
- 2024 margin
- Solid R (+46.7) · D 25.9% · R 72.6% · Other 1.5%
- 2008→2024 swing
- -40.4pp toward R · 2008: -6.3pp · 2024: -46.7pp
- All cycles
- 2024: R+46.7 2020: R+44.6 2016: R+42.7 2012: R+23.1 2008: R+6.3
Not yet ingested
- Civics
- —
Market trends
- HPI YoY
- ▼ -171.77%
- Current HPI
- 159.2588
- Rent YoY
- —
- Metro
- —
- State GDP YoY
- ▲ 1.59%
- F500 in state
- 60
Industry mix (Fortune 500 HQ in IL)
| Industry | F500 HQs | Revenue |
|---|---|---|
| Insurance | 4 | $201B |
|
||
| Consumer Goods | 4 | $87B |
|
||
| Industrial Machinery | 3 | $64B |
|
||
| Healthcare | 2 | $55B |
|
||
| Retail / Pharmacy | 1 | $148B |
|
||
| Agriculture / Food | 1 | $86B |
|
||
Price history
+187.3% since first listed12 events — show timeline
- 2026-05-27 Listed $79,900 RMLSA as Distributed by MLS Grid
- 2021-08-06 Listing Removed — RMLSA as Distributed by MLS Grid
- 2021-08-06 Listing Removed — RMLSA as Distributed by MLS Grid
- 2021-04-15 Sold (Public Records) $73,500 Public Records
- 2021-04-14 Sold (MLS) $73,500 RMLSA as Distributed by MLS Grid
- 2021-02-05 Listed $74,900 RMLSA as Distributed by MLS Grid
- 2019-01-23 Listing Removed — MRED as Distributed by MLS Grid
- 2016-03-08 Listing Removed — MRED as Distributed by MLS Grid
- 2009-11-10 Sold (Public Records) $51,000 Public Records
- 2009-11-09 Sold (MLS) $51,000 RMLSA as Distributed by MLS Grid
- 2009-07-13 Listed $54,900 RMLSA as Distributed by MLS Grid
- 2004-12-23 Sold (Public Records) $27,810 Public Records
Property tax history
+2.6%/yrLatest (2024): $1,900 · +8.0% YoY. Source: county tax records.
Cash-flow waterfall
monthlySold comps — $/sqft
last 12 mo · ≤1 miLoading sold comps…