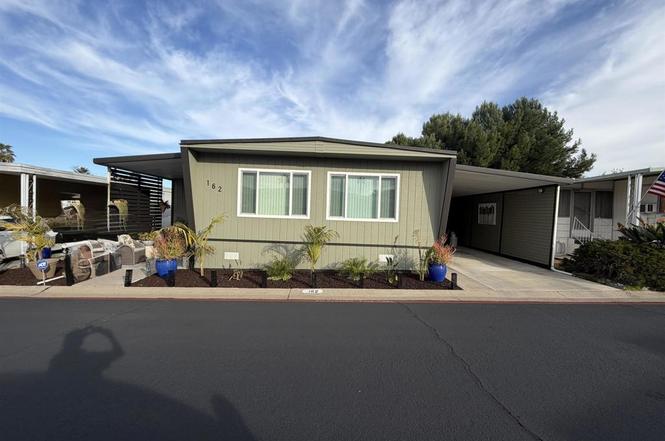
8301-, Mission Mission Gorge Rd #162 · Santee, CA
Flood risk 1/10 · Minimal
- FEMA flood zone
- X (unshaded)
- Chance of flooding over 30 yrs
- 0.0%
- Est. flood insurance / yr
- $507 – $1,088
Fire risk 5/10 · Moderate
- Est. fire insurance / yr
- $659 – $1,223
Heat risk 4/10 · Minor
- Hot days now (above 96°F)
- 4 days/yr
- Hot days in 30 yrs
- 11 days/yr
Wind risk 1/10 · Minimal
- Chance of severe wind over 30 yrs
- —
Air-quality risk 3/10 · Minor
- Unhealthy air days now
- 4 days/yr
- Unhealthy air days in 30 yrs
- 4 days/yr
Risk factors via First Street. Map © Google.
Why this score? — see what drove the B- grade
The composite is a weighted blend of 9 inputs, each scored 0–100. Each bar is that input's sub-score; the figure is the points it added to the 100-point composite (weight × sub-score).
- Cash flow +28.3/30.0
- ARV discount +10.3/15.0
- DSCR +10.0/10.0
- 1% rule +7.8/10.0
- Schools +4.5/10.0
- Livability +3.2/5.0
- Rent growth +2.7/5.0
- Condition / age +2.5/5.0
- Appreciation +0.0/10.0
$239,000
🖨 Deal sheet 📄 Offer letter ✓ Due diligence
Listing remarks
Welcome to Santee living at its finest! Step into this beautifully updated home featuring a newly remodeled kitchen with quartz countertops, a stylish tile backsplash, and a custom coffee bar. Enjoy new stainless steel appliances, overhead lighting in both the kitchen and living room, and fresh paint throughout. Natural light floods the home with updated windows, including those in the spacious California room – perfect for relaxing and entertaining. The primary bathroom offers comfort and accessibility with a walk-in Jacuzzi tub, while both bathrooms feature skylights, that brighten the space naturally Stay cool Year-round with a recently serviced air conditioner that keeps the home
Key facts
- Manicured front yard
- Updated windows
- Walk-in jacuzzi tub
Tags
Property features AI
Finance
- Other: Lot size estimated; Lot dimensions from public records; Living area source: public records
- Financial info: Land lease: $1,786 monthly
- HOA & community: Senior community; Park name: Meadowbrook Mobile Estates; Community features: hiking, foothills, street lighting, park; Manager approval required; Pets allowed
Exterior
- Parking: Attached carport with 2 spaces; Has parking
- Utilities: Public sewer; Cable available
- Home design: Mobile home (24' x 48') — mobile home remains on site; Double body type; Single story; Entry level: 1
- Construction: Updated/remodeled condition
- Exterior features: Community pool; Landscaped yard; Back yard; Park nearby; Has view; One shed
Interior
- Kitchen: Kitchen (appliances not specified)
- Bedrooms: Primary bedroom
- Bathrooms: 2 full bathrooms
- Heating & cooling: Central furnace heating; Central cooling
- Interior features: Laminate counters; Unfurnished; Storage space; Front door entry; One-level layout; Walk-in closet; Living room; Family room
- Laundry & utility: Inside laundry
Neighborhood map
What this means for you Summary
Snapshot
- This is a 2-bed/2.0-bath manufactured listed at $239k.
Deal economics
- At list price, monthly cash flow is $764 ($9k/yr) — positive.
- The deal already cash-flows at list — no discount required.
- Meets the 1% rule at list price ($3k rent vs $239k).
- Recommended offer: $210k (12.0% below list) — sets the bar for market timing.
- Cap rate 10.1% vs local median 2.6% in Santee — top-decile yield for the area; either an underpriced asset or a hidden risk that comps aren't pricing in. Stress-test before assuming the spread holds.
Location & tenants
- Location reads 65/100 on livability (#361 in CA) — a middle-class / working-renter tenant base. Strengths: commute A+, employment A+, crime A-; Watch: health & safety C-, amenities D, cost of living F.
- Santee (suburban): math 46% / reading 54% proficiency, ranked #130 of 517 in CA (top 25%) — acceptable for families but not a draw, mixed tenant base, ~2y average lease.
- Market conditions: Rents flat; 197 active listings in the ZIP; 11 comparable units currently listed for rent nearby; rentals leasing fast (median 2d on market — plan ~1-2 weeks tenant-placement turnaround); high-income renter base; 11,759 units permitted in San Diego County in 2024 (7,244 in 5+ unit buildings).
- This rent runs 32% of the median local income ($114k/yr) — at the standard rent-burdened threshold; future hikes will face affordability resistance.
Forward outlook
- Local home prices are declining (-3.0%/yr); year-one equity from $2k of loan paydown is wiped out by about $7k of value loss. Plan a longer hold.
- San Diego County population projected at +20% by 2050 — long-run rental-demand tailwind backs the buy-and-hold thesis.
Negotiation context
- It's been on market 141 days — a 12% lower offer ($210k) is reasonable based on typical stale-listing flexibility.
- 8 sale attempts since 15y ago; this cycle's ask has dropped $40k (14%) from the opening price — seller is motivated, your offer sets the floor, not the list.
- Current owner paid $170k; 41% above their basis — modest negotiation headroom, anchor on the comps not their cost.
Risks & watch-outs
- Climate carrying-cost: moderate wildfire risk — expect insurance premiums to compound above CPI over the hold.
Questions for the listing agent
- It's been on market 141 days. Have you received any prior offers? Is the seller open to a 12% concession, seller financing, or rate buy-down credit?
- Built in 1969 — when were the roof, HVAC, electrical panel, plumbing, and water heater last replaced?
- Why hasn't it sold? Are there any deal-killer items the seller is aware of (foundation, flood, title, zoning, code violations)?
- Is there a deadline driving the sale (1031 exchange, divorce, estate, relocation)? That informs how much negotiation room exists.
- What's the average days-on-market for RENTAL listings here right now (not sales)? A rising rental-DOM trend means longer vacancies and softer asking-rent achievability than the comps imply.
- What's the recent tenant-quality profile in this submarket — average credit score on applications, eviction rate, late-payment / NSF rate, and stable-employment percentage? A property-management company in the area should have these aggregated.
- How much new for-sale + rental construction is in the pipeline within 1–3 miles? Heavy new supply typically softens prices + rents 12–24 months out; constrained supply supports both.
Investment metrics
- 1% rule
- 1.28% ✓
- Cap rate
- 10.13%
- Cash-on-cash
- 13.70%
- DSCR
- 1.61
- GRM
- 6.5
CMA / ARV
- ARV (on-the-fly)
- $254,592
- Comps found
- 12
Show comp detail 12 sales within ~0.75 mi
| Address | Dist | Beds/Ba | Sqft | Sold | Price | $/sf | Match |
|---|---|---|---|---|---|---|---|
| 8301 Mission Gorge Rd #170 | 0.00mi | 2/2.0 | 1,120 (-3%) | 10mo | $265,000 | $237 | 87 |
| 8301 Mission Gorge Rd #181 | 0.00mi | 2/2.0 | 1,100 (-4%) | 11mo | $210,000 | $191 | 83 |
| 8301 Mission Gorge Rd #282 | 0.00mi | 2/2.0 | 1,248 (+8%) | 5mo | $310,000 | $248 | 82 |
| 8301 Mission Gorge Rd #86 | 0.00mi | 2/2.0 | 1,272 (+10%) | 2mo | $223,000 | $175 | 81 |
| 8301 Mission Gorge Rpad Rd #152 | 0.00mi | 2/2.0 | 1,248 (+8%) | 13mo | $240,000 | $192 | 75 |
| 8301 Mission Gorge Rd #159 | 0.10mi | 2/2.0 | 1,220 (+6%) | 13mo | $180,000 | $148 | 75 |
| 8301 Mission Gorge Rd Spc 326 | 0.00mi | 2/2.0 | 1,025 (-11%) | 16mo | $290,000 | $283 | 68 |
| 8301 Mission Gorge Road 301 | 0.00mi | 3/2.0 (+1) | 1,320 (+15%) | 4mo | $295,000 | $223 | 67 |
| 7908 Rancho Fanita Dr #63 | 0.34mi | 3/2.0 (+1) | 1,238 (+8%) | 10mo | $234,000 | $189 | 59 |
| 8545 Mission Gorge Rd Spc 141 | 0.41mi | 2/2.0 | 1,040 (-10%) | 7mo | $230,000 | $221 | 58 |
| 8545 Mission Gorge Rd #239 | 0.47mi | 2/2.0 | 1,060 (-8%) | 10mo | $130,000 | $123 | 56 |
| 8545 Mission Gorge Rd #255 | 0.47mi | 2/2.0 | 1,060 (-8%) | 14mo | $250,000 | $236 | 53 |
Match score weights: distance 35% · size 25% · config 20% · recency 20%. Top-matched comps best support the ARV.
Projected returns pro-forma
-3.0% appreciation · 0.85% rent growth · sell at horizon
- IRR
- 1.4%
- Equity multiple
- 1.05×
- Total profit
- $3,492
- Equity at exit
- $35,636
- IRR
- 8.8%
- Equity multiple
- 1.60×
- Total profit
- $40,422
- Equity at exit
- $20,664
Cash invested: $66,920 (down + closing). Projections, not guarantees.
Landlord ↔ Tenant lean methodology
- Overall (STATE)
- 18 Strongly Tenant-Friendly
- State California
- 18 Strongly Tenant-Friendly · D+13
- County
- — inherits STATE
- City
- — inherits STATE
ZIP-level market 92071
- Rents YoY
- 0.8%
- Active inventory
- 197
- Price-to-rent
- 6.5×
Monthly cashflow live
- Estimated rent
- $3,058 high interval (Pro) →
- Mortgage (P&I)
- −$1,253
- Tax est. 1.5%
- −$299 /mo · $3,585/yr
- Insurance
- −$100
- HOA
- −$0
- Vacancy / Maint / Mgmt
- −$642
- Net cashflow
- $764
Break-even live
UW: 25.0% down · 7.5% · 30yr · 1.5% tax · 5.0% vac · 8.0% maint · 8.0% mgmt
Financing live
Cash to close
- Down payment
- $59,750
- Closing costs
- $7,170
- Reserves months
- —
- Total cash needed
- —
Loan-product check · same deal, 3 products live
Conventional
25% down · 7.5% · 30yr
- Down + closing
- —
- Monthly P&I
- —
- Monthly cashflow
- —
- DSCR
- —
- Eligible?
- —
Personal DTI + credit; lowest rate.
DSCR
20% down · 8.5% · 30yr
- Down + closing
- —
- Monthly P&I
- —
- Monthly cashflow
- —
- DSCR
- —
- Eligible?
- —
No personal income docs; deal must DSCR.
Hard money
10% down · 12.0% · 12mo
- Down + closing
- —
- Monthly P&I
- —
- Monthly cashflow
- —
- DSCR
- —
- Eligible?
- —
Short-term bridge; refi at stabilization.
Rent comps 11 comps
| Address | Beds | Baths | Sqft | Rent | $/sqft | DOM | Units | Dist |
|---|---|---|---|---|---|---|---|---|
| 7962 Arly Ct #12 Santee, CA | 2.0 | 2.0 | 945 | $2,800 | $2.96 | 1d | 1 | 0.30mi |
| 7847 Mission Gorge Rd Santee, CA | 1.0 | 1.0–2.0 | 870 | $2,845 | $3.27 | 1d | 4 | 0.40mi |
| 69 Via Sovana Santee, CA | 3.0 | 3.0 | 1342 | $3,600 | $2.68 | 1d | 1 | 0.46mi |
| 177 Via Montisi Santee, CA | 2.0 | 2.5 | 1239 | $3,450 | $2.78 | 1d | 1 | 0.47mi |
| 8605 Arminda Cir Santee, CA | 2.0 | 2.0 | 958 | $2,650 | $2.77 | 1d | 1 | 0.53mi |
| 8609 Arminda Cir #13 Santee, CA | 2.0 | 2.0 | 984 | $3,000 | $3.05 | 1d | 1 | 0.54mi |
| 8434 Kreiner Way Santee, CA | 3.0 | 2.0 | 1305 | $4,213 | $3.23 | 21d | 1 | 0.83mi |
| 8617 Bushy Hill Dr Santee, CA | 2.0–3.0 | 2.0–3.0 | 1299 | $2,700 | $2.08 | 1d | 1 | 0.92mi |
| 8745 Redwood Dr Santee, CA | 2.0–3.0 | 1.5–2.5 | 1264 | $2,850 | $2.25 | 1d | 1 | 1.15mi |
| 8009 Calle Fanita Santee, CA | 2.0 | 1.5 | 1024 | $2,995 | $2.92 | 1d | 1 | 1.18mi |
| 9409 Lake Murray Blvd San Diego, CA | 2.0 | 2.5 | 1290 | $3,300 | $2.56 | 17d | 1 | 1.41mi |
Listing history 39 events
-
2026-06-18days on market $239,000 Active 141 DOM
-
2026-06-17days on market $239,000 Active 140 DOM
-
2026-06-16days on market $239,000 Active 139 DOM
-
2026-06-15days on market $239,000 Active 138 DOM
-
2026-06-13days on market $239,000 Active 136 DOM
-
2026-06-13days on market $239,000 Active 135 DOM
-
2026-06-09pricedays on market $239,000 Active 132 DOM
-
2026-06-08days on market $254,000 Active 131 DOM
-
2026-06-07days on market $254,000 Active 130 DOM
-
2026-06-04days on market $254,000 Active 127 DOM
-
2026-06-03days on market $254,000 Active 126 DOM
-
2026-06-02days on market $254,000 Active 125 DOM
-
2026-06-01days on market $254,000 Active 124 DOM
-
2026-05-31days on market $254,000 Active 123 DOM
-
2026-04-21price $254,000
-
2026-02-26price $259,000
-
2026-01-28historical
-
2026-01-27$279,000 Active
-
2025-10-06price $289,000
-
2025-08-31$299,000 Active
-
2025-01-18historical
-
2024-11-06soldstatus $170,000 Closed Sale
-
2024-10-10status Pending Sale
-
2024-10-06price $189,900
-
2024-09-05$199,900 Active
-
2022-02-23soldstatus $149,000 Closed Sale
-
2022-02-08status Pending Sale
-
2022-01-20price $149,000
-
2022-01-04$159,900 Active
-
2016-11-14soldstatus $45,000 Sold
-
2016-10-10status Pending
-
2016-09-21$47,500 Active
-
2016-08-15soldstatus $42,500 Sold
-
2016-07-22status Pending
-
2016-07-13price $42,500
-
2016-06-26$64,500 Active
-
2016-06-25$64,500
-
2011-08-31soldstatus $10,000
-
2011-07-15$15,500
ⓘ Source: listings_history table (triggers on properties + properties_extension) + one-shot
backfill from property_details.listing_events for pre-trigger history.
Climate risk First Street
- Flood 1/10 Low FEMA zone X (unshaded) · 0% chance over 30 yrs
- Wildfire 5/10 Major
- Heat 4/10 Moderate 4 d/yr ≥96°F today · 11 d/yr by 30 yrs out
- Wind 1/10 Low
- Air quality 3/10 Moderate 4 unhealthy d/yr today · 4 by 30 yrs out
Nearby sold comps map
Loading sold comps map…
Walkable amenities ~0.75 mi
Loading nearby amenities…
Taxation est. · year 1
- Rental income
- $36,692
- − Mortgage interest
- −$13,388
- − Property taxes
- −$3,585
- − Insurance
- −$1,195
- − Repairs & maintenance
- −$2,935
- − Management
- −$2,935
- − Depreciation
- −$6,953
- Taxable income
- $5,700
- Est. tax owed @ 24.0%
- −$1,368
- After-tax cash flow
- $7,798/yr
For passive investors: Depreciation is non-cash, so a rental often shows a tax loss while cash-flowing — sheltering income. Rental losses are passive: they offset passive income freely, and up to $25,000/yr can offset ordinary (W-2) income if you actively participate and your MAGI is under $100k (phasing out to $0 by $150k); unused losses carry forward. On sale, claimed depreciation is recaptured at up to 25%, and gains may owe capital-gains tax (a 1031 exchange can defer both). Figures are a year-1 estimate at your 24.0% rate — not tax advice; consult a CPA.
Schools (NCES district)
- District
- Santee
- NCES district ID
- 0635880
- Math proficiency
- 46% ▼ -3.00%
- Reading proficiency
- 54% ▼ -2.00%
- Median HH income
- $73,452
- Composite
- 45.0/100
- National rank
- #2698
- State rank
- #130 of 517 in CA
Livability — Santee
- Score
- 65/100
- State rank
- #361
- US rank
- #12272
Category grades
Schools grade is shown separately in the Schools card above.
Census & demographics
- Census place
- Santee, CA
- County
- San Diego County · 3,178,799 people
- City population
- 59,590
- Metro
- San Diego-Chula Vista-Carlsbad, CA
- Population (ZIP)
- 59,590
- Household income
- $113,618
- Rent vs Own
- Severe rent burden
- 1719.0
Population outlook (San Diego County) Hauer SSP2
- Today (2025)
- 3,678,185 people
- By 2030
- 3,856,546 · +4.8%
- By 2040
- 4,171,407 · +13.4%
- By 2050
- 4,421,607 · +20.2%
- By 2075
- 4,831,599 · +31.4%
- By 2100
- 4,832,502 · +31.4%
Race, ethnicity, and origin ACS 2023
- Neighborhood character
- Majority White (63%)
- Race & ethnicity
- White 63% Hispanic / Latino 22% Two or more races 16% Asian 5% Black 2%
- Hispanic origin (detail)
- Mexican 18%
- Common ancestry
- Slovak 3% Italian 3% Lithuanian 2%
- Foreign-born
- 13% · Canada, Vietnam, China
- Languages at home
- 81% English-only · Spanish 8% Arabic 3% Other Asian/Pacific 1%
Political lean MEDSL · San Diego
- 2024 margin
- D (+16.8) · D 56.9% · R 40.1% · Other 2.9%
- 2008→2024 swing
- +6.6pp toward D · 2008: 10.2pp · 2024: 16.8pp
- All cycles
- 2024: D+16.8 2020: D+22.8 2016: D+17.8 2012: D+5.1 2008: D+10.2
Not yet ingested
- Civics
- —
Market trends
- HPI YoY
- ▼ -607.00%
- Current HPI
- 393.1781
- Rent YoY
- ▲ 0.85%
- Metro
- San Diego-Chula Vista-Carlsbad, CA
- State GDP YoY
- ▲ 3.21%
- F500 in state
- 116
Industry mix (Fortune 500 HQ in CA)
| Industry | F500 HQs | Revenue |
|---|---|---|
| Technology | 27 | $1,492B |
|
||
| Financial Services | 3 | $174B |
|
||
| Retail | 3 | $44B |
|
||
| Insurance | 3 | $26B |
|
||
| Media / Entertainment | 2 | $115B |
|
||
| Pharmaceuticals / Biotech | 2 | $62B |
|
||
Price history
+1538.7% since first listed25 events — show timeline
- 2026-04-21 Price Changed $254,000 CRMLS
- 2026-02-26 Price Changed $259,000 CRMLS
- 2026-01-28 Listing Removed — CRMLS
- 2026-01-27 Listed $279,000 CRMLS
- 2025-10-06 Price Changed $289,000 CRMLS
- 2025-08-31 Listed $299,000 CRMLS
- 2025-01-18 Listing Removed — SDMLS
- 2024-11-06 Sold (MLS) $170,000 CRMLS
- 2024-10-10 Pending — CRMLS
- 2024-10-06 Price Changed $189,900 CRMLS
- 2024-09-05 Listed $199,900 CRMLS
- 2022-02-23 Sold (MLS) $149,000 CRMLS
- 2022-02-08 Pending — CRMLS
- 2022-01-20 Price Changed $149,000 CRMLS
- 2022-01-04 Listed $159,900 CRMLS
- 2016-11-14 Sold (MLS) $45,000 SDMLS
- 2016-10-10 Pending — SDMLS
- 2016-09-21 Listed $47,500 SDMLS
- 2016-08-15 Sold (MLS) $42,500 SDMLS
- 2016-07-22 Pending — SDMLS
- 2016-07-13 Price Changed $42,500 SDMLS
- 2016-06-26 Listed $64,500 SDMLS
- 2016-06-25 Listed $64,500 SDMLS
- 2011-08-31 Sold (MLS) $10,000 CRMLS
- 2011-07-15 Listed $15,500 CRMLS
Property tax history
-14.7%/yrLatest (2013): $118 · +2.9% YoY. Source: county tax records.
Cash-flow waterfall
monthlySold comps — $/sqft
last 12 mo · ≤1 miLoading sold comps…