3060 NE McWilliams Rd #89 · Bremerton, WA
Flood risk 1/10 · Minimal
- FEMA flood zone
- X (unshaded)
- Chance of flooding over 30 yrs
- 0.0%
- Est. flood insurance / yr
- $507 – $1,088
Fire risk 3/10 · Minor
- Est. fire insurance / yr
- $604 – $1,122
Heat risk 3/10 · Minor
- Hot days now (above 86°F)
- 7 days/yr
- Hot days in 30 yrs
- 14 days/yr
Wind risk 1/10 · Minimal
- Chance of severe wind over 30 yrs
- —
Air-quality risk 7/10 · Major
- Unhealthy air days now
- 9 days/yr
- Unhealthy air days in 30 yrs
- 10 days/yr
Risk factors via First Street. Map © Google.
Why this score? — see what drove the B grade
The composite is a weighted blend of 9 inputs, each scored 0–100. Each bar is that input's sub-score; the figure is the points it added to the 100-point composite (weight × sub-score).
- Cash flow +30.0/30.0
- 1% rule +10.0/10.0
- DSCR +10.0/10.0
- ARV discount +6.4/15.0
- Schools +5.5/10.0
- Livability +4.3/5.0
- Condition / age +3.8/5.0
- Rent growth +2.6/5.0
- Appreciation +0.0/10.0
$105,000
🖨 Deal sheet 📄 Offer letter ✓ Due diligence
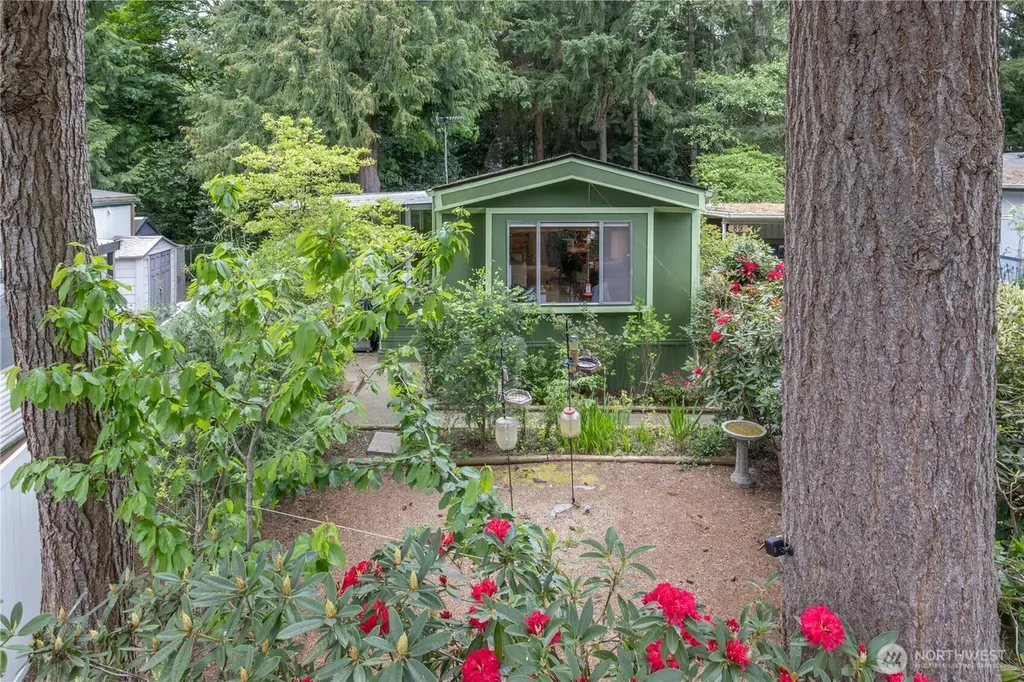
Listing remarks
Affordable, well maintained 2-bedroom home located in a desirable all-age park. Updates include a newer roof with stainless gutter guards, newer water heater, and freshly painted exterior for low-maintenance living. Stay comfortable year-round with a dual-head ductless heat pump. All appliances included - washer and dryer, too. Outside, you will enjoy the mature flowering plants and cherry trees creating a peaceful setting. The home backs up to a greenbelt and offers a private, level area for entertaining, plus an 8’ x 11’ enclosed porch ideal for morning coffee or hobbies. Need storage or workspace? You will appreciate the 2 raised shed/workshops with durable metal framing and
Key facts
- Newer roof
- Newer water heater
- 3 parking spots
Tags
Property features AI
Finance
- Other: Taxes reported (annual): $473
- Financial info: Listing terms: Cash
- HOA & community: Manufactured home park approved for sale; Kariotis mobile park with clubhouse, common area, recreational area; 137 homes in park; Land lease $853
Exterior
- Parking: Carport; Uncovered parking
- Utilities: Electric energy source; Public water (park pays water); Sewer service (park pays sewer); Puget Sound Energy power; Xfinity cable connected; Xfinity internet connected; Electric water heater (exterior access)
- Home design: Manufactured single-wide home (Fleetwood 66X14); One level; Average condition; Manufactured house structure type; Mobile home remains; Tie down foundation
- Construction: Metal/vinyl construction materials; Composition roof
- Exterior features: Metal/vinyl exterior; Patio/porch/deck; Landscaped
Interior
- Kitchen: Dishwasher; Garbage disposal; Microwave; Refrigerator; Stove/Range
- Bedrooms: 2 bedrooms
- Flooring: Carpet
- Bathrooms: 1 full bath; 1 bathtub; 2 showers
- Heating & cooling: Ductless heating; Forced air heating; Has cooling
- Interior features: Water heater (exterior access); Jetted/soaking tub; Ceiling fan(s); Bath off primary; Patio/porch/deck; Landscaped
- Laundry & utility: Washer; Dryer; Utility room
Neighborhood map
What this means for you Summary
Snapshot
- This is a 2-bed/1.0-bath manufactured listed at $105k. Condition is rated good.
Deal economics
- At list price, monthly cash flow is $881 ($11k/yr) — positive.
- The deal already cash-flows at list — no discount required.
- Meets the 1% rule at list price ($2k rent vs $105k).
- Recommended offer: $102k (3.0% below list) — sets the bar for market timing.
- Cap rate 16.4% vs local median 3.5% in Bremerton — top-decile yield for the area; either an underpriced asset or a hidden risk that comps aren't pricing in. Stress-test before assuming the spread holds.
Location & tenants
- Location reads 86/100 on livability (#22 in WA, #431 nationally) — a professional / high-income tenant draw. Strengths: amenities A+, commute A+, housing A+; Watch: crime F.
- Central Kitsap School District (urban): math 55% / reading 67% proficiency, ranked #49 of 291 in WA (top 17%) — acceptable for families but not a draw, mixed tenant base, ~2y average lease.
- Market conditions: Rents flat; 151 active listings in the ZIP; 9 comparable units currently listed for rent nearby; rentals leasing fast (median 14d on market — plan ~1-2 weeks tenant-placement turnaround); solid renter incomes; 1,294 units permitted in Kitsap County in 2024 (302 in 5+ unit buildings).
Forward outlook
- Local home prices are declining (-3.0%/yr); year-one equity from $726 of loan paydown is wiped out by about $3k of value loss. Plan a longer hold.
- Kitsap County population projected at +8% by 2050 — modest demand growth; plan on rents tracking national, not racing it.
- At projected returns (-3.0% appreciation + 0.3% rent growth), your $29k cash investment doubles in ~4 years — after that, you're playing with house money.
Negotiation context
- It's been on market 41 days — a 3% lower offer ($102k) is reasonable based on typical stale-listing flexibility.
Questions for the listing agent
- It's been on market 41 days. Have you received any prior offers? Is the seller open to a 3% concession, seller financing, or rate buy-down credit?
- Built in 1976 — when were the roof, HVAC, electrical panel, plumbing, and water heater last replaced?
- Is there a deadline driving the sale (1031 exchange, divorce, estate, relocation)? That informs how much negotiation room exists.
- Schools are B-rated — typically a magnet for longer-tenancy family renters. What's the average tenant stay here, and is there a school-zone premium baked into asking?
- Crime grade is F in this area — have there been break-ins, vandalism, or insurance claims at this property in the last 3 years? What carrier currently insures it and at what premium?
- What's the average days-on-market for RENTAL listings here right now (not sales)? A rising rental-DOM trend means longer vacancies and softer asking-rent achievability than the comps imply.
- What's the recent tenant-quality profile in this submarket — average credit score on applications, eviction rate, late-payment / NSF rate, and stable-employment percentage? A property-management company in the area should have these aggregated.
- How much new for-sale + rental construction is in the pipeline within 1–3 miles? Heavy new supply typically softens prices + rents 12–24 months out; constrained supply supports both.
Investment metrics
- 1% rule
- 1.94% ✓
- Cap rate
- 16.36%
- Cash-on-cash
- 35.96%
- DSCR
- 2.60
- GRM
- 4.3
CMA / ARV
- ARV (median comp)
- $102,415
- List price
- $105,000
- Delta
- 2.52%
- Verdict
- FAIR
- Comps
- 7 within 1.0 mi
Show comp detail 7 sales within ~0.75 mi
| Address | Dist | Beds/Ba | Sqft | Sold | Price | $/sf | Match |
|---|---|---|---|---|---|---|---|
| 3060 NE McWilliams Rd | 0.00mi | 2/1.5 | 924 (0%) | 7mo | $70,000 | $76 | 92 |
| 3060 NE McWilliams Rd #52 | 0.10mi | 2/2.0 | 960 (+4%) | 0mo | $120,000 | $125 | 85 |
| 3060 NE McWilliams Rd #122 | 0.00mi | 2/1.0 | 793 (-14%) | 2mo | $76,000 | $96 | 75 |
| 3060 NE McWilliams Rd #25 | 0.10mi | 2/2.0 | 930 (+1%) | 19mo | $80,000 | $86 | 74 |
| 3060 NE McWilliams Rd #36 | 0.10mi | 2/1.0 | 840 (-9%) | 18mo | $30,000 | $36 | 66 |
| 3060 NE McWillams Rd #115 | 0.10mi | 3/1.0 (+1) | 1,056 (+14%) | 20mo | $140,000 | $133 | 50 |
| 3380 NE 3rd St #12 | 0.30mi | 2/2.0 | 1,008 (+9%) | 24mo | $85,000 | $84 | 47 |
Match score weights: distance 35% · size 25% · config 20% · recency 20%. Top-matched comps best support the ARV.
Projected returns pro-forma
-3.0% appreciation · 0.27% rent growth · sell at horizon
- IRR
- 28.5%
- Equity multiple
- 2.15×
- Total profit
- $33,684
- Equity at exit
- $15,656
- IRR
- 34.3%
- Equity multiple
- 3.74×
- Total profit
- $80,574
- Equity at exit
- $9,078
Cash invested: $29,400 (down + closing). Projections, not guarantees.
Landlord ↔ Tenant lean methodology
- Overall (STATE)
- 28 Tenant-Leaning
- State Washington
- 28 Tenant-Leaning · D+8
- County
- — inherits STATE
- City
- — inherits STATE
ZIP-level market 98311
- Rents YoY
- 0.3%
- Active inventory
- 151
- Price-to-rent
- 4.3×
Monthly cashflow live
- Estimated rent
- $2,034 high interval (Pro) →
- Mortgage (P&I)
- −$551
- Tax est. 1.5%
- −$131 /mo · $1,575/yr
- Insurance
- −$44
- HOA
- −$0
- Vacancy / Maint / Mgmt
- −$427
- Net cashflow
- $881
Break-even live
UW: 25.0% down · 7.5% · 30yr · 1.5% tax · 5.0% vac · 8.0% maint · 8.0% mgmt
Financing live
Cash to close
- Down payment
- $26,250
- Closing costs
- $3,150
- Reserves months
- —
- Total cash needed
- —
Loan-product check · same deal, 3 products live
Conventional
25% down · 7.5% · 30yr
- Down + closing
- —
- Monthly P&I
- —
- Monthly cashflow
- —
- DSCR
- —
- Eligible?
- —
Personal DTI + credit; lowest rate.
DSCR
20% down · 8.5% · 30yr
- Down + closing
- —
- Monthly P&I
- —
- Monthly cashflow
- —
- DSCR
- —
- Eligible?
- —
No personal income docs; deal must DSCR.
Hard money
10% down · 12.0% · 12mo
- Down + closing
- —
- Monthly P&I
- —
- Monthly cashflow
- —
- DSCR
- —
- Eligible?
- —
Short-term bridge; refi at stabilization.
Rent comps 9 comps
| Address | Beds | Baths | Sqft | Rent | $/sqft | DOM | Units | Dist |
|---|---|---|---|---|---|---|---|---|
| 6056 Illahee Rd NE Unit A Bremerton, WA | 2.0 | 1.0 | 711 | $1,850 | $2.60 | 43d | 1 | 0.64mi |
| 1970 NE Fuson Rd Bremerton, WA | 1.0–2.0 | 1.0–2.0 | 676 | $2,297 | $3.40 | 13d | 12 | 0.86mi |
| 6101 Washington 303 Bremerton, WA | 1.0–3.0 | 1.0–2.0 | 1010 | $2,378 | $2.35 | 13d | 70 | 1.04mi |
| 1231 NE McWilliams Rd Bremerton, WA | 1.0–3.0 | 1.0–2.0 | 961 | $2,227 | $2.32 | 13d | 26 | 1.09mi |
| 1381 NE Fairgrounds Rd Bremerton, WA | 1.0–3.0 | 1.0–2.0 | 949 | $2,022 | $2.13 | 13d | 14 | 1.26mi |
| 1911 NE Riddell Rd Bremerton, WA | 2.0 | 1.0–2.0 | 858 | $1,980 | $2.31 | 13d | 10 | 1.27mi |
| 5180 Gibson Ln NE Unit B204 Bremerton, WA | 1.0 | 1.0 | 708 | $1,745 | $2.46 | 43d | 1 | 1.30mi |
| 5163 NE Mariah Ln Bremerton, WA | 1.0–2.0 | 1.0 | 821 | $1,895 | $2.31 | 13d | 2 | 1.35mi |
| 1823 NE Rustic Ln Bremerton, WA | 1.0 | 1.0 | 814 | $1,850 | $2.27 | 43d | 1 | 1.39mi |
Listing history 16 events
-
2026-06-18days on market $105,000 Active 41 DOM
-
2026-06-17days on market $105,000 Active 40 DOM
-
2026-06-16days on market $105,000 Active 39 DOM
-
2026-06-15days on market $105,000 Active 38 DOM
-
2026-06-14days on market $105,000 Active 36 DOM
-
2026-06-13days on market $105,000 Active 35 DOM
-
2026-06-10days on market $105,000 Active 33 DOM
-
2026-06-09days on market $105,000 Active 32 DOM
-
2026-06-08days on market $105,000 Active 31 DOM
-
2026-06-07days on market $105,000 Active 30 DOM
-
2026-06-05days on market $105,000 Active 27 DOM
-
2026-06-02days on market $105,000 Active 25 DOM
-
2026-06-01days on market $105,000 Active 24 DOM
-
2026-05-31days on market $105,000 Active 23 DOM
-
2026-05-30days on market $105,000 Active 22 DOM
-
2026-05-08$105,000 Active
ⓘ Source: listings_history table (triggers on properties + properties_extension) + one-shot
backfill from property_details.listing_events for pre-trigger history.
Climate risk First Street
- Flood 1/10 Low FEMA zone X (unshaded) · 0% chance over 30 yrs
- Wildfire 3/10 Moderate
- Heat 3/10 Moderate 7 d/yr ≥86°F today · 14 d/yr by 30 yrs out
- Wind 1/10 Low
- Air quality 7/10 Severe 9 unhealthy d/yr today · 10 by 30 yrs out
Nearby sold comps map
Loading sold comps map…
Walkable amenities ~0.75 mi
Loading nearby amenities…
Taxation est. · year 1
- Rental income
- $24,403
- − Mortgage interest
- −$5,882
- − Property taxes
- −$1,575
- − Insurance
- −$525
- − Repairs & maintenance
- −$1,952
- − Management
- −$1,952
- − Depreciation
- −$3,055
- Taxable income
- $9,463
- Est. tax owed @ 24.0%
- −$2,271
- After-tax cash flow
- $8,300/yr
For passive investors: Depreciation is non-cash, so a rental often shows a tax loss while cash-flowing — sheltering income. Rental losses are passive: they offset passive income freely, and up to $25,000/yr can offset ordinary (W-2) income if you actively participate and your MAGI is under $100k (phasing out to $0 by $150k); unused losses carry forward. On sale, claimed depreciation is recaptured at up to 25%, and gains may owe capital-gains tax (a 1031 exchange can defer both). Figures are a year-1 estimate at your 24.0% rate — not tax advice; consult a CPA.
Condition & rehab AI · 30 photos
A well-maintained 2-bedroom home with good condition and minimal repairs needed. The property offers a peaceful setting with mature landscaping and a private, level area for entertaining.
Repairs flagged
- Minor kitchen cabinets — slight wear
- Minor bathroom cabinets — slight wear
- Minor exterior paint — green paint
Value-add opportunities
- Resale paint interior walls — enhances curb appeal
- Resale replace carpet — improves comfort and appearance
- Resale repair kitchen cabinets — enhances functionality and appearance
- Resale repair bathroom cabinets — enhances functionality and appearance
- Resale repair exterior paint — enhances curb appeal
Renovation cost estimate screening
| Repair item | Severity | Est. cost |
|---|---|---|
| kitchen cabinets · slight wear | Minor | $500–3,000 |
| bathroom cabinets · slight wear | Minor | $500–3,000 |
| exterior paint · green paint | Minor | $500–3,000 |
| Total estimated repair cost · 3 items | $1,500–9,000 |
Value-add ROI direction
- Resale paint interior walls — enhances curb appeal ↑
- Resale replace carpet — improves comfort and appearance ↑
- Resale repair kitchen cabinets — enhances functionality and appearance ↑
- Resale repair bathroom cabinets — enhances functionality and appearance ↑
- Resale repair exterior paint — enhances curb appeal ↑
ⓘ Cost ranges are severity-bucket heuristics (US national rule-of-thumb). Get contractor quotes + a written scope before underwriting a rehab budget.
Schools (NCES district)
- District
- Central Kitsap School District
- NCES district ID
- 5301080
- Math proficiency
- 55% ▲ 1.00%
- Reading proficiency
- 67% ▬ 0.00%
- Median HH income
- $64,825
- Composite
- 54.87/100
- National rank
- #2813
- State rank
- #49 of 291 in WA
Livability — Bremerton
- Score
- 86/100
- State rank
- #22
- US rank
- #431
Category grades
Schools grade is shown separately in the Schools card above.
Census & demographics
- County
- Kitsap County · 243,099 people
- City population
- 94,488
- Metro
- Bremerton-Silverdale-Port Orchard, WA
- Population (ZIP)
- 28,168
- Household income
- $108,757
- Rent vs Own
- Severe rent burden
- 502.0
Population outlook (Kitsap County) Hauer SSP2
- Today (2025)
- 277,525 people
- By 2030
- 285,040 · +2.7%
- By 2040
- 294,957 · +6.3%
- By 2050
- 300,622 · +8.3%
- By 2075
- 315,580 · +13.7%
- By 2100
- 304,340 · +9.7%
Race, ethnicity, and origin ACS 2023
- Neighborhood character
- Predominantly White (67%)
- Race & ethnicity
- White 67% Two or more races 14% Hispanic / Latino 9% Asian 9% Black 3% Pacific Islander 2%
- Hispanic origin (detail)
- Mexican 6%
- Common ancestry
- Portuguese 4% Italian 4% Slovak 3%
- Foreign-born
- 9% · Canada, Vietnam, China
- Languages at home
- 89% English-only · Tagalog/Filipino 4% Spanish 3% Vietnamese 2%
Political lean MEDSL · Kitsap
- 2024 margin
- Strong D (+20.9) · D 58.8% · R 37.9% · Other 3.3%
- 2008→2024 swing
- +8.6pp toward D · 2008: 12.3pp · 2024: 20.9pp
- All cycles
- 2024: D+20.9 2020: D+18.1 2016: D+11.6 2012: D+11.1 2008: D+12.3
Not yet ingested
- Civics
- —
Market trends
- HPI YoY
- ▼ -378.18%
- Current HPI
- 356.6272
- Rent YoY
- ▲ 0.27%
- Metro
- Bremerton-Silverdale-Port Orchard, WA
- State GDP YoY
- ▲ 4.65%
- F500 in state
- 22
Industry mix (Fortune 500 HQ in WA)
| Industry | F500 HQs | Revenue |
|---|---|---|
| Retail | 2 | $269B |
|
||
| Technology / Retail | 1 | $638B |
|
||
| Technology | 1 | $245B |
|
||
| Telecommunications | 1 | $38B |
|
||
| Food / Beverage | 1 | $36B |
|
||
| Automotive / Trucks | 1 | $34B |
|
||
Price history
1 event — show timeline
- 2026-05-08 Listed $105,000 NWMLS as Distributed by MLS Grid
Cash-flow waterfall
monthlySold comps — $/sqft
last 12 mo · ≤1 miLoading sold comps…