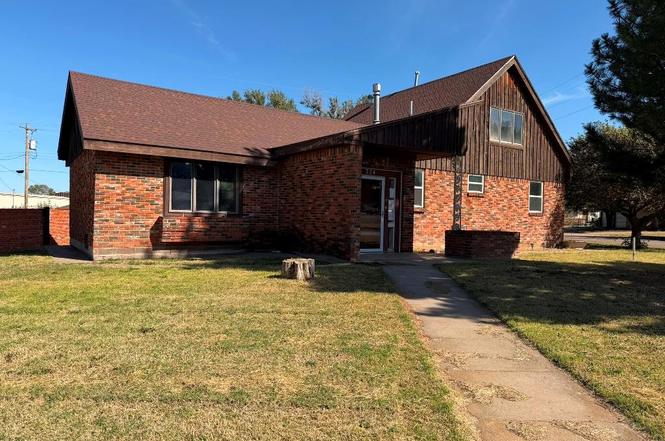
324 Avenue Unit N · Beaver, OK
Flood risk 1/10 · Minimal
- FEMA flood zone
- —
- Chance of flooding over 30 yrs
- 0.0%
- Est. flood insurance / yr
- —
Fire risk 7/10 · Major
- Est. fire insurance / yr
- $2,463 – $4,575
Heat risk 5/10 · Moderate
- Hot days now (above 103°F)
- 7 days/yr
- Hot days in 30 yrs
- 19 days/yr
Wind risk 2/10 · Minimal
- Chance of severe wind over 30 yrs
- —
Air-quality risk 2/10 · Minimal
- Unhealthy air days now
- 0 days/yr
- Unhealthy air days in 30 yrs
- 1 days/yr
Risk factors via First Street. Map © Google.
Why this score? — see what drove the A- grade
The composite is a weighted blend of 9 inputs, each scored 0–100. Each bar is that input's sub-score; the figure is the points it added to the 100-point composite (weight × sub-score).
- Cash flow +30.0/30.0
- ARV discount +15.0/15.0
- 1% rule +10.0/10.0
- DSCR +10.0/10.0
- Appreciation +7.6/10.0
- Livability +3.3/5.0
- Schools +3.1/10.0
- Rent growth +2.5/5.0
- Condition / age +2.5/5.0
$75,000
🖨 Deal sheet 📄 Offer letter ✓ Due diligence
Listing remarks
Charming 4-bed, 2-bath home on a spacious lot with tremendous potential. Featuring original hardwood floors and 2 carport spaces. Needs some TLC and repairs, ideal for investors or buyers ready to add value. Bring your vision! This property may qualify for Seller Financing (Vendee). If property was built prior to 1978, Lead Based Paint Potentially Exists.
Key facts
- 2 carport spaces
- Spacious lot
- 0.24 acre lot
Tags
Property features AI
Finance
- Other: REO / Bank Owned; Property is not occupied; Living area reported as 1,448 (source: assessor)
- Financial info: Not assumable
- HOA & community: No mandatory association dues
Exterior
- Parking: 2-car garage
- Utilities: Water/sewer/power information not specified
- Home design: Single family residence; One-story home; Residential property; Existing property
- Construction: Frame construction; Shingle roof; Slab foundation; Built status: existing
- Exterior features: No notable exterior features listed; Lot described as 'Other'
Interior
- Bedrooms: 4 bedrooms
- Bathrooms: 2 full bathrooms
- Heating & cooling: Electric heating
- Interior features: Two living areas; One fireplace (other type)
Neighborhood map
What this means for you Summary
Snapshot
- This is a 4-bed/2.0-bath single-family listed at $75k.
Deal economics
- At list price, monthly cash flow is $462 ($6k/yr) — positive.
- The deal already cash-flows at list — no discount required.
- Meets the 1% rule at list price ($1k rent vs $75k).
- Recommended offer: $66k (12.0% below list) — sets the bar for market timing.
Location & tenants
- Location reads 66/100 on livability (#126 in OK) — a middle-class / working-renter tenant base. Strengths: cost of living A+, housing A+, crime A-; Watch: health & safety C-, amenities F, commute F.
- Beaver (rural): math 30% / reading 35% proficiency, ranked #214 of 513 in OK (top 42%) — families likely to look elsewhere, expect single-tenant / working-renter base with shorter leases.
- Zoned schools: Beaver Es (math 22% / reading 27%, grade F, #354 of 845 statewide, top 47%, 191 students, 0% FRL); Beaver Hs (math 10% / reading 30%, grade F, #236 of 447 statewide, top 61%, 69 students, 0% FRL) — zoned schools average 0% FRL vs 48% district-wide (48 pts lower); this property's tenant base skews higher-income than the district average.
- Market conditions: 15 active listings in the ZIP.
Forward outlook
- In year one you build about $4k of equity ($519 loan paydown + $4k appreciation (5.2% local appreciation)).
- Beaver County population projected at +3% by 2050 — modest demand growth; plan on rents tracking national, not racing it.
- At projected returns (5.2% appreciation + 3.0% rent growth), your $21k cash investment doubles in ~3 years — after that, you're playing with house money.
- By year 8, paydown + projected appreciation supports a ~$33k cash-out refi (75% LTV) — recoverable capital for the next deal without selling this one.
Negotiation context
- It's been on market 149 days — a 12% lower offer ($66k) is reasonable based on typical stale-listing flexibility.
Risks & watch-outs
- Climate carrying-cost: major wildfire risk; extreme-heat days projected 7→19/yr by 2055 (HVAC capex compounding) — expect insurance premiums to compound above CPI over the hold.
Questions for the listing agent
- It's been on market 149 days. Have you received any prior offers? Is the seller open to a 12% concession, seller financing, or rate buy-down credit?
- Built in 1970 — when were the roof, HVAC, electrical panel, plumbing, and water heater last replaced?
- Why hasn't it sold? Are there any deal-killer items the seller is aware of (foundation, flood, title, zoning, code violations)?
- Is there a deadline driving the sale (1031 exchange, divorce, estate, relocation)? That informs how much negotiation room exists.
- Schools are D-rated, which usually means shorter tenancies and higher turnover. Who's the typical renter profile here, and what's been the actual vacancy rate?
- What's the average days-on-market for RENTAL listings here right now (not sales)? A rising rental-DOM trend means longer vacancies and softer asking-rent achievability than the comps imply.
- What's the recent tenant-quality profile in this submarket — average credit score on applications, eviction rate, late-payment / NSF rate, and stable-employment percentage? A property-management company in the area should have these aggregated.
- How much new for-sale + rental construction is in the pipeline within 1–3 miles? Heavy new supply typically softens prices + rents 12–24 months out; constrained supply supports both.
Investment metrics
- 1% rule
- 1.69% ✓
- Cap rate
- 13.68%
- Cash-on-cash
- 26.40%
- DSCR
- 2.17
- GRM
- 4.9
CMA / ARV
- ARV (on-the-fly)
- $98,464
- Comps found
- 4
Show comp detail 4 sales within ~0.75 mi
| Address | Dist | Beds/Ba | Sqft | Sold | Price | $/sf | Match |
|---|---|---|---|---|---|---|---|
| 423 Avenue L | 0.13mi | 3/2.0 (-1) | 1,400 (-3%) | 3mo | $95,000 | $68 | 81 |
| 502 Avenue K | 0.24mi | 3/1.0 (-1) | 1,410 (-3%) | 9mo | $80,000 | $57 | 68 |
| 323 Ave J | 0.26mi | 3/2.0 (-1) | 1,652 (+14%) | 1mo | $127,500 | $77 | 59 |
| 815 Avenue F | 0.63mi | 3/2.0 (-1) | 1,480 (+2%) | 14mo | $70,070 | $47 | 50 |
Match score weights: distance 35% · size 25% · config 20% · recency 20%. Top-matched comps best support the ARV.
Projected returns pro-forma
5.16% appreciation · 3.0% rent growth · sell at horizon
- IRR
- 36.2%
- Equity multiple
- 3.26×
- Total profit
- $47,415
- Equity at exit
- $43,217
- IRR
- 34.4%
- Equity multiple
- 6.60×
- Total profit
- $117,658
- Equity at exit
- $75,186
Cash invested: $21,000 (down + closing). Projections, not guarantees.
Landlord ↔ Tenant lean methodology
- Overall (STATE)
- 83 Strongly Landlord-Friendly
- State Oklahoma
- 83 Strongly Landlord-Friendly · R+20
- County
- — inherits STATE
- City
- — inherits STATE
ZIP-level market 73932
- Home prices YoY
- 4.0%
- Active inventory
- 15
- Price-to-rent
- 4.9×
Monthly cashflow live
- Estimated rent
- $1,264 medium interval (Pro) →
- Mortgage (P&I)
- −$393
- Tax from tax record
- −$112 /mo · $1,342/yr
- Insurance
- −$31
- HOA
- −$0
- Vacancy / Maint / Mgmt
- −$265
- Net cashflow
- $462
Break-even live
UW: 25.0% down · 7.5% · 30yr · 1.5% tax · 5.0% vac · 8.0% maint · 8.0% mgmt
Financing live
Cash to close
- Down payment
- $18,750
- Closing costs
- $2,250
- Reserves months
- —
- Total cash needed
- —
Loan-product check · same deal, 3 products live
Conventional
25% down · 7.5% · 30yr
- Down + closing
- —
- Monthly P&I
- —
- Monthly cashflow
- —
- DSCR
- —
- Eligible?
- —
Personal DTI + credit; lowest rate.
DSCR
20% down · 8.5% · 30yr
- Down + closing
- —
- Monthly P&I
- —
- Monthly cashflow
- —
- DSCR
- —
- Eligible?
- —
No personal income docs; deal must DSCR.
Hard money
10% down · 12.0% · 12mo
- Down + closing
- —
- Monthly P&I
- —
- Monthly cashflow
- —
- DSCR
- —
- Eligible?
- —
Short-term bridge; refi at stabilization.
Listing history 20 events
-
2026-06-18days on market $75,000 Active 149 DOM
-
2026-06-17days on market $75,000 Active 148 DOM
-
2026-06-16days on market $75,000 Active 147 DOM
-
2026-06-15days on market $75,000 Active 146 DOM
-
2026-06-13days on market $75,000 Active 144 DOM
-
2026-06-12days on market $75,000 Active 143 DOM
-
2026-06-09days on market $75,000 Active 140 DOM
-
2026-06-08days on market $75,000 Active 139 DOM
-
2026-06-08days on market $75,000 Active 138 DOM
-
2026-06-05days on market $75,000 Active 136 DOM
-
2026-06-04days on market $75,000 Active 134 DOM
-
2026-06-02days on market $75,000 Active 133 DOM
-
2026-06-01days on market $75,000 Active 132 DOM
-
2026-05-31days on market $75,000 Active 131 DOM
-
2026-05-12price $75,000
-
2026-03-13price $85,000
-
2026-01-15$95,000 Active
-
2018-07-24soldstatus $144,100
-
2011-09-10soldstatus $160,000
-
1998-08-29soldstatus $112,000
ⓘ Source: listings_history table (triggers on properties + properties_extension) + one-shot
backfill from property_details.listing_events for pre-trigger history.
Tax reassessment forecast OK · Resets to sale price
- Current annual tax
- $1,342 · $112/mo
- Projected year-2 tax
- $1,342 · $112/mo
- Expected delta
- $0/yr ($0/mo · 0.0%)
ⓘ Screening estimate from a state-policy table — verify with the county assessor before closing.
Climate risk First Street
- Flood 1/10 Low 0% chance over 30 yrs
- Wildfire 7/10 Severe
- Heat 5/10 Major 7 d/yr ≥103°F today · 19 d/yr by 30 yrs out
- Wind 2/10 Low
- Air quality 2/10 Low 0 unhealthy d/yr today · 1 by 30 yrs out
Nearby sold comps map
Loading sold comps map…
Walkable amenities ~0.75 mi
Loading nearby amenities…
Taxation est. · year 1
- Rental income
- $15,165
- − Mortgage interest
- −$4,201
- − Property taxes
- −$1,342
- − Insurance
- −$375
- − Repairs & maintenance
- −$1,213
- − Management
- −$1,213
- − Depreciation
- −$2,182
- Taxable income
- $4,639
- Est. tax owed @ 24.0%
- −$1,113
- After-tax cash flow
- $4,431/yr
For passive investors: Depreciation is non-cash, so a rental often shows a tax loss while cash-flowing — sheltering income. Rental losses are passive: they offset passive income freely, and up to $25,000/yr can offset ordinary (W-2) income if you actively participate and your MAGI is under $100k (phasing out to $0 by $150k); unused losses carry forward. On sale, claimed depreciation is recaptured at up to 25%, and gains may owe capital-gains tax (a 1031 exchange can defer both). Figures are a year-1 estimate at your 24.0% rate — not tax advice; consult a CPA.
Schools (NCES district)
- District
- Beaver
- NCES district ID
- 4003750
- Math proficiency
- 30% ▬ 0.00%
- Reading proficiency
- 35% ▬ 0.00%
- Median HH income
- $46,714
- Composite
- 30.68/100
- National rank
- #11435
- State rank
- #214 of 513 in OK
Livability — Beaver
- Score
- 66/100
- State rank
- #126
- US rank
- #12291
Category grades
Schools grade is shown separately in the Schools card above.
Census & demographics
- Census place
- Beaver, OK
- Population (ZIP)
- 1,930
Population outlook (Beaver County) Hauer SSP2
- Today (2025)
- 5,381 people
- By 2030
- 5,465 · +1.6%
- By 2040
- 5,336 · -0.8%
- By 2050
- 5,561 · +3.3%
- By 2075
- 7,051 · +31.0%
- By 2100
- 9,341 · +73.6%
Race, ethnicity, and origin ACS 2023
- Neighborhood character
- Predominantly White (68%)
- Race & ethnicity
- White 68% Hispanic / Latino 28% Two or more races 11%
- Hispanic origin (detail)
- Mexican 28%
- Common ancestry
- Iranian 1%
- Foreign-born
- 13% · Canada
- Languages at home
- 75% English-only · Spanish 24%
Political lean MEDSL · Beaver
- 2024 margin
- Solid R (+83.8) · D 7.4% · R 91.2% · Other 1.3%
- 2008→2024 swing
- -5.3pp toward R · 2008: -78.5pp · 2024: -83.8pp
- All cycles
- 2024: R+83.8 2020: R+81.6 2016: R+81.0 2012: R+78.9 2008: R+78.5
Not yet ingested
- Civics
- —
Market trends
- HPI YoY
- ▲ 5.16%
- Current HPI
- 135.2376
- Rent YoY
- —
- Metro
- —
- State GDP YoY
- ▲ 1.55%
- F500 in state
- 6
Industry mix (Fortune 500 HQ in OK)
| Industry | F500 HQs | Revenue |
|---|---|---|
| Energy | 3 | $48B |
|
||
Price history
-33.0% since first listed6 events — show timeline
- 2026-05-12 Price Changed $75,000 MLSOK
- 2026-03-13 Price Changed $85,000 MLSOK
- 2026-01-15 Listed $95,000 MLSOK
- 2018-07-24 Sold (Public Records) $144,100 Public Records
- 2011-09-10 Sold (Public Records) $160,000 Public Records
- 1998-08-29 Sold (Public Records) $112,000 Public Records
Property tax history
+7.9%/yrLatest (2025): $1,342 · +1.4% YoY. Source: county tax records.
Cash-flow waterfall
monthlySold comps — $/sqft
last 12 mo · ≤1 miLoading sold comps…