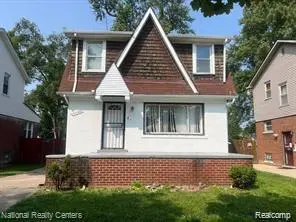
12945 Forrer St · Detroit, MI
Flood risk 4/10 · Minor
- FEMA flood zone
- X (unshaded)
- Chance of flooding over 30 yrs
- 0.22%
- Est. flood insurance / yr
- $473 – $860
Fire risk 1/10 · Minimal
- Est. fire insurance / yr
- $784 – $1,456
Heat risk 3/10 · Minor
- Hot days now (above 98°F)
- 7 days/yr
- Hot days in 30 yrs
- 15 days/yr
Wind risk 2/10 · Minimal
- Chance of severe wind over 30 yrs
- —
Air-quality risk 3/10 · Minor
- Unhealthy air days now
- 2 days/yr
- Unhealthy air days in 30 yrs
- 5 days/yr
Risk factors via First Street. Map © Google.
Why this score? — see what drove the F grade
The composite is a weighted blend of 9 inputs, each scored 0–100. Each bar is that input's sub-score; the figure is the points it added to the 100-point composite (weight × sub-score).
- ARV discount +7.5/15.0
- Cash flow +6.2/30.0
- 1% rule +4.0/10.0
- Rent growth +3.9/5.0
- Livability +3.7/5.0
- Condition / age +2.5/5.0
- Schools +1.3/10.0
- DSCR +0.5/10.0
- Appreciation +0.0/10.0
$149,500
🖨 Deal sheet (PDF) 📄 Offer letter ✓ Due diligence
Listing remarks MLS
Charming brick Colonial featuring 3 spacious bedrooms, 1 full bath and half bath, and a comfortable layout with classic character. Full unfinished basement offers room to expand. Large backyard ideal for outdoor enjoyment. Convenient location near schools, shopping, and major freeways. Currently leased at $1,300/month - great for investors or future homeowners looking to offset costs. Down payment assistance up to $20,000+ DO NOT DISTURB TENANT. BATVAI.
Key facts
- Large backyard
- Convenient location
- Brick colonial
Tags
Property features AI
Exterior
- Parking: No garage
- Utilities: Public water; Sewer available
- Home design: Single-family residence; One and one-half stories; Ground-level entry
- Construction: Built with aluminum siding, block, brick, brick veneer and wood siding; Brick/mortar foundation
- Exterior features: Paved road access; Lot approximately 0.11 acres (40 x 129); No pool
Interior
- Bathrooms: 1 full bathroom; 1 half bathroom
- Heating & cooling: Heating: Baseboard, Electric, Forced Air, Natural Gas; No cooling
- Interior features: Unfinished basement; 6 total rooms
Neighborhood map
What this means for you Summary
Snapshot
- This is a 3-bed/1.0-bath single-family listed at $150k.
Deal economics
- At list price, monthly cash flow is $-276 ($-3k/yr) — negative.
- To cash-flow at today's rent, offer at most $117k (21.5% below list).
- To meet the 1% rule (rent ≥ 1% of price), the offer needs to be $134k (10.3% below list).
- Recommended offer: $117k (21.5% below list) — sets the bar for cash-flow.
- Cap rate 4.1% vs local median 10.0% in Detroit — below-typical yield; the buyer is paying a premium for something (appreciation thesis, condition, location) that the cap rate doesn't capture.
Location & tenants
- Location reads 73/100 on livability (#218 in MI) — a middle-class / working-renter tenant base. Strengths: amenities A+, commute A+, cost of living A+; Watch: schools F, crime F, employment F.
- Detroit Public Schools Community District (urban): math 10% / reading 24% proficiency, ranked #499 of 540 in MI (top 92%) — low school quality limits family demand, transient renter base, plan for 1-2y turnover; 90% free/reduced lunch — lower-income household profile, screen leases tightly.
- Market conditions: Rents rising fast (+5.6%/yr); 392 active listings in the ZIP; 40 comparable units currently listed for rent nearby; rentals at typical pace (median 24d on market — plan ~3-4 weeks tenant-placement turnaround); 40% of comp listings sitting > 30 days — soft ceiling on asking rent; lower-income renter base — watch delinquency; 2,639 units permitted in Wayne County in 2024 (1,216 in 5+ unit buildings).
- This rent runs 44% of the median local income ($37k/yr) — at the standard rent-burdened threshold; future hikes will face affordability resistance.
Forward outlook
- Local home prices are declining (-3.0%/yr); year-one equity from $1k of loan paydown is wiped out by about $4k of value loss. Plan a longer hold.
- Wayne County population projected at -17% by 2050 — secular population decline; favor cash flow + early exit over multi-decade hold.
Negotiation context
- Only 3 days on market — expect competitive offers; lowballing is unlikely to land.
- 19 sale attempts since 21y ago with the ask held roughly flat each time — persistent listings suggest the price (not the market) is what's stuck; bring a comps-based counter.
- Current owner paid $16k; list at $150k implies a 829% gain — meaningful room to come down on a strong offer.
Risks & watch-outs
- Watch-outs: property tax is 3.9% of price; built in 1928 — expect roof / HVAC / electrical / plumbing capex.
Questions for the listing agent
- What do current leases actually rent for vs. the listed asking? Can we see a recent rent roll and the last 12 months of T-12 income?
- Built in 1928 — when were the roof, HVAC, electrical panel, plumbing, and water heater last replaced?
- Property tax is high relative to price — has the assessment been appealed recently, and will the sale trigger a re-assessment?
- Is there a deadline driving the sale (1031 exchange, divorce, estate, relocation)? That informs how much negotiation room exists.
- Schools are F-rated, which usually means shorter tenancies and higher turnover. Who's the typical renter profile here, and what's been the actual vacancy rate?
- Crime grade is F in this area — have there been break-ins, vandalism, or insurance claims at this property in the last 3 years? What carrier currently insures it and at what premium?
- The area grade is low — what's the realistic commute time and amenity access for the typical tenant pool here? Any planned neighborhood developments (good or bad) we should know about?
- What's the average days-on-market for RENTAL listings here right now (not sales)? A rising rental-DOM trend means longer vacancies and softer asking-rent achievability than the comps imply.
- What's the recent tenant-quality profile in this submarket — average credit score on applications, eviction rate, late-payment / NSF rate, and stable-employment percentage? A property-management company in the area should have these aggregated.
- How much new for-sale + rental construction is in the pipeline within 1–3 miles? Heavy new supply typically softens prices + rents 12–24 months out; constrained supply supports both.
Investment metrics
- 1% rule
- 0.90% ✗
- Cap rate
- 4.08%
- Cash-on-cash
- -7.90%
- DSCR
- 0.65
- GRM
- 9.3
CMA / ARV
- ARV (on-the-fly)
- $75,544
- Comps found
- 12
Show comp detail 12 sales within ~0.75 mi
| Address | Dist | Beds/Ba | Sqft | Sold | Price | $/sf | Match |
|---|---|---|---|---|---|---|---|
| 13599 Winthrop St | 0.17mi | 3/1.5 | 1,089 (+2%) | 2mo | $145,000 | $133 | 84 |
| 12699 Woodmont Ave | 0.42mi | 3/1.0 | 1,054 (-1%) | 1mo | $64,000 | $61 | 78 |
| 13620 Saint Marys St | 0.21mi | 3/2.0 | 1,020 (-4%) | 2mo | $72,000 | $71 | 78 |
| 13364 Coyle St | 0.45mi | 3/1.0 | 1,083 (+2%) | 2mo | $95,000 | $88 | 74 |
| 13215 Prest St | 0.25mi | 3/1.0 | 1,160 (+9%) | 1mo | $100,000 | $86 | 73 |
| 12660 Grandmont Ave | 0.47mi | 3/1.0 | 1,019 (-4%) | 1mo | $85,000 | $83 | 70 |
| 13209 Terry St | 0.53mi | 3/1.5 | 1,044 (-2%) | 2mo | $54,500 | $52 | 69 |
| 12057 Forrer St | 0.61mi | 3/1.0 | 1,000 (-6%) | 1mo | $45,000 | $45 | 61 |
| 13900 Sussex St | 0.43mi | 3/1.0 | 971 (-9%) | 6mo | $40,000 | $41 | 60 |
| 12832 Terry St | 0.56mi | 3/1.0 | 981 (-8%) | 4mo | $40,000 | $41 | 57 |
| 12094 Asbury Park | 0.64mi | 3/1.0 | 1,156 (+9%) | 6mo | $61,000 | $53 | 50 |
| 12124 Asbury Park | 0.61mi | 3/1.5 | 919 (-14%) | 2mo | $130,000 | $141 | 45 |
Match score weights: distance 35% · size 25% · config 20% · recency 20%. Top-matched comps best support the ARV.
Projected returns pro-forma
-3.0% appreciation · 5.59% rent growth · sell at horizon
- IRR
- -26.1%
- Equity multiple
- 0.09×
- Total profit
- $-37,992
- Equity at exit
- $22,291
- IRR
- -14.2%
- Equity multiple
- 0.06×
- Total profit
- $-39,340
- Equity at exit
- $12,926
Cash invested: $41,860 (down + closing). Projections, not guarantees.
Landlord ↔ Tenant lean methodology
- Overall (STATE)
- 62 Landlord-Friendly
- State Michigan
- 62 Landlord-Friendly · EVEN
- County
- — inherits STATE
- City
- — inherits STATE
ZIP-level market 48227
- Rents YoY
- 5.6%
- Active inventory
- 392
- Price-to-rent
- 9.3×
Monthly cashflow live
- Estimated rent
- $1,341 high interval (Pro) →
- Mortgage (P&I)
- −$784
- Tax from tax record
- −$489 /mo · $5,867/yr
- Insurance
- −$62
- HOA
- −$0
- Vacancy / Maint / Mgmt
- −$282
- Net cashflow
- $-276
Break-even live
Sensitivity live
| Price | -10% $-191 | -5% $-233 | +0% $-276 | +5% $-318 | +10% $-360 |
|---|---|---|---|---|---|
| Rent | -10% $-382 | -5% $-329 | +0% $-276 | +5% $-223 | +10% $-170 |
| Rate | -1.0pp $-200 | -0.5pp $-238 | base $-276 | +0.5pp $-314 | +1.0pp $-354 |
UW: 25.0% down · 7.5% · 30yr · 1.5% tax · 5.0% vac · 8.0% maint · 8.0% mgmt
Financing live
Cash to close
- Down payment
- $37,375
- Closing costs
- $4,485
- Reserves months
- —
- Total cash needed
- —
Loan-product check · same deal, 3 products live
Conventional
25% down · 7.5% · 30yr
- Down + closing
- —
- Monthly P&I
- —
- Monthly cashflow
- —
- DSCR
- —
- Eligible?
- —
Personal DTI + credit; lowest rate.
DSCR
20% down · 8.5% · 30yr
- Down + closing
- —
- Monthly P&I
- —
- Monthly cashflow
- —
- DSCR
- —
- Eligible?
- —
No personal income docs; deal must DSCR.
Hard money
10% down · 12.0% · 12mo
- Down + closing
- —
- Monthly P&I
- —
- Monthly cashflow
- —
- DSCR
- —
- Eligible?
- —
Short-term bridge; refi at stabilization.
Rent comps 40 comps
| Address | Beds | Baths | Sqft | Rent | $/sqft | DOM | Units | Dist |
|---|---|---|---|---|---|---|---|---|
| 12840 Grandmont Ave Detroit, MI | 3.0 | 1.0 | 1100 | $1,200 | $1.09 | 45d | 1 | 0.40mi |
| 13279 Coyle St Detroit, MI | 3.0 | 1.0 | 1444 | $1,373 | $0.95 | 45d | 1 | 0.42mi |
| 12711 Grandmont Ave Detroit, MI | 3.0 | 1.0 | 1000 | $1,400 | $1.40 | 19d | 1 | 0.46mi |
| 12121 Montrose St Detroit, MI | 3.0 | 1.0 | 874 | $1,373 | $1.57 | 23d | 1 | 0.53mi |
| 14104 Coyle St Detroit, MI | 3.0 | 1.0 | 1327 | $1,350 | $1.02 | 6d | 1 | 0.58mi |
| 12754 Marlowe St Detroit, MI | 3.0 | 2.0 | 1008 | $1,400 | $1.39 | 18d | 1 | 0.68mi |
| 14264 Coyle St Detroit, MI | 2.0 | 1.0 | 1000 | $1,150 | $1.15 | 45d | 1 | 0.70mi |
| 14504 Saint Marys St Detroit, MI | 4.0 | 1.0 | 1362 | $1,473 | $1.08 | 45d | 1 | 0.74mi |
| 13331 Strathmoor St Detroit, MI | 3.0 | 1.0 | 1084 | $1,100 | $1.01 | 18d | 1 | 0.75mi |
| 11641 Mansfield St Unit 2 Detroit, MI | 3.0 | 1.0 | 1449 | $1,300 | $0.90 | 45d | 1 | 0.75mi |
| 14615 Winthrop St Detroit, MI | 2.0 | 1.0 | 1217 | $1,300 | $1.07 | 18d | 1 | 0.76mi |
| 14580 Forrer St Unit Unit Detroit, MI | 2.0 | 1.0 | 1300 | $900 | $0.69 | 21d | 1 | 0.76mi |
| 13600 Southfield Fwy Detroit, MI | 2.0 | 1.0 | 848 | $1,100 | $1.30 | 6d | 1 | 0.78mi |
| 14535 Mettetal St Unit 1 Detroit, MI | 2.0 | 1.0 | 965 | $1,000 | $1.04 | 45d | 1 | 0.79mi |
| 14375 Terry St Detroit, MI | 3.0 | 2.0 | 1300 | $1,425 | $1.10 | 45d | 1 | 0.83mi |
| 12014 Terry St Detroit, MI | 2.0 | 1.0 | 1361 | $1,200 | $0.88 | 45d | 1 | 0.83mi |
| 12039 Lauder St Detroit, MI | 3.0 | 1.5 | 1000 | $1,500 | $1.50 | 26d | 1 | 0.84mi |
| 11634 Sussex St Detroit, MI | 3.0 | 1.0 | 1091 | $1,326 | $1.22 | 26d | 1 | 0.84mi |
| 12944 Rosemont Ave Detroit, MI | 2.0 | 1.0 | 800 | $1,050 | $1.31 | 6d | 1 | 0.89mi |
| 11393 Prest St Detroit, MI | 3.0 | 1.0 | 900 | $1,550 | $1.72 | 18d | 1 | 0.90mi |
| 11397 Whitcomb St Detroit, MI | 3.0 | 1.0 | 1070 | $1,400 | $1.31 | 18d | 1 | 0.91mi |
| 14836 Rutherford St Unit 2 Detroit, MI | 2.0 | 1.0 | 1104 | $950 | $0.86 | 45d | 1 | 0.91mi |
| 14753 Saint Marys St Detroit, MI | 2.0 | 1.0 | 900 | $1,150 | $1.28 | 14d | 1 | 0.92mi |
| 14753 Saint Marys St Detroit, MI | 2.0 | 1.0 | 900 | $1,150 | $1.28 | 6d | 1 | 0.92mi |
| 11345 Greenfield Rd Detroit, MI | 2.0 | 1.0 | 700 | $1,050 | $1.50 | 14d | 1 | 0.93mi |
| 12941 Penrod St Detroit, MI | 2.0 | 1.0 | 1000 | $1,275 | $1.27 | 45d | 1 | 0.98mi |
| 14814 Sussex St Unit 2 Detroit, MI | 3.0 | 1.0 | 1100 | $1,000 | $0.91 | 45d | 1 | 0.98mi |
| 13581 Penrod St Detroit, MI | 4.0 | 1.0 | 1152 | $1,200 | $1.04 | 45d | 1 | 0.99mi |
| 14893 Prest St Detroit, MI | 3.0 | 1.0 | 1100 | $1,000 | $0.91 | 16d | 1 | 1.00mi |
| 16014 Hackett St Detroit, MI | 4.0 | 2.0 | 1142 | $1,500 | $1.31 | 45d | 1 | 1.00mi |
| 11431 Marlowe St Detroit, MI | 3.0 | 1.0 | 1172 | $1,400 | $1.19 | 18d | 1 | 1.04mi |
| 12875 Faust Ave Detroit, MI | 2.0 | 1.0 | 735 | $1,200 | $1.63 | 6d | 1 | 1.05mi |
| 9973 Winthrop St Detroit, MI | 3.0 | 1.0 | 960 | $1,400 | $1.46 | 45d | 1 | 1.05mi |
| 13591 Faust Ave Detroit, MI | 2.0 | 1.0 | 1000 | $1,275 | $1.27 | 45d | 1 | 1.06mi |
| 14559 Strathmoor St Detroit, MI | 2.0 | 1.0 | 1033 | $1,150 | $1.11 | 22d | 1 | 1.08mi |
| 9936 Montrose St Detroit, MI | 3.0 | 1.0 | 963 | $1,200 | $1.25 | 18d | 1 | 1.08mi |
| 10030 Abington Ave Detroit, MI | 4.0 | 2.0 | 1350 | $1,475 | $1.09 | 12d | 1 | 1.09mi |
| 10015 Robson St Detroit, MI | 3.0 | 2.0 | 1000 | $1,400 | $1.40 | 19d | 1 | 1.11mi |
| 14600 Strathmoor St Detroit, MI | 4.0 | 1.0 | 1300 | $1,450 | $1.12 | 45d | 1 | 1.12mi |
| 12950 Glastonbury Ave Detroit, MI | 3.0 | 1.0 | 1000 | $1,400 | $1.40 | 26d | 1 | 1.14mi |
Listing history 3 events
-
2026-06-21days on market $149,500 Active 3 DOM
-
2026-06-18remarks 455-char remark
Show marketing remark (457 chars)
Charming brick Colonial featuring 3 spacious bedrooms, 1 full bath and half bath, and a comfortable layout with classic character. Full unfinished basement offers room to expand. Large backyard ideal for outdoor enjoyment. Convenient location near schools, shopping, and major freeways. Currently leased at $1,300/month - great for investors or future homeowners looking to offset costs. Down payment assistance up to $20,000+ DO NOT DISTURB TENANT. BATVAI.
-
2026-06-18$149,500 Active 1 DOM
Show marketing remark (457 chars)
Charming brick Colonial featuring 3 spacious bedrooms, 1 full bath and half bath, and a comfortable layout with classic character. Full unfinished basement offers room to expand. Large backyard ideal for outdoor enjoyment. Convenient location near schools, shopping, and major freeways. Currently leased at $1,300/month - great for investors or future homeowners looking to offset costs. Down payment assistance up to $20,000+ DO NOT DISTURB TENANT. BATVAI.
ⓘ Source: listings_history table (triggers on properties + properties_extension) + one-shot
backfill from property_details.listing_events for pre-trigger history.
Tax reassessment forecast MI · Partial reset (capped growth)
- Current annual tax
- $5,867 · $489/mo
- Projected year-2 tax
- $5,867 · $489/mo
- Expected delta
- $0/yr ($0/mo · 0.0%)
ⓘ Screening estimate from a state-policy table — verify with the county assessor before closing.
Climate risk First Street
- Flood 4/10 Moderate FEMA zone X (unshaded) · 22% chance over 30 yrs
- Wildfire 1/10 Low
- Heat 3/10 Moderate 7 d/yr ≥98°F today · 15 d/yr by 30 yrs out
- Wind 2/10 Low
- Air quality 3/10 Moderate 2 unhealthy d/yr today · 5 by 30 yrs out
Nearby sold comps map
Loading sold comps map…
Walkable amenities ~0.75 mi
Loading nearby amenities…
Taxation est. · year 1
- Rental income
- $16,094
- − Mortgage interest
- −$8,374
- − Property taxes
- −$5,867
- − Insurance
- −$748
- − Repairs & maintenance
- −$1,288
- − Management
- −$1,288
- − Depreciation
- −$4,349
- Taxable loss
- −$5,819
- Est. tax savings @ 24.0%
- +$1,397
- After-tax cash flow
- $-1,912/yr
For passive investors: Depreciation is non-cash, so a rental often shows a tax loss while cash-flowing — sheltering income. Rental losses are passive: they offset passive income freely, and up to $25,000/yr can offset ordinary (W-2) income if you actively participate and your MAGI is under $100k (phasing out to $0 by $150k); unused losses carry forward. On sale, claimed depreciation is recaptured at up to 25%, and gains may owe capital-gains tax (a 1031 exchange can defer both). Figures are a year-1 estimate at your 24.0% rate — not tax advice; consult a CPA.
Schools (NCES district)
- District
- Detroit Public Schools Community District
- NCES district ID
- 2601103
- Math proficiency
- 10% ▼ -2.00%
- Reading proficiency
- 24% ▲ 6.00%
- Median HH income
- $25,815
- Composite
- 13.06/100
- National rank
- #9564
- State rank
- #499 of 540 in MI
Livability — Detroit
- Score
- 73/100
- State rank
- #218
- US rank
- #5427
Category grades
Schools grade is shown separately in the Schools card above.
Census & demographics
- Census place
- Detroit, MI
- County
- Wayne County · 1,562,939 people
- City population
- 572,865
- Metro
- Detroit-Warren-Dearborn, MI
- Population (ZIP)
- 40,302
- Household income
- $36,527
- Rent vs Own
- Severe rent burden
- 2371.0
Population outlook (Wayne County) Hauer SSP2
- Today (2025)
- 1,675,273 people
- By 2030
- 1,620,300 · -3.3%
- By 2040
- 1,502,341 · -10.3%
- By 2050
- 1,384,039 · -17.4%
- By 2075
- 1,124,592 · -32.9%
- By 2100
- 881,193 · -47.4%
Race, ethnicity, and origin ACS 2023
- Neighborhood character
- Predominantly Black (95%)
- Race & ethnicity
- Black 95% Two or more races 3% White 1%
- Foreign-born
- 1%
- Languages at home
- 98% English-only · Spanish 1% French/Haitian/Cajun 1%
Political lean MEDSL · Wayne
- 2024 margin
- Strong D (+29.0) · D 62.7% · R 33.7% · Other 3.6%
- 2008→2024 swing
- -20.5pp toward R · 2008: 49.5pp · 2024: 29.0pp
- All cycles
- 2024: D+29.0 2020: D+38.1 2016: D+37.3 2012: D+46.9 2008: D+49.5
Not yet ingested
- Civics
- —
Market trends
- HPI YoY
- ▼ -125.00%
- Current HPI
- 186.4158
- Rent YoY
- ▲ 5.59%
- Metro
- Detroit-Warren-Dearborn, MI
- State GDP YoY
- ▲ 1.37%
- F500 in state
- 28
Industry mix (Fortune 500 HQ in MI)
| Industry | F500 HQs | Revenue |
|---|---|---|
| Automotive Parts | 3 | $48B |
|
||
| Automotive | 2 | $372B |
|
||
| Chemicals | 1 | $45B |
|
||
| Automotive Retail | 1 | $29B |
|
||
| Healthcare / Medical Devices | 1 | $23B |
|
||
| Automotive Technology | 1 | $20B |
|
||
Price history
+36.3% since first listed46 events — show timeline
- 2026-06-18 Listed $149,500 REALCOMP
- 2026-06-18 Listed $149,500 MiRealSource-MiMLS
- 2026-05-01 Listing Removed — MiRealSource-MiMLS
- 2026-03-19 Relisted — REALCOMP
- 2026-03-06 Relisted — MiRealSource-MiMLS
- 2025-09-10 Pending — MiRealSource-MiMLS
- 2025-09-10 Pending — REALCOMP
- 2025-09-10 Listing Removed — REALCOMP
- 2025-07-08 Price Changed $137,500 MiRealSource-MiMLS
- 2025-07-08 Price Changed $137,500 REALCOMP
- 2025-05-16 Price Changed $137,999 MiRealSource-MiMLS
- 2025-05-15 Price Changed $137,999 REALCOMP
- 2025-05-15 Price Changed $136,999 REALCOMP
- 2025-04-29 Listed $139,000 REALCOMP
- 2025-04-29 Listed $139,000 MiRealSource-MiMLS
- 2025-04-09 Listing Removed — REALCOMP
- 2025-04-09 Listing Removed — MiRealSource-MiMLS
- 2025-01-10 Price Changed $140,000 MiRealSource-MiMLS
- 2025-01-10 Price Changed $140,000 REALCOMP
- 2024-11-23 Relisted — MiRealSource-MiMLS
- 2024-11-23 Relisted — REALCOMP
- 2024-11-11 Listing Removed — REALCOMP
- 2024-11-11 Listing Removed — MiRealSource-MiMLS
- 2024-11-01 Listed $145,000 REALCOMP
- 2024-11-01 Listed $145,000 MiRealSource-MiMLS
- 2024-10-18 Listing Removed — MiRealSource-MiMLS
- 2024-10-18 Listing Removed — REALCOMP
- 2024-10-11 Price Changed $139,000 MiRealSource-MiMLS
- 2024-10-10 Price Changed $139,000 REALCOMP
- 2024-09-03 Listed $149,000 MiRealSource-MiMLS
- 2024-09-03 Listed $149,000 REALCOMP
- 2018-11-02 Listing Removed — REALCOMP
- 2018-11-02 Listing Removed — MiRealSource-MiMLS
- 2018-10-18 Listed $25,900 MiRealSource-MiMLS
- 2018-10-18 Listed $25,900 REALCOMP
- 2015-07-20 Listing Removed — REALCOMP
- 2015-07-20 Sold (MLS) $16,100 MiRealSource-MiMLS
- 2015-07-20 Sold (MLS) $16,100 REALCOMP
- 2015-04-26 Listed $17,900 REALCOMP
- 2015-03-17 Listed $17,900 MiRealSource-MiMLS
- 2007-01-18 Listing Removed — REALCOMP
- 2007-01-18 Listing Removed — MiRealSource-MiMLS
- 2006-07-19 Listed $87,000 REALCOMP
- 2006-07-18 Listed $87,000 MiRealSource-MiMLS
- 2006-03-23 Listing Removed — REALCOMP
- 2005-12-23 Listed $109,700 REALCOMP
Property tax history
+30.3%/yrLatest (2025): $5,867 · +10.3% YoY. Source: county tax records.
Cash-flow waterfall
monthlySold comps — $/sqft
last 12 mo · ≤1 miLoading sold comps…