34385 Ratcliff Rd · Latham, MO
Flood risk 1/10 · Minimal
- FEMA flood zone
- X (unshaded)
- Chance of flooding over 30 yrs
- 0.0%
- Est. flood insurance / yr
- $507 – $1,088
Fire risk 4/10 · Minor
- Est. fire insurance / yr
- $1,054 – $1,958
Heat risk 4/10 · Minor
- Hot days now (above 107°F)
- 7 days/yr
- Hot days in 30 yrs
- 18 days/yr
Wind risk 2/10 · Minimal
- Chance of severe wind over 30 yrs
- 0.0%
Air-quality risk 2/10 · Minimal
- Unhealthy air days now
- 0 days/yr
- Unhealthy air days in 30 yrs
- 1 days/yr
Risk factors via First Street. Map © Google.
Why this score? — see what drove the D grade
The composite is a weighted blend of 9 inputs, each scored 0–100. Each bar is that input's sub-score; the figure is the points it added to the 100-point composite (weight × sub-score).
- Cash flow +14.3/30.0
- ARV discount +7.5/15.0
- DSCR +4.4/10.0
- Schools +4.1/10.0
- 1% rule +2.7/10.0
- Rent growth +2.5/5.0
- Livability +2.5/5.0
- Condition / age +2.5/5.0
- Appreciation +0.0/10.0
$145,000
🖨 Deal sheet (PDF) 📄 Offer letter ✓ Due diligence
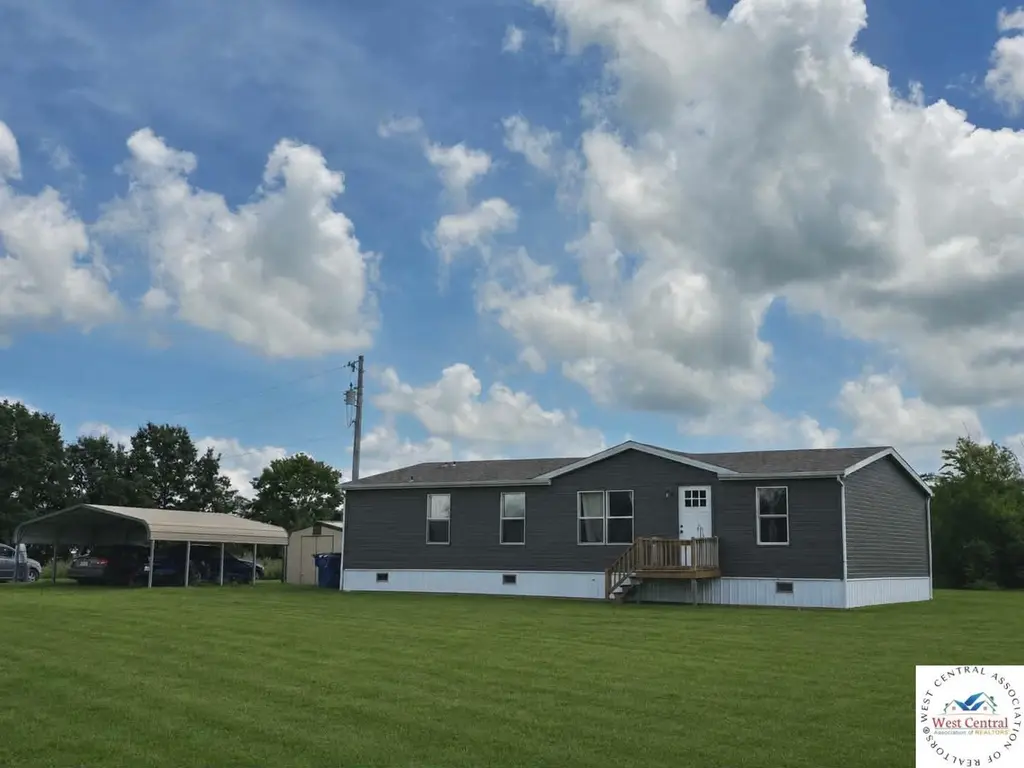
Listing remarks
Enjoy country living with this 3 bedroom, 2 bath manufactured home situated on 3 acres. This spacious home offers a comfortable layout with a large living area, functional kitchen and a private primary suite with its own private bathroom. Outside you'll find plenty of room for gardening, recreation, and pets or if you are looking for an investment property this one could be what you are looking for. All new siding and exterior front door.
Key facts
- Functional kitchen
- Large living area
- New siding
Tags
Property features AI
Exterior
- Parking: 2 covered parking spaces; 2-car garage; Carport
- Home design: Residential single-family home
- Exterior features: 3-acre lot; Directions: California - Hwy 87 South to Hwy F, follow to Hwy MM; from Hwy MM turn left on Ratcliff Rd. Property is the 2nd home
Interior
- Bedrooms: Double wide (park name)
- Bathrooms: 2 full bathrooms
- Interior features: Single-level living
Neighborhood map
What this means for you Summary
Snapshot
- This is a 3-bed/2.0-bath other listed at $145k.
Deal economics
- At list price, monthly cash flow is $27 ($324/yr) — positive.
- The deal already cash-flows at list — no discount required.
- To meet the 1% rule (rent ≥ 1% of price), the offer needs to be $111k (23.3% below list).
- Recommended offer: $111k (23.3% below list) — sets the bar for 1% rule.
Location & tenants
- Location reads: area grade D — affects rentability + tenant quality, not the cash-flow math above.
- Moniteau County R-V (rural): math 40% / reading 50% proficiency, ranked #178 of 535 in MO (top 33%) — families likely to look elsewhere, expect single-tenant / working-renter base with shorter leases.
- Zoned schools: Latham Elem. (math 30% / reading 50%, 27 students, 48% FRL) — zoned schools at 48% FRL track the district average.
- Market conditions: 43 active listings in the ZIP; 3 units permitted in Moniteau County in 2024 (0 in 5+ unit buildings).
Forward outlook
- Local home prices are declining (-3.0%/yr); year-one equity from $1k of loan paydown is wiped out by about $4k of value loss. Plan a longer hold.
Negotiation context
- It's been on market 15 days — a 2% lower offer ($143k) is reasonable based on typical stale-listing flexibility.
- 2 sale attempts since 16y ago with the ask held roughly flat each time — persistent listings suggest the price (not the market) is what's stuck; bring a comps-based counter.
Questions for the listing agent
- Is there a deadline driving the sale (1031 exchange, divorce, estate, relocation)? That informs how much negotiation room exists.
- The area grade is low — what's the realistic commute time and amenity access for the typical tenant pool here? Any planned neighborhood developments (good or bad) we should know about?
- What's the average days-on-market for RENTAL listings here right now (not sales)? A rising rental-DOM trend means longer vacancies and softer asking-rent achievability than the comps imply.
- What's the recent tenant-quality profile in this submarket — average credit score on applications, eviction rate, late-payment / NSF rate, and stable-employment percentage? A property-management company in the area should have these aggregated.
- How much new for-sale + rental construction is in the pipeline within 1–3 miles? Heavy new supply typically softens prices + rents 12–24 months out; constrained supply supports both.
Investment metrics
- 1% rule
- 0.77% ✗
- Cap rate
- 6.52%
- Cash-on-cash
- 0.80%
- DSCR
- 1.04
- GRM
- 10.9
CMA / ARV
No comps found within radius.
Projected returns pro-forma
-3.0% appreciation · 3.0% rent growth · sell at horizon
- IRR
- -15.1%
- Equity multiple
- 0.46×
- Total profit
- $-21,853
- Equity at exit
- $21,620
- IRR
- -6.6%
- Equity multiple
- 0.58×
- Total profit
- $-17,123
- Equity at exit
- $12,537
Cash invested: $40,600 (down + closing). Projections, not guarantees.
Landlord ↔ Tenant lean methodology
- Overall (STATE)
- 81 Strongly Landlord-Friendly
- State Missouri
- 81 Strongly Landlord-Friendly · R+10
- County
- — inherits STATE
- City
- — inherits STATE
ZIP-level market 65018
- Home prices YoY
- -26.1%
- Active inventory
- 43
- Price-to-rent
- 10.9×
Monthly cashflow live
- Estimated rent
- $1,113 medium interval (Pro) →
- Mortgage (P&I)
- −$760
- Tax from tax record
- −$31 /mo · $375/yr
- Insurance
- −$60
- HOA
- −$0
- Vacancy / Maint / Mgmt
- −$234
- Net cashflow
- $27
Break-even live
Sensitivity live
| Price | -10% $109 | -5% $68 | +0% $27 | +5% $-14 | +10% $-55 |
|---|---|---|---|---|---|
| Rent | -10% $-61 | -5% $-17 | +0% $27 | +5% $71 | +10% $115 |
| Rate | -1.0pp $100 | -0.5pp $64 | base $27 | +0.5pp $-11 | +1.0pp $-49 |
UW: 25.0% down · 7.5% · 30yr · 1.5% tax · 5.0% vac · 8.0% maint · 8.0% mgmt
Financing live
Cash to close
- Down payment
- $36,250
- Closing costs
- $4,350
- Reserves months
- —
- Total cash needed
- —
Loan-product check · same deal, 3 products live
Conventional
25% down · 7.5% · 30yr
- Down + closing
- —
- Monthly P&I
- —
- Monthly cashflow
- —
- DSCR
- —
- Eligible?
- —
Personal DTI + credit; lowest rate.
DSCR
20% down · 8.5% · 30yr
- Down + closing
- —
- Monthly P&I
- —
- Monthly cashflow
- —
- DSCR
- —
- Eligible?
- —
No personal income docs; deal must DSCR.
Hard money
10% down · 12.0% · 12mo
- Down + closing
- —
- Monthly P&I
- —
- Monthly cashflow
- —
- DSCR
- —
- Eligible?
- —
Short-term bridge; refi at stabilization.
Listing history 11 events
-
2026-06-12statusdays on market $145,000 Pending 15 DOM
-
2026-06-09days on market $145,000 Active 12 DOM
-
2026-06-08days on market $145,000 Active 11 DOM
-
2026-06-07days on market $145,000 Active 10 DOM
-
2026-06-05days on market $145,000 Active 8 DOM
-
2026-06-04days on market $145,000 Active 6 DOM
-
2026-06-02days on market $145,000 Active 5 DOM
-
2026-06-01days on market $145,000 Active 4 DOM
-
2026-05-31days on market $145,000 Active 3 DOM
-
2026-03-20$145,000 Active
-
2010-01-28$59,000
ⓘ Source: listings_history table (triggers on properties + properties_extension) + one-shot
backfill from property_details.listing_events for pre-trigger history.
Tax reassessment forecast MO · Resets to sale price
- Current annual tax
- $375 · $31/mo
- Projected year-2 tax
- $1,406 · $117/mo
- Expected delta
- +$1,031/yr (+$86/mo · 275.0%)
ⓘ Screening estimate from a state-policy table — verify with the county assessor before closing.
Climate risk First Street
- Flood 1/10 Low FEMA zone X (unshaded) · 0% chance over 30 yrs
- Wildfire 4/10 Moderate
- Heat 4/10 Moderate 7 d/yr ≥107°F today · 18 d/yr by 30 yrs out
- Wind 2/10 Low 0% chance of damaging wind over 30 yrs
- Air quality 2/10 Low 0 unhealthy d/yr today · 1 by 30 yrs out
Nearby sold comps map
Loading sold comps map…
Walkable amenities ~0.75 mi
Loading nearby amenities…
Taxation est. · year 1
- Rental income
- $13,353
- − Mortgage interest
- −$8,122
- − Property taxes
- −$375
- − Insurance
- −$725
- − Repairs & maintenance
- −$1,068
- − Management
- −$1,068
- − Depreciation
- −$4,218
- Taxable loss
- −$2,224
- Est. tax savings @ 24.0%
- +$534
- After-tax cash flow
- $858/yr
For passive investors: Depreciation is non-cash, so a rental often shows a tax loss while cash-flowing — sheltering income. Rental losses are passive: they offset passive income freely, and up to $25,000/yr can offset ordinary (W-2) income if you actively participate and your MAGI is under $100k (phasing out to $0 by $150k); unused losses carry forward. On sale, claimed depreciation is recaptured at up to 25%, and gains may owe capital-gains tax (a 1031 exchange can defer both). Figures are a year-1 estimate at your 24.0% rate — not tax advice; consult a CPA.
Schools (NCES district)
- District
- Moniteau County R-V
- NCES district ID
- 2921180
- Math proficiency
- 40% ▲ 10.00%
- Reading proficiency
- 50% ▬ 0.00%
- Median HH income
- $52,405
- Composite
- 41.07/100
- National rank
- #7446
- State rank
- #178 of 535 in MO
Livability — Latham
No livability data for this city. (Only ~50 U.S. cities are tracked.)
Census & demographics
- Population (ZIP)
- 7,811
Population outlook (Moniteau County) Hauer SSP2
- Today (2025)
- 16,265 people
- By 2030
- 16,309 · +0.3%
- By 2040
- 16,437 · +1.1%
- By 2050
- 16,475 · +1.3%
- By 2075
- 15,956 · -1.9%
- By 2100
- 14,142 · -13.1%
Race, ethnicity, and origin ACS 2023
- Neighborhood character
- Predominantly White (86%)
- Race & ethnicity
- White 86% Hispanic / Latino 10% Two or more races 6%
- Hispanic origin (detail)
- Mexican 9%
- Common ancestry
- Italian 4% Serbian 2% Lithuanian 2%
- Foreign-born
- 4% · Canada, Philippines
- Languages at home
- 90% English-only · Spanish 7% German/W. Germanic 2% Other Asian/Pacific 1%
Political lean MEDSL · Moniteau
- 2024 margin
- Solid R (+62.8) · D 18.1% · R 80.8% · Other 1.1%
- 2008→2024 swing
- -27.0pp toward R · 2008: -35.8pp · 2024: -62.8pp
- All cycles
- 2024: R+62.8 2020: R+62.0 2016: R+60.3 2012: R+48.0 2008: R+35.8
Not yet ingested
- Civics
- —
Market trends
- HPI YoY
- ▼ -75.63%
- Current HPI
- 214.3568
- Rent YoY
- —
- Metro
- —
- State GDP YoY
- ▲ 1.84%
- F500 in state
- 20
Industry mix (Fortune 500 HQ in MO)
| Industry | F500 HQs | Revenue |
|---|---|---|
| Healthcare | 1 | $163B |
|
||
| Insurance | 1 | $21B |
|
||
| Industrial Technology | 1 | $17B |
|
||
| Retail | 1 | $16B |
|
||
| Industrial Distribution | 1 | $10B |
|
||
| Utilities | 1 | $9B |
|
||
Price history
+145.8% since first listed2 events — show timeline
- 2026-03-20 Listed $145,000 WCAR
- 2010-01-28 Listed $59,000 JCMLS
Property tax history
+3.9%/yrLatest (2025): $375 · +0.9% YoY. Source: county tax records.
Cash-flow waterfall
monthlySold comps — $/sqft
last 12 mo · ≤1 miLoading sold comps…