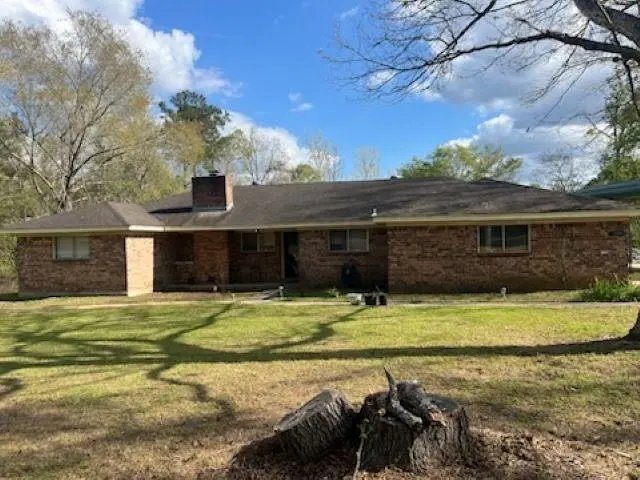
2889 W US Highway 190 · Jasper, TX
Flood risk 4/10 · Minor
- FEMA flood zone
- A
- Chance of flooding over 30 yrs
- 0.22%
- Est. flood insurance / yr
- $1,009 – $1,996
Fire risk 4/10 · Minor
- Est. fire insurance / yr
- $1,222 – $2,270
Heat risk 8/10 · Major
- Hot days now (above 111°F)
- 7 days/yr
- Hot days in 30 yrs
- 22 days/yr
Wind risk 8/10 · Major
- Chance of severe wind over 30 yrs
- 99.0%
Air-quality risk 1/10 · Minimal
- Unhealthy air days now
- 0 days/yr
- Unhealthy air days in 30 yrs
- 0 days/yr
Risk factors via First Street. Map © Google.
Why this score? — see what drove the B grade
The composite is a weighted blend of 9 inputs, each scored 0–100. Each bar is that input's sub-score; the figure is the points it added to the 100-point composite (weight × sub-score).
- Cash flow +28.1/30.0
- ARV discount +15.0/15.0
- DSCR +10.0/10.0
- 1% rule +8.5/10.0
- Livability +2.9/5.0
- Rent growth +2.5/5.0
- Condition / age +2.5/5.0
- Schools +2.0/10.0
- Appreciation +0.0/10.0
$105,000
🖨 Deal sheet 📄 Offer letter ✓ Due diligence
Listing remarks
Don't mistake the low price for lack of quality and condition. Sellers have drastically reduced for quick sale! Listed well below JCAD!! Start out in a home offering instant equity! This 3/2/2 slab/brick home is the perfect canvas for your own special touches. The interior has some newer flooring in priority bedroom with an updated priority bath consisting of a custom tile shower and vanity. Tile flooring throughout main areas. Kitchen open to breakfast area facing rear of property backing up to shared lake in Holmwood. Most interior has been freshly painted. Concrete driveway leading to attached garage as well as additional covered parking that is ideal for boat and RV parking or covered e
Key facts
- Covered parking
- Shared lake
- Boat and rv parking
Tags
Property features AI
Exterior
- Parking: Attached garage (2 spaces); Carport (4 spaces)
- Utilities: Public water; Public sewer
- Home design: Single-family residence; Residential property; State road frontage
- Construction: Brick veneer exterior; Composition roof; Slab foundation
- Exterior features: Covered patio/porch; Chain link fencing; Lake frontage
Interior
- Kitchen: Cooktop; Dishwasher; Oven
- Flooring: Tile; Vinyl
- Bathrooms: 2 full bathrooms
- Heating & cooling: Central heating (electric); Central air conditioning
- Interior features: Wood-burning fireplace; Ceiling fan(s)
Neighborhood map
What this means for you Summary
Snapshot
- This is a 3-bed/2.0-bath single-family listed at $105k.
Deal economics
- At list price, monthly cash flow is $203 ($2k/yr) — positive.
- The deal already cash-flows at list — no discount required.
- Meets the 1% rule at list price ($1k rent vs $105k).
- Cap rate 10.0% vs local median 4.8% in Jasper — top-decile yield for the area; either an underpriced asset or a hidden risk that comps aren't pricing in. Stress-test before assuming the spread holds.
Location & tenants
- Location reads 58/100 on livability (#1,225 in TX) — a working-class tenant base; expect higher turnover. Strengths: cost of living A+, housing A; Watch: crime C-, schools F, amenities F.
- Jasper ISD (town): math 22% / reading 26% proficiency, ranked #734 of 826 in TX (top 89%) — low school quality limits family demand, transient renter base, plan for 1-2y turnover; 66% free/reduced lunch — lower-income household profile, screen leases tightly.
- Market conditions: 308 active listings in the ZIP; 45 units permitted in Jasper County in 2024 (0 in 5+ unit buildings).
Forward outlook
- Local home prices are declining (-3.0%/yr); year-one equity from $726 of loan paydown is wiped out by about $3k of value loss. Plan a longer hold.
- Jasper County population projected at -15% by 2050 — secular population decline; favor cash flow + early exit over multi-decade hold.
Negotiation context
- Only 1 days on market — expect competitive offers; lowballing is unlikely to land.
Risks & watch-outs
- Watch-outs: flood insurance adds $125/mo.
- Climate carrying-cost: in FEMA flood zone A (mandatory federal flood insurance); severe wind risk, 99% chance of damaging wind over 30y; extreme-heat days projected 7→22/yr by 2055 (HVAC capex compounding) — expect insurance premiums to compound above CPI over the hold.
Questions for the listing agent
- What's the actual annual flood-insurance premium (NFIP or private), and is the property in a SFHA with mandatory coverage?
- Is there a deadline driving the sale (1031 exchange, divorce, estate, relocation)? That informs how much negotiation room exists.
- Schools are F-rated, which usually means shorter tenancies and higher turnover. Who's the typical renter profile here, and what's been the actual vacancy rate?
- What's the average days-on-market for RENTAL listings here right now (not sales)? A rising rental-DOM trend means longer vacancies and softer asking-rent achievability than the comps imply.
- What's the recent tenant-quality profile in this submarket — average credit score on applications, eviction rate, late-payment / NSF rate, and stable-employment percentage? A property-management company in the area should have these aggregated.
- How much new for-sale + rental construction is in the pipeline within 1–3 miles? Heavy new supply typically softens prices + rents 12–24 months out; constrained supply supports both.
Investment metrics
- 1% rule
- 1.35% ✓
- Cap rate
- 10.05%
- Cash-on-cash
- 13.42%
- DSCR
- 1.60
- GRM
- 6.2
CMA / ARV
- ARV (median comp)
- $166,420
- List price
- $105,000
- Delta
- -28.49%
- Verdict
- UNDERPRICED
- Comps
- 2 within 1.0 mi
Projected returns pro-forma
-3.0% appreciation · 3.0% rent growth · sell at horizon
- IRR
- -3.5%
- Equity multiple
- 0.87×
- Total profit
- $-3,917
- Equity at exit
- $15,656
- IRR
- 6.3%
- Equity multiple
- 1.47×
- Total profit
- $13,842
- Equity at exit
- $9,078
Cash invested: $29,400 (down + closing). Projections, not guarantees.
Landlord ↔ Tenant lean methodology
- Overall (STATE)
- 87 Strongly Landlord-Friendly
- State Texas
- 87 Strongly Landlord-Friendly · R+5
- County
- — inherits STATE
- City
- — inherits STATE
ZIP-level market 75951
- Active inventory
- 308
- Price-to-rent
- 6.2×
Monthly cashflow live
- Estimated rent
- $1,419 medium interval (Pro) →
- Mortgage (P&I)
- −$551
- Tax from tax record
- −$198 /mo · $2,372/yr
- Insurance
- −$44
- Flood insurance flood zone
- −$125 /mo · $1,502/yr
- HOA
- −$0
- Vacancy / Maint / Mgmt
- −$298
- Net cashflow
- $203
Break-even live
UW: 25.0% down · 7.5% · 30yr · 1.5% tax · 5.0% vac · 8.0% maint · 8.0% mgmt
Financing live
Cash to close
- Down payment
- $26,250
- Closing costs
- $3,150
- Reserves months
- —
- Total cash needed
- —
Loan-product check · same deal, 3 products live
Conventional
25% down · 7.5% · 30yr
- Down + closing
- —
- Monthly P&I
- —
- Monthly cashflow
- —
- DSCR
- —
- Eligible?
- —
Personal DTI + credit; lowest rate.
DSCR
20% down · 8.5% · 30yr
- Down + closing
- —
- Monthly P&I
- —
- Monthly cashflow
- —
- DSCR
- —
- Eligible?
- —
No personal income docs; deal must DSCR.
Hard money
10% down · 12.0% · 12mo
- Down + closing
- —
- Monthly P&I
- —
- Monthly cashflow
- —
- DSCR
- —
- Eligible?
- —
Short-term bridge; refi at stabilization.
Listing history 13 events
-
2026-06-18remarks 699-char remark
-
2026-06-18pricedays on market $105,000 Active 1 DOM
-
2026-06-10days on market $119,000 Active 68 DOM
-
2026-06-09days on market $119,000 Active 67 DOM
-
2026-06-08days on market $119,000 Active 66 DOM
-
2026-06-07days on market $119,000 Active 65 DOM
-
2026-06-05days on market $119,000 Active 62 DOM
-
2026-06-03days on market $119,000 Active 61 DOM
-
2026-06-02days on market $119,000 Active 60 DOM
-
2026-06-01days on market $119,000 Active 59 DOM
-
2026-05-31days on market $119,000 Active 58 DOM
-
2026-05-31days on market $119,000 Active 57 DOM
-
2026-04-03$119,000 Active 860-char remark
ⓘ Source: listings_history table (triggers on properties + properties_extension) + one-shot
backfill from property_details.listing_events for pre-trigger history.
Tax reassessment forecast TX · Resets to sale price
- Current annual tax
- $2,372 · $198/mo
- Projected year-2 tax
- $2,372 · $198/mo
- Expected delta
- $0/yr ($0/mo · 0.0%)
ⓘ Screening estimate from a state-policy table — verify with the county assessor before closing.
Climate risk First Street
- Flood 4/10 Moderate FEMA zone A · 22% chance over 30 yrs
- Wildfire 4/10 Moderate
- Heat 8/10 Severe 7 d/yr ≥111°F today · 22 d/yr by 30 yrs out
- Wind 8/10 Severe 99% chance of damaging wind over 30 yrs
- Air quality 1/10 Low 0 unhealthy d/yr today · 0 by 30 yrs out
Nearby sold comps map
Loading sold comps map…
Walkable amenities ~0.75 mi
Loading nearby amenities…
Taxation est. · year 1
- Rental income
- $17,024
- − Mortgage interest
- −$5,882
- − Property taxes
- −$2,372
- − Insurance
- −$2,027
- − Repairs & maintenance
- −$1,362
- − Management
- −$1,362
- − Depreciation
- −$3,055
- Taxable income
- $964
- Est. tax owed @ 24.0%
- −$231
- After-tax cash flow
- $2,210/yr
For passive investors: Depreciation is non-cash, so a rental often shows a tax loss while cash-flowing — sheltering income. Rental losses are passive: they offset passive income freely, and up to $25,000/yr can offset ordinary (W-2) income if you actively participate and your MAGI is under $100k (phasing out to $0 by $150k); unused losses carry forward. On sale, claimed depreciation is recaptured at up to 25%, and gains may owe capital-gains tax (a 1031 exchange can defer both). Figures are a year-1 estimate at your 24.0% rate — not tax advice; consult a CPA.
Schools (NCES district)
- District
- Jasper ISD
- NCES district ID
- 4824630
- Math proficiency
- 22% ▼ -12.00%
- Reading proficiency
- 26% ▼ -8.00%
- Median HH income
- $36,286
- Composite
- 19.91/100
- National rank
- #8684
- State rank
- #734 of 826 in TX
Livability — Jasper
- Score
- 58/100
- State rank
- #1225
- US rank
- #21385
Category grades
Schools grade is shown separately in the Schools card above.
Census & demographics
- Population (ZIP)
- 15,267
Population outlook (Jasper County) Hauer SSP2
- Today (2025)
- 33,986 people
- By 2030
- 32,965 · -3.0%
- By 2040
- 30,908 · -9.1%
- By 2050
- 28,893 · -15.0%
- By 2075
- 24,828 · -26.9%
- By 2100
- 19,987 · -41.2%
Race, ethnicity, and origin ACS 2023
- Neighborhood character
- Diverse neighborhood (Simpson 0.56)
- Race & ethnicity
- White 60% Black 28% Two or more races 7% Hispanic / Latino 6%
- Hispanic origin (detail)
- Mexican 6%
- Common ancestry
- Lithuanian 1% Slovak 1% Iranian 1%
- Foreign-born
- 3% · Canada
- Languages at home
- 93% English-only · Spanish 5% Tagalog/Filipino 1%
Political lean MEDSL · Jasper
- 2024 margin
- Solid R (+66.6) · D 16.5% · R 83.1%
- 2008→2024 swing
- -24.6pp toward R · 2008: -42.0pp · 2024: -66.6pp
- All cycles
- 2024: R+66.6 2020: R+61.4 2016: R+59.9 2012: R+48.4 2008: R+42.0
Not yet ingested
- Civics
- —
Market trends
- HPI YoY
- ▼ -83.56%
- Current HPI
- 136.7972
- Rent YoY
- —
- Metro
- —
- State GDP YoY
- ▲ 3.95%
- F500 in state
- 110
Industry mix (Fortune 500 HQ in TX)
| Industry | F500 HQs | Revenue |
|---|---|---|
| Energy | 16 | $1,198B |
|
||
| Technology | 5 | $198B |
|
||
| Engineering / Construction | 4 | $72B |
|
||
| Energy Services | 3 | $60B |
|
||
| Utilities | 3 | $41B |
|
||
| Healthcare | 2 | $330B |
|
||
Price history
1 event — show timeline
- 2026-06-17 Listed $105,000 BBOR
Property tax history
+1.1%/yrLatest (2025): $2,372 · +1.6% YoY. Source: county tax records.
Cash-flow waterfall
monthlySold comps — $/sqft
last 12 mo · ≤1 miLoading sold comps…