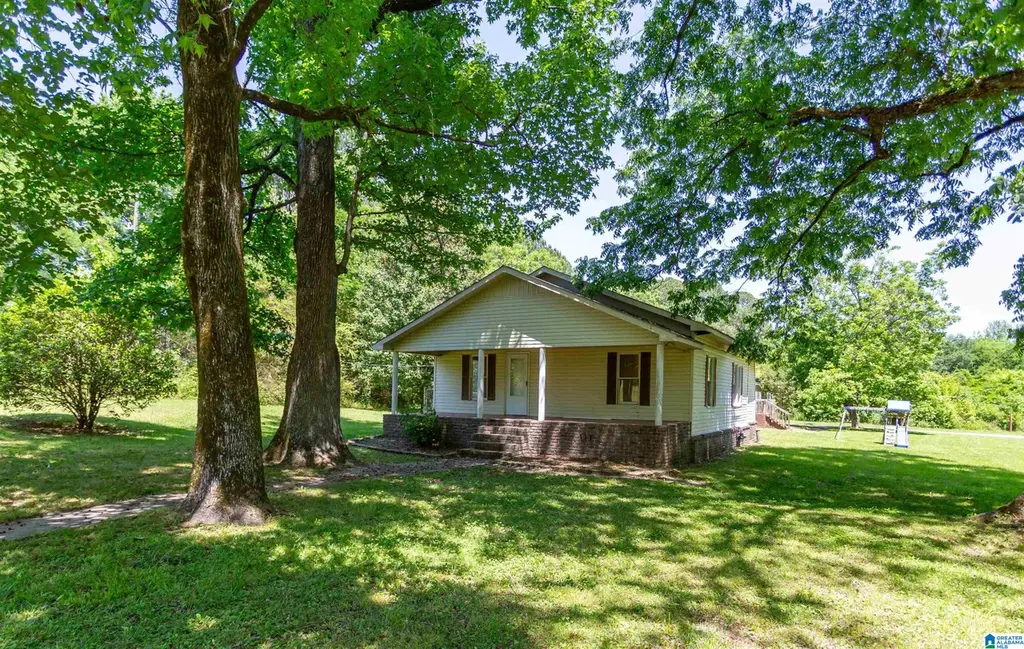
1907 Kelly Loop Rd · Mount Olive, AL
Flood risk 1/10 · Minimal
- FEMA flood zone
- X (unshaded)
- Chance of flooding over 30 yrs
- 0.0%
- Est. flood insurance / yr
- $507 – $1,088
Fire risk 5/10 · Moderate
- Est. fire insurance / yr
- $916 – $1,700
Heat risk 6/10 · Moderate
- Hot days now (above 107°F)
- 7 days/yr
- Hot days in 30 yrs
- 19 days/yr
Wind risk 6/10 · Moderate
- Chance of severe wind over 30 yrs
- 27.0%
Air-quality risk 5/10 · Moderate
- Unhealthy air days now
- 6 days/yr
- Unhealthy air days in 30 yrs
- 9 days/yr
Risk factors via First Street. Map © Google.
Why this score? — see what drove the C- grade
The composite is a weighted blend of 9 inputs, each scored 0–100. Each bar is that input's sub-score; the figure is the points it added to the 100-point composite (weight × sub-score).
- Cash flow +22.3/30.0
- DSCR +7.1/10.0
- ARV discount +7.1/15.0
- 1% rule +5.1/10.0
- Livability +3.2/5.0
- Rent growth +2.5/5.0
- Condition / age +2.5/5.0
- Schools +1.8/10.0
- Appreciation +0.0/10.0
$172,000
🖨 Deal sheet 📄 Offer letter ✓ Due diligence
Listing remarks
Nestled on a beautiful 1.89-acre level, shaded lot, this charming property offers endless possibilities with two homes on one parcel! The main home features 2 bedrooms, 1 bath, a spacious kitchen, and an abundance of floor-to-ceiling cabinet storage, providing both charm and functionality. Also included is an expansive 2,200+/- sq. ft. mobile home offering 4 bedrooms, 2.5 baths, a large living room, a separate den, and a roomy kitchen perfect for gathering and entertaining. The large master suite features a generous bath and walk-in closet. While the mobile home could use some updates, it offers incredible space and potential for extended family or rental income. Enjoy the peaceful setting,
Key facts
- Walk-in closet
- Separate den
- Roomy kitchen
Tags
Property features AI
Finance
- Other: Property accessed via paved public road
- Financial info: Fire fee: $20 yearly
- HOA & community: No association fee
Exterior
- Parking: Driveway parking; Multi-level parking
- Utilities: Public water; Septic system; Electric water heater; Internet service availability unknown
- Home design: Existing property; Brick over foundation with vinyl siding; Crawl space foundation
- Construction: Brick over foundation; Vinyl siding
- Exterior features: Fenced yard; Porch; Corner lot; Acreage (1.89 acres)
Interior
- Kitchen: Eating area; Pantry; Laminate countertops; Built-in dishwasher
- Bedrooms: Master bedroom on main level; Additional bedroom on main level
- Flooring: Hardwood; Laminate
- Bathrooms: One full bathroom with tub/shower combo (main level)
- Heating & cooling: Central heating (Propane gas); Central cooling (Electric)
- Interior features: Smooth ceilings; Has attic
- Laundry & utility: Washer hookup; Electric dryer hookup; Laundry located on the main level in a closet
Neighborhood map
What this means for you Summary
Snapshot
- This is a 2-bed/1.0-bath single-family listed at $172k.
Deal economics
- At list price, monthly cash flow is $284 ($3k/yr) — positive.
- The deal already cash-flows at list — no discount required.
- Meets the 1% rule at list price ($2k rent vs $172k).
- Cap rate 8.3% vs local median 5.1% in Mount Olive — top-decile yield for the area; either an underpriced asset or a hidden risk that comps aren't pricing in. Stress-test before assuming the spread holds.
Location & tenants
- Location reads 64/100 on livability (#150 in AL) — a middle-class / working-renter tenant base. Strengths: employment A+, cost of living A+, housing A+; Watch: amenities F, commute F, health & safety F.
- Jefferson County (suburban): math 9% / reading 32% proficiency, ranked #104 of 129 in AL (top 81%) — low school quality limits family demand, transient renter base, plan for 1-2y turnover.
- Zoned schools: Gardendale High School (math 21% / reading 28%, grade F, #118 of 305 statewide, top 45%, 1,047 students, 48% FRL) — zoned schools at 48% FRL track the district average.
- Market conditions: 65 active listings in the ZIP; 2,114 units permitted in Jefferson County in 2024 (556 in 5+ unit buildings).
Forward outlook
- Local home prices are declining (-3.0%/yr); year-one equity from $1k of loan paydown is wiped out by about $5k of value loss. Plan a longer hold.
- Jefferson County population projected to shrink 4% by 2050 — rents likely to lag national; underwrite the cash flow, not the appreciation.
Negotiation context
- Only 11 days on market — expect competitive offers; lowballing is unlikely to land.
Risks & watch-outs
- Watch-outs: built in 1920 — expect roof / HVAC / electrical / plumbing capex.
- Climate carrying-cost: major wind risk, 27% chance of damaging wind over 30y; moderate wildfire risk; extreme-heat days projected 7→19/yr by 2055 (HVAC capex compounding) — expect insurance premiums to compound above CPI over the hold.
Questions for the listing agent
- Built in 1920 — when were the roof, HVAC, electrical panel, plumbing, and water heater last replaced?
- Is there a deadline driving the sale (1031 exchange, divorce, estate, relocation)? That informs how much negotiation room exists.
- What's the average days-on-market for RENTAL listings here right now (not sales)? A rising rental-DOM trend means longer vacancies and softer asking-rent achievability than the comps imply.
- What's the recent tenant-quality profile in this submarket — average credit score on applications, eviction rate, late-payment / NSF rate, and stable-employment percentage? A property-management company in the area should have these aggregated.
- How much new for-sale + rental construction is in the pipeline within 1–3 miles? Heavy new supply typically softens prices + rents 12–24 months out; constrained supply supports both.
Investment metrics
- 1% rule
- 1.01% ✓
- Cap rate
- 8.27%
- Cash-on-cash
- 7.08%
- DSCR
- 1.31
- GRM
- 8.2
CMA / ARV
- ARV (on-the-fly)
- $170,400
- Comps found
- 3
Show comp detail 3 sales within ~0.75 mi
| Address | Dist | Beds/Ba | Sqft | Sold | Price | $/sf | Match |
|---|---|---|---|---|---|---|---|
| 5938 Goode Rd | 0.25mi | 2/2.0 | 1,200 (0%) | 23mo | $195,000 | $163 | 65 |
| 1685 Kelly Loop Rd | 0.31mi | 3/2.0 (+1) | 1,104 (-8%) | 12mo | $149,900 | $136 | 53 |
| 1606 Brookside Rd | 0.61mi | 3/1.0 (+1) | 1,362 (+14%) | 3mo | $193,000 | $142 | 41 |
Match score weights: distance 35% · size 25% · config 20% · recency 20%. Top-matched comps best support the ARV.
Projected returns pro-forma
-3.0% appreciation · 3.0% rent growth · sell at horizon
- IRR
- -5.5%
- Equity multiple
- 0.80×
- Total profit
- $-9,818
- Equity at exit
- $25,646
- IRR
- 4.2%
- Equity multiple
- 1.30×
- Total profit
- $14,599
- Equity at exit
- $14,871
Cash invested: $48,160 (down + closing). Projections, not guarantees.
Landlord ↔ Tenant lean methodology
- Overall (STATE)
- 90 Strongly Landlord-Friendly
- State Alabama
- 90 Strongly Landlord-Friendly · R+15
- County
- — inherits STATE
- City
- — inherits STATE
ZIP-level market 35117
- Home prices YoY
- -19.9%
- Active inventory
- 65
- Price-to-rent
- 8.2×
Monthly cashflow live
- Estimated rent
- $1,738 medium interval (Pro) →
- Mortgage (P&I)
- −$902
- Tax from tax record
- −$115 /mo · $1,386/yr
- Insurance
- −$72
- HOA
- −$0
- Vacancy / Maint / Mgmt
- −$365
- Net cashflow
- $284
Break-even live
UW: 25.0% down · 7.5% · 30yr · 1.5% tax · 5.0% vac · 8.0% maint · 8.0% mgmt
Financing live
Cash to close
- Down payment
- $43,000
- Closing costs
- $5,160
- Reserves months
- —
- Total cash needed
- —
Loan-product check · same deal, 3 products live
Conventional
25% down · 7.5% · 30yr
- Down + closing
- —
- Monthly P&I
- —
- Monthly cashflow
- —
- DSCR
- —
- Eligible?
- —
Personal DTI + credit; lowest rate.
DSCR
20% down · 8.5% · 30yr
- Down + closing
- —
- Monthly P&I
- —
- Monthly cashflow
- —
- DSCR
- —
- Eligible?
- —
No personal income docs; deal must DSCR.
Hard money
10% down · 12.0% · 12mo
- Down + closing
- —
- Monthly P&I
- —
- Monthly cashflow
- —
- DSCR
- —
- Eligible?
- —
Short-term bridge; refi at stabilization.
Listing history 5 events
-
2026-06-03days on market $172,000 Active 11 DOM
-
2026-06-02days on market $172,000 Active 10 DOM
-
2026-06-01days on market $172,000 Active 9 DOM
-
2026-05-31days on market $172,000 Active 8 DOM
-
2026-05-22$172,000 Active
ⓘ Source: listings_history table (triggers on properties + properties_extension) + one-shot
backfill from property_details.listing_events for pre-trigger history.
Tax reassessment forecast AL · Resets to sale price
- Current annual tax
- $1,386 · $115/mo
- Projected year-2 tax
- $1,386 · $115/mo
- Expected delta
- $0/yr ($0/mo · 0.0%)
ⓘ Screening estimate from a state-policy table — verify with the county assessor before closing.
Climate risk First Street
- Flood 1/10 Low FEMA zone X (unshaded) · 0% chance over 30 yrs
- Wildfire 5/10 Major
- Heat 6/10 Major 7 d/yr ≥107°F today · 19 d/yr by 30 yrs out
- Wind 6/10 Major 27% chance of damaging wind over 30 yrs
- Air quality 5/10 Major 6 unhealthy d/yr today · 9 by 30 yrs out
Nearby sold comps map
Loading sold comps map…
Walkable amenities ~0.75 mi
Loading nearby amenities…
Taxation est. · year 1
- Rental income
- $20,858
- − Mortgage interest
- −$9,635
- − Property taxes
- −$1,386
- − Insurance
- −$860
- − Repairs & maintenance
- −$1,669
- − Management
- −$1,669
- − Depreciation
- −$5,004
- Taxable income
- $636
- Est. tax owed @ 24.0%
- −$153
- After-tax cash flow
- $3,255/yr
For passive investors: Depreciation is non-cash, so a rental often shows a tax loss while cash-flowing — sheltering income. Rental losses are passive: they offset passive income freely, and up to $25,000/yr can offset ordinary (W-2) income if you actively participate and your MAGI is under $100k (phasing out to $0 by $150k); unused losses carry forward. On sale, claimed depreciation is recaptured at up to 25%, and gains may owe capital-gains tax (a 1031 exchange can defer both). Figures are a year-1 estimate at your 24.0% rate — not tax advice; consult a CPA.
Schools (NCES district)
- District
- Jefferson County
- NCES district ID
- 0101920
- Math proficiency
- 9% ▼ -24.00%
- Reading proficiency
- 32% ▼ -5.00%
- Median HH income
- $51,712
- Composite
- 18.4/100
- National rank
- #8937
- State rank
- #104 of 129 in AL
Livability — Mount Olive
- Score
- 64/100
- State rank
- #150
- US rank
- #13778
Category grades
Schools grade is shown separately in the Schools card above.
Census & demographics
- Census place
- Mount Olive, AL
- Population (ZIP)
- 5,091
Population outlook (Jefferson County) Hauer SSP2
- Today (2025)
- 669,185 people
- By 2030
- 669,694 · +0.1%
- By 2040
- 661,388 · -1.2%
- By 2050
- 643,086 · -3.9%
- By 2075
- 577,267 · -13.7%
- By 2100
- 474,758 · -29.1%
Race, ethnicity, and origin ACS 2023
- Neighborhood character
- Predominantly White (84%)
- Race & ethnicity
- White 84% Black 9% Hispanic / Latino 5% Two or more races 2%
- Hispanic origin (detail)
- Mexican 5%
- Common ancestry
- Italian 2% Slovak 2% Iranian 1%
- Foreign-born
- 1% · Canada
- Languages at home
- 94% English-only · Spanish 5% Korean 1%
Political lean MEDSL · Jefferson
- 2024 margin
- D (+10.4) · D 54.6% · R 44.2% · Other 1.2%
- 2008→2024 swing
- +5.4pp toward D · 2008: 5.1pp · 2024: 10.4pp
- All cycles
- 2024: D+10.4 2020: D+13.2 2016: D+7.2 2012: D+6.0 2008: D+5.1
Not yet ingested
- Civics
- —
Market trends
- HPI YoY
- ▼ -51.36%
- Current HPI
- 207.071
- Rent YoY
- —
- Metro
- —
- State GDP YoY
- ▲ 2.94%
- F500 in state
- 4
Industry mix (Fortune 500 HQ in AL)
| Industry | F500 HQs | Revenue |
|---|---|---|
| Financial Services | 1 | $8B |
|
||
| Healthcare | 1 | $5B |
|
||
Price history
1 event — show timeline
- 2026-05-22 Listed $172,000 Greater Alabama MLS
Property tax history
+3.4%/yrLatest (2025): $1,386 · +0.0% YoY. Source: county tax records.
Cash-flow waterfall
monthlySold comps — $/sqft
last 12 mo · ≤1 miLoading sold comps…