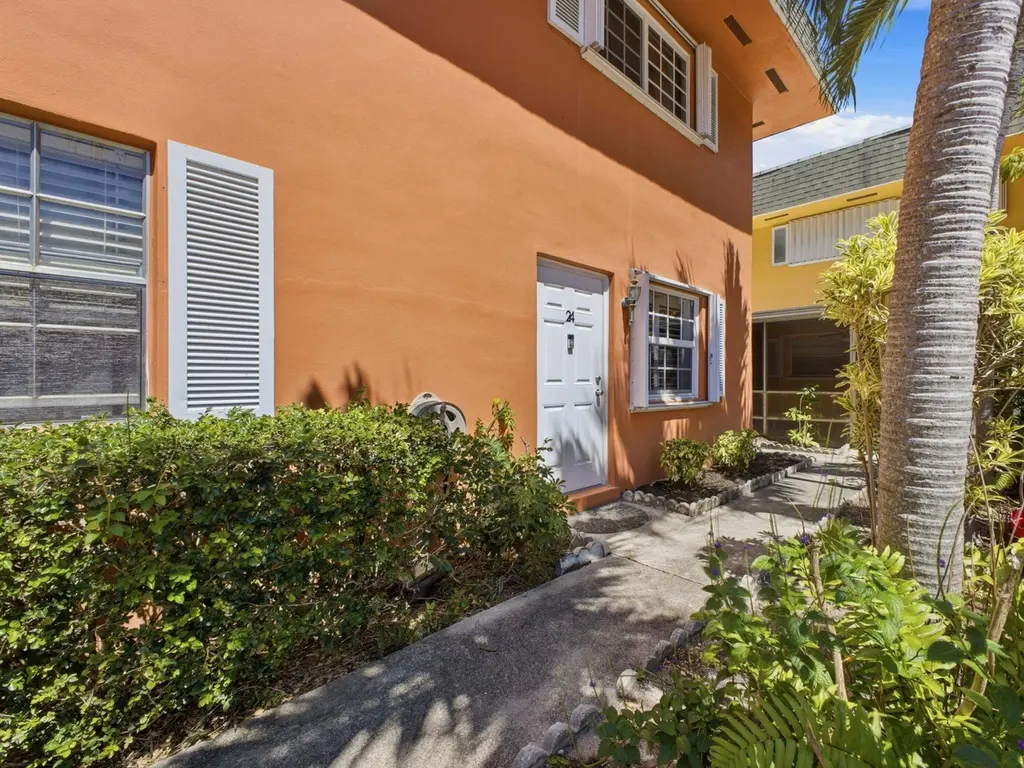
2200 Monroe St #24 · Hollywood, FL
Flood risk 5/10 · Moderate
- FEMA flood zone
- AH
- Chance of flooding over 30 yrs
- 0.24%
- Est. flood insurance / yr
- $1,142 – $2,507
Fire risk 1/10 · Minimal
- Est. fire insurance / yr
- $947 – $1,759
Heat risk 10/10 · Severe
- Hot days now (above 105°F)
- 7 days/yr
- Hot days in 30 yrs
- 27 days/yr
Wind risk 10/10 · Severe
- Chance of severe wind over 30 yrs
- 99.0%
Air-quality risk 2/10 · Minimal
- Unhealthy air days now
- 2 days/yr
- Unhealthy air days in 30 yrs
- 2 days/yr
Risk factors via First Street. Map © Google.
Why this score? — see what drove the D+ grade
The composite is a weighted blend of 9 inputs, each scored 0–100. Each bar is that input's sub-score; the figure is the points it added to the 100-point composite (weight × sub-score).
- Cash flow +16.4/30.0
- ARV discount +7.5/15.0
- 1% rule +6.8/10.0
- DSCR +5.1/10.0
- Schools +4.1/10.0
- Livability +3.8/5.0
- Rent growth +2.6/5.0
- Condition / age +2.5/5.0
- Appreciation +0.0/10.0
$289,000
🖨 Deal sheet (PDF) 📄 Offer letter ✓ Due diligence
Listing remarks
Spacious corner unit featuring 2 primary suites, each with private bathrooms, updated showers & walk in closets. Wood staircase and the first floor is tiled throughout with living room filled with natural light, enhanced by plantation shutters and tropical courtyard & pool views. Major updates include a new roof (2021), impact windows & storm doors [2024], A/C (2019), water heater (2018), and in-unit washer/dryer. The kitchen offers wood cabinetry with plenty of counter space, stainless steel appliances & rear door leading to a shaded BBQ area. Ideally located in the heart of Hollywood, just a short walk to downtown restaurants, shopping, playgrounds & parks an
Key facts
- Updated showers
- Private bathrooms
- Wood staircase
Tags
Property features AI
Finance
- Other: Pets allowed with breed restrictions; Directions: East of I-95 on Hollywood Blvd just past roundabout, go south on S 24th Ave, then east on Monroe
- Financial info: No land lease
- HOA & community: HOA (association) present — Patterson Home Improvement & Management; HOA amenities include pool, picnic area, and parking; HOA fee $600 per month; HOA covers insurance, grounds and structure maintenance, sewer, trash, water, common areas, roof repairs, recreation facility, and pool service
Exterior
- Parking: Assigned parking and guest spaces; 2 open parking spaces (1 assigned parking total indicated)
- Security: Security fence
- Utilities: Public water; Public sewer; Cable connected; Electricity connected; Water connected
- Home design: Condominium; Two levels (2-story); First-floor entry; Faces east
- Construction: CBS construction; Rolled/hot mop roof; Slab foundation; Built as part of Palm Townhouse Condo; Living area approx. 1,300 (public records)
- Exterior features: Open patio; Patio; Fenced yard; Asphalt road frontage; Publicly maintained road; Not waterfront
Interior
- Kitchen: Dishwasher; Disposal; Electric range; Refrigerator; Electric water heater
- Bedrooms: No main-level bedrooms (all bedrooms on upper level)
- Flooring: Ceramic tile; Wood
- Bathrooms: 2 full bathrooms and 1 half bathroom
- Heating & cooling: Central electric heating; Central electric cooling (air conditioning)
- Interior features: Walk-in closets; Split bedroom layout; Unfurnished
- Laundry & utility: In-unit laundry
Neighborhood map
What this means for you Summary
Snapshot
- This is a 2-bed/3.0-bath condo listed at $289k.
Deal economics
- At list price, monthly cash flow is $11 ($128/yr) — positive.
- The deal already cash-flows at list — no discount required.
- Meets the 1% rule at list price ($3k rent vs $289k).
- Recommended offer: $280k (3.0% below list) — sets the bar for market timing.
- Cap rate 7.0% vs local median 3.2% in Hollywood — top-decile yield for the area; either an underpriced asset or a hidden risk that comps aren't pricing in. Stress-test before assuming the spread holds.
Location & tenants
- Location reads 76/100 on livability (#232 in FL, #3,548 nationally) — a middle-class / working-renter tenant base. Strengths: commute A+, housing A+, crime B+; Watch: amenities D.
- Broward (suburban): math 42% / reading 53% proficiency, ranked #46 of 73 in FL (top 63%) — families likely to look elsewhere, expect single-tenant / working-renter base with shorter leases.
- Zoned schools: Colbert Elementary School (math 35% / reading 29%, grade F, #1,797 of 2,144 statewide, top 86%, 611 students, 82% FRL); Olsen Middle School (math 18% / reading 24%, grade F, #555 of 571 statewide, top 97%, 633 students, 73% FRL); South Broward High School (math 24% / reading 49%, grade F, #351 of 667 statewide, top 54%, 2,397 students, 59% FRL) — zoned schools average 71% FRL vs 51% district-wide (20 pts higher); higher-poverty schools than district average — tighter screening recommended.
- Zoned-school proficiency averages 30% at this address vs 48% district-wide (-18 pts) — the specific schools serving this property underperform the Broward average; the district grade overstates school quality for this exact location.
- Market conditions: Rents flat; 591 active listings in the ZIP; 40 comparable units currently listed for rent nearby; rentals at typical pace (median 17d on market — plan ~3-4 weeks tenant-placement turnaround); 2,111 units permitted in Broward County in 2024 (1,265 in 5+ unit buildings).
- At $3,399/mo this rent would consume 72% of the median local household income ($56k/yr) (locally 3948% of renters already pay >50% of income on rent) — very limited rent-growth headroom before tenants either downsize or default.
Forward outlook
- Local home prices are declining (-3.0%/yr); year-one equity from $2k of loan paydown is wiped out by about $9k of value loss. Plan a longer hold.
- Broward County population projected at +34% by 2050 — long-run rental-demand tailwind backs the buy-and-hold thesis.
Negotiation context
- It's been on market 44 days — a 3% lower offer ($280k) is reasonable based on typical stale-listing flexibility.
- Current owner paid $170k; list at $289k implies a 70% gain — meaningful room to come down on a strong offer.
Risks & watch-outs
- Watch-outs: flood insurance adds $152/mo.
- Climate carrying-cost: in FEMA flood zone AH (mandatory federal flood insurance); severe wind risk, 99% chance of damaging wind over 30y; extreme-heat days projected 7→27/yr by 2055 (HVAC capex compounding) — expect insurance premiums to compound above CPI over the hold.
Questions for the listing agent
- It's been on market 44 days. Have you received any prior offers? Is the seller open to a 3% concession, seller financing, or rate buy-down credit?
- Built in 1973 — when were the roof, HVAC, electrical panel, plumbing, and water heater last replaced?
- What's the actual annual flood-insurance premium (NFIP or private), and is the property in a SFHA with mandatory coverage?
- What does the HOA fee cover, when was the last increase, and are there any pending special assessments or reserve-fund shortfalls?
- Any open or pending special assessments — roof, HVAC, plumbing, elevator, façade? What's the per-unit balance and payoff schedule, and is the seller paying it off at close or rolling it to the buyer?
- Is there a deadline driving the sale (1031 exchange, divorce, estate, relocation)? That informs how much negotiation room exists.
- The area grade is low — what's the realistic commute time and amenity access for the typical tenant pool here? Any planned neighborhood developments (good or bad) we should know about?
- What's the average days-on-market for RENTAL listings here right now (not sales)? A rising rental-DOM trend means longer vacancies and softer asking-rent achievability than the comps imply.
- What's the recent tenant-quality profile in this submarket — average credit score on applications, eviction rate, late-payment / NSF rate, and stable-employment percentage? A property-management company in the area should have these aggregated.
- How much new apartment / multifamily construction is in the pipeline within 1–3 miles? Heavy new supply (>2% of stock underway) typically softens rents 12–24 months out; light construction supports rent growth.
Investment metrics
- 1% rule
- 1.18% ✓
- Cap rate
- 6.97%
- Cash-on-cash
- 2.41%
- DSCR
- 1.11
- GRM
- 7.1
CMA / ARV
No comps found within radius.
Projected returns pro-forma
-3.0% appreciation · 0.43% rent growth · sell at horizon
- IRR
- -19.8%
- Equity multiple
- 0.33×
- Total profit
- $-54,255
- Equity at exit
- $43,091
- IRR
- -22.3%
- Equity multiple
- 0.04×
- Total profit
- $-77,874
- Equity at exit
- $24,987
Cash invested: $80,920 (down + closing). Projections, not guarantees.
Landlord ↔ Tenant lean methodology
- Overall (STATE)
- 87 Strongly Landlord-Friendly
- State Florida
- 87 Strongly Landlord-Friendly · R+3
- County
- — inherits STATE
- City
- — inherits STATE
ZIP-level market 33020
- Rents YoY
- 0.4%
- Active inventory
- 591
- Price-to-rent
- 7.1×
Monthly cashflow live
- Estimated rent
- $3,399 high interval (Pro) →
- Mortgage (P&I)
- −$1,516
- Tax from tax record
- −$287 /mo · $3,439/yr
- Insurance
- −$120
- Flood insurance flood zone
- −$152 /mo · $1,824/yr
- HOA
- −$600
- Vacancy / Maint / Mgmt
- −$714
- Net cashflow
- $11
Break-even live
Sensitivity live
| Price | -10% $174 | -5% $92 | +0% $11 | +5% $-71 | +10% $-153 |
|---|---|---|---|---|---|
| Rent | -10% $-258 | -5% $-124 | +0% $11 | +5% $145 | +10% $279 |
| Rate | -1.0pp $156 | -0.5pp $84 | base $11 | +0.5pp $-64 | +1.0pp $-140 |
UW: 25.0% down · 7.5% · 30yr · 1.5% tax · 5.0% vac · 8.0% maint · 8.0% mgmt
Financing live
Cash to close
- Down payment
- $72,250
- Closing costs
- $8,670
- Reserves months
- —
- Total cash needed
- —
Loan-product check · same deal, 3 products live
Conventional
25% down · 7.5% · 30yr
- Down + closing
- —
- Monthly P&I
- —
- Monthly cashflow
- —
- DSCR
- —
- Eligible?
- —
Personal DTI + credit; lowest rate.
DSCR
20% down · 8.5% · 30yr
- Down + closing
- —
- Monthly P&I
- —
- Monthly cashflow
- —
- DSCR
- —
- Eligible?
- —
No personal income docs; deal must DSCR.
Hard money
10% down · 12.0% · 12mo
- Down + closing
- —
- Monthly P&I
- —
- Monthly cashflow
- —
- DSCR
- —
- Eligible?
- —
Short-term bridge; refi at stabilization.
Rent comps 40 comps
| Address | Beds | Baths | Sqft | Rent | $/sqft | DOM | Units | Dist |
|---|---|---|---|---|---|---|---|---|
| 2165 Van Buren St Hollywood, FL | 3.0 | 1.0–3.0 | 1072 | $3,609 | $3.37 | 0d | 15 | 0.25mi |
| 2001 Van Buren St Hollywood, FL | 2.0 | 1.0–2.0 | 788 | $3,599 | $4.57 | 17d | 171 | 0.30mi |
| 1938 Jackson St Hollywood, FL | 2.0 | 2.0 | 1170 | $3,600 | $3.08 | 26d | 1 | 0.31mi |
| 2233 Hollywood Blvd Hollywood, FL | 1.0–2.0 | 1.0–2.0 | 913 | $3,515 | $3.85 | 17d | 94 | 0.32mi |
| 706 S 19th Ave Hollywood, FL | 3.0 | 2.0 | 1727 | $3,950 | $2.29 | 9d | 1 | 0.38mi |
| 706 S 19th Ave Unit 706 Hollywood, FL | 3.0 | 2.0 | 1727 | $4,350 | $2.52 | 19d | 1 | 0.38mi |
| 1818 Hollywood Blvd Hollywood, FL | 3.0 | 1.0–2.5 | 1089 | $4,166 | $3.83 | 0d | 26 | 0.48mi |
| 320 S Federal Hwy Hollywood, FL | 2.0 | 1.0–2.0 | 742 | $3,616 | $4.87 | 26d | 9 | 0.50mi |
| 303 S Federal Hwy Hollywood, FL | 1.0–3.0 | 1.0–3.0 | 992 | $2,932 | $2.95 | 4d | 35 | 0.55mi |
| 1770 S Young Cir Hollywood, FL | 2.0 | 1.0–2.0 | 881 | $4,768 | $5.41 | 0d | 42 | 0.57mi |
| 1912 Taylor St Hollywood, FL | 2.0 | 2.0 | 1440 | $3,500 | $2.43 | 26d | 1 | 0.59mi |
| 1715 Jefferson St Hollywood, FL | 3.0 | 2.0 | 1479 | $4,200 | $2.84 | 24d | 1 | 0.60mi |
| 1720 Harrison St #1725 Hollywood, FL | 2.0 | 1.5 | 1320 | $4,400 | $3.33 | 12d | 1 | 0.61mi |
| 1720 Harrison St Unit 1523019P Hollywood, FL | 2.0 | 1.5 | 1313 | $5,107 | $3.89 | 0d | 1 | 0.62mi |
| 2648 Washington St Hollywood, FL | 2.0 | 1.0 | 1193 | $2,800 | $2.35 | 26d | 1 | 0.66mi |
| 1776 Polk St Hollywood, FL | 1.0–2.0 | 1.0–2.0 | 954 | $3,598 | $3.77 | 17d | 25 | 0.69mi |
| 1639 Van Buren St Hollywood, FL | 3.0 | 3.0 | 1669 | $5,300 | $3.18 | 26d | 1 | 0.70mi |
| 1635 Hollywood Blvd Hollywood, FL | 3.0 | 2.0 | 1597 | $3,950 | $2.47 | 4d | 1 | 0.75mi |
| 1635 Hollywood Blvd Hollywood, FL | 3.0 | 2.0 | 1597 | $3,950 | $2.47 | 16d | 1 | 0.75mi |
| 2511 Pierce St #1 Hollywood, FL | 3.0 | 2.5 | 1500 | $3,800 | $2.53 | 26d | 1 | 0.76mi |
| 2750 Washington St Hollywood, FL | 2.0 | 1.0 | 1053 | $3,300 | $3.13 | 4d | 1 | 0.78mi |
| 2750 Washington St Hollywood, FL | 2.0 | 1.0 | 1053 | $3,500 | $3.32 | 16d | 1 | 0.78mi |
| 200 E Pembroke Rd Hallandale Beach, FL | 3.0 | 1.0–2.0 | 1006 | $3,472 | $3.45 | 0d | 63 | 0.78mi |
| 2740 Dewey St Hollywood, FL | 3.0 | 1.0 | 1191 | $2,900 | $2.43 | 14d | 1 | 0.78mi |
| 1619 Hollywood Blvd Hollywood, FL | 3.0 | 2.0 | 1827 | $4,600 | $2.52 | 26d | 1 | 0.78mi |
| 1619 Hollywood Blvd Unit 1619 Hollywood, FL | 3.0 | 2.0 | 1827 | $4,600 | $2.52 | 9d | 1 | 0.78mi |
| 2620 Pierce St Unit A3 Hollywood, FL | 3.0 | 2.5 | 1556 | $3,750 | $2.41 | 20d | 1 | 0.83mi |
| 2823 Polk St Hollywood, FL | 3.0 | 2.0 | 1480 | $3,495 | $2.36 | 26d | 1 | 0.91mi |
| 2911 Monroe St Hollywood, FL | 3.0 | 2.0 | 1645 | $5,200 | $3.16 | 26d | 1 | 0.91mi |
| 2849 Dewey St Unit 2849 Hollywood, FL | 2.0 | 2.0 | 1265 | $2,600 | $2.06 | 12d | 1 | 0.91mi |
| 2849 Dewey St Unit 2849 Hollywood, FL | 2.0 | 2.0 | 1265 | $2,600 | $2.06 | 9d | 1 | 0.91mi |
| 1528 Wiley St Hollywood, FL | 2.0 | 1.0 | 1488 | $4,100 | $2.76 | 26d | 1 | 0.97mi |
| 841 NW 10th St Unit 841C Hallandale Beach, FL | 3.0 | 2.0 | 1585 | $3,200 | $2.02 | 21d | 1 | 0.99mi |
| 841 NW 10th St Hallandale Beach, FL | 3.0 | 2.0 | 1485 | $3,100 | $2.09 | 9d | 1 | 0.99mi |
| 1403 Adams St Hollywood, FL | 3.0 | 2.0 | 1459 | $4,500 | $3.08 | 26d | 1 | 1.00mi |
| 1403 Adams St Unit 1403 Hollywood, FL | 3.0 | 2.0 | 1459 | $4,200 | $2.88 | 26d | 1 | 1.00mi |
| 2832 Fillmore St #18 Hollywood, FL | 2.0 | 2.0 | 1055 | $2,050 | $1.94 | 0d | 1 | 1.00mi |
| 2917 Plunkett St Unit 15C Hollywood, FL | 2.0 | 1.0 | 900 | $1,950 | $2.17 | 9d | 1 | 1.03mi |
| 1306 S 29th Ave Hollywood, FL | 3.0 | 2.0 | 1500 | $3,300 | $2.20 | 20d | 1 | 1.03mi |
| 2831 Pierce St #106 Hollywood, FL | 2.0 | 1.5 | 1300 | $2,300 | $1.77 | 17d | 1 | 1.07mi |
HOA detail condo
- Monthly dues
- $600 · $7,200/yr
- Likely covers
- waterlandscapingpool
- Assessments
- None detected in remarks — confirm with the listing agent.
Listing history 18 events
-
2026-06-21days on market $289,000 Active 44 DOM
-
2026-06-18days on market $289,000 Active 41 DOM
-
2026-06-17days on market $289,000 Active 40 DOM
-
2026-06-16days on market $289,000 Active 39 DOM
-
2026-06-15days on market $289,000 Active 38 DOM
-
2026-06-13days on market $289,000 Active 36 DOM
-
2026-06-09days on market $289,000 Active 32 DOM
-
2026-06-08days on market $289,000 Active 31 DOM
-
2026-06-07days on market $289,000 Active 30 DOM
-
2026-06-04days on market $289,000 Active 27 DOM
-
2026-06-03days on market $289,000 Active 26 DOM
-
2026-06-02days on market $289,000 Active 25 DOM
-
2026-06-01days on market $289,000 Active 24 DOM
-
2026-05-31days on market $289,000 Active 23 DOM
-
2026-05-04$289,000 Active
-
2021-02-19soldstatus $170,000
-
1994-02-03soldstatus $45,000
-
1990-12-04soldstatus $42,000
ⓘ Source: listings_history table (triggers on properties + properties_extension) + one-shot
backfill from property_details.listing_events for pre-trigger history.
Tax reassessment forecast FL · Resets to sale price
- Current annual tax
- $3,439 · $287/mo
- Projected year-2 tax
- $3,439 · $287/mo
- Expected delta
- $0/yr ($0/mo · 0.0%)
ⓘ Screening estimate from a state-policy table — verify with the county assessor before closing.
Climate risk First Street
- Flood 5/10 Major FEMA zone AH · 24% chance over 30 yrs
- Wildfire 1/10 Low
- Heat 10/10 Extreme 7 d/yr ≥105°F today · 27 d/yr by 30 yrs out
- Wind 10/10 Extreme 99% chance of damaging wind over 30 yrs
- Air quality 2/10 Low 2 unhealthy d/yr today · 2 by 30 yrs out
Nearby sold comps map
Loading sold comps map…
Walkable amenities ~0.75 mi
Loading nearby amenities…
Taxation est. · year 1
- Rental income
- $40,789
- − Mortgage interest
- −$16,188
- − Property taxes
- −$3,439
- − Insurance
- −$3,270
- − Repairs & maintenance
- −$3,263
- − Management
- −$3,263
- − HOA
- −$7,200
- − Depreciation
- −$8,407
- Taxable loss
- −$4,242
- Est. tax savings @ 24.0%
- +$1,018
- After-tax cash flow
- $1,146/yr
For passive investors: Depreciation is non-cash, so a rental often shows a tax loss while cash-flowing — sheltering income. Rental losses are passive: they offset passive income freely, and up to $25,000/yr can offset ordinary (W-2) income if you actively participate and your MAGI is under $100k (phasing out to $0 by $150k); unused losses carry forward. On sale, claimed depreciation is recaptured at up to 25%, and gains may owe capital-gains tax (a 1031 exchange can defer both). Figures are a year-1 estimate at your 24.0% rate — not tax advice; consult a CPA.
Schools (NCES district)
- District
- Broward
- NCES district ID
- 1200180
- Math proficiency
- 42% ▼ -18.00%
- Reading proficiency
- 53% ▼ -5.00%
- Median HH income
- $52,139
- Composite
- 40.88/100
- National rank
- #3621
- State rank
- #46 of 73 in FL
Livability — Hollywood
- Score
- 76/100
- State rank
- #232
- US rank
- #3548
Category grades
Schools grade is shown separately in the Schools card above.
Census & demographics
- Census place
- Hollywood, FL
- County
- Broward County · 1,963,430 people
- City population
- 109,079
- Metro
- Miami-Fort Lauderdale-Pompano Beach, FL
- Population (ZIP)
- 46,322
- Household income
- $56,473
- Rent vs Own
- Severe rent burden
- 3948.0
Population outlook (Broward County) Hauer SSP2
- Today (2025)
- 2,207,033 people
- By 2030
- 2,360,704 · +7.0%
- By 2040
- 2,661,208 · +20.6%
- By 2050
- 2,946,698 · +33.5%
- By 2075
- 3,602,273 · +63.2%
- By 2100
- 3,970,984 · +79.9%
Race, ethnicity, and origin ACS 2023
- Neighborhood character
- Diverse neighborhood (Simpson 0.68)
- Race & ethnicity
- Hispanic / Latino 43% Two or more races 31% White 28% Black 24% Asian 1%
- Hispanic origin (detail)
- Mexican 1% Puerto Rican 4% Cuban 9% Dominican 3% Salvadoran 3%
- Common ancestry
- Hispanic 5% Lithuanian 2% Scotch-Irish 1%
- Foreign-born
- 41% · Canada, Jamaica, Dominican Republic
- Languages at home
- 48% English-only · Spanish 38% French/Haitian/Cajun 6% Russian/Polish/Slavic 2%
Political lean MEDSL · Broward
- 2024 margin
- D (+17.0) · D 58.0% · R 41.0%
- 2008→2024 swing
- -17.8pp toward R · 2008: 34.7pp · 2024: 17.0pp
- All cycles
- 2024: D+17.0 2020: D+29.8 2016: D+35.0 2012: D+34.9 2008: D+34.7
Not yet ingested
- Civics
- —
Market trends
- HPI YoY
- ▼ -406.34%
- Current HPI
- 524.7664
- Rent YoY
- ▲ 0.43%
- Metro
- Miami-Fort Lauderdale-Pompano Beach, FL
- State GDP YoY
- ▲ 3.28%
- F500 in state
- 36
Industry mix (Fortune 500 HQ in FL)
| Industry | F500 HQs | Revenue |
|---|---|---|
| Industrial Technology | 2 | $29B |
|
||
| Insurance | 2 | $17B |
|
||
| Retail | 1 | $60B |
|
||
| Technology Distribution | 1 | $58B |
|
||
| Homebuilding | 1 | $35B |
|
||
| Technology Manufacturing | 1 | $35B |
|
||
Price history
+588.1% since first listed4 events — show timeline
- 2026-05-04 Listed $289,000 Beaches MLS
- 2021-02-19 Sold (Public Records) $170,000 Public Records
- 1994-02-03 Sold (Public Records) $45,000 Public Records
- 1990-12-04 Sold (Public Records) $42,000 Public Records
Property tax history
+11.5%/yrLatest (2025): $3,439 · +0.1% YoY. Source: county tax records.
Cash-flow waterfall
monthlySold comps — $/sqft
last 12 mo · ≤1 miLoading sold comps…