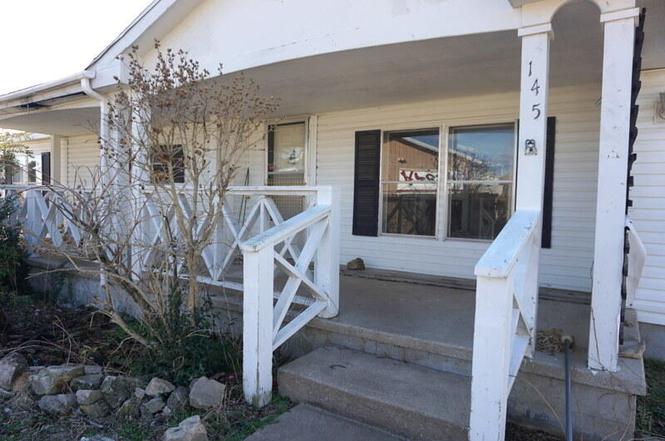
145 Matthew Ln · Hollister, MO
Flood risk 1/10 · Minimal
- FEMA flood zone
- X (unshaded)
- Chance of flooding over 30 yrs
- 0.0%
- Est. flood insurance / yr
- $473 – $860
Fire risk 4/10 · Minor
- Est. fire insurance / yr
- $1,054 – $1,958
Heat risk 5/10 · Moderate
- Hot days now (above 106°F)
- 7 days/yr
- Hot days in 30 yrs
- 20 days/yr
Wind risk 2/10 · Minimal
- Chance of severe wind over 30 yrs
- 1.0%
Air-quality risk 1/10 · Minimal
- Unhealthy air days now
- 0 days/yr
- Unhealthy air days in 30 yrs
- 0 days/yr
Risk factors via First Street. Map © Google.
Why this score? — see what drove the B- grade
The composite is a weighted blend of 9 inputs, each scored 0–100. Each bar is that input's sub-score; the figure is the points it added to the 100-point composite (weight × sub-score).
- Cash flow +30.0/30.0
- 1% rule +10.0/10.0
- DSCR +10.0/10.0
- ARV discount +7.5/15.0
- Schools +3.7/10.0
- Livability +3.6/5.0
- Rent growth +2.5/5.0
- Condition / age +2.5/5.0
- Appreciation +0.0/10.0
$65,000
🖨 Deal sheet 📄 Offer letter ✓ Due diligence
Listing remarks
THIS PROPERTY IS A FIXER UPPER. .. .. .. .. . IT WILL REQUIRE A CASH BUYER DUE TO THE CONDITION. .. MAYBE A CONSTRUCTION LOAN WOULD WORK BUT NOT CONFORMING FINANCING. .. ,. .. .. .. .LOCATED IN A GOOD SUBDIVISION OF DOUBLE WIDE MOBILE HOMES SELLLING FOR APPROX 170 to 180.
Key facts
- 0.25 acre lot
- Built 1994
- Listed 3 days
Neighborhood map
What this means for you Summary
Snapshot
- This is a 3-bed/2.0-bath manufactured listed at $65k.
Deal economics
- At list price, monthly cash flow is $646 ($8k/yr) — positive.
- The deal already cash-flows at list — no discount required.
- Meets the 1% rule at list price ($1k rent vs $65k).
- Cap rate 18.2% vs local median 2.5% in Hollister — top-decile yield for the area; either an underpriced asset or a hidden risk that comps aren't pricing in. Stress-test before assuming the spread holds.
Location & tenants
- Location reads 71/100 on livability (#109 in MO) — a middle-class / working-renter tenant base. Strengths: cost of living A+, housing A+, health & safety A+; Watch: amenities F, commute F, employment D-.
- Hollister R-V (town): math 40% / reading 49% proficiency, ranked #108 of 324 in MO (top 33%) — families likely to look elsewhere, expect single-tenant / working-renter base with shorter leases.
- Zoned schools: Hollister Elem. (math 43% / reading 50%, grade D-, #397 of 1,115 statewide, top 36%, 406 students, 66% FRL); Hollister Middle (math 35% / reading 44%, grade F, #189 of 391 statewide, top 51%, 291 students, 67% FRL); Hollister High (math 42% / reading 57%, grade D, #124 of 521 statewide, top 28%, 447 students, 54% FRL) — zoned schools at 62% FRL track the district average.
- Market conditions: 278 active listings in the ZIP; 3 comparable units currently listed for rent nearby; rentals lingering (median 44d on market — plan ~5-8 weeks vacancy on turnover, expect pricing pressure); 100% of comp listings sitting > 30 days — soft ceiling on asking rent; 331 units permitted in Taney County in 2024 (50 in 5+ unit buildings).
Forward outlook
- Local home prices are declining (-3.0%/yr); year-one equity from $449 of loan paydown is wiped out by about $2k of value loss. Plan a longer hold.
- Taney County population projected at +17% by 2050 — long-run rental-demand tailwind backs the buy-and-hold thesis.
- At projected returns (-3.0% appreciation + 3.0% rent growth), your $18k cash investment doubles in ~3 years — after that, you're playing with house money.
Negotiation context
- Only 3 days on market — expect competitive offers; lowballing is unlikely to land.
- 2 sale attempts with the ask held roughly flat each time — persistent listings suggest the price (not the market) is what's stuck; bring a comps-based counter.
Risks & watch-outs
- Climate carrying-cost: extreme-heat days projected 7→20/yr by 2055 (HVAC capex compounding) — expect insurance premiums to compound above CPI over the hold.
Questions for the listing agent
- Is there a deadline driving the sale (1031 exchange, divorce, estate, relocation)? That informs how much negotiation room exists.
- Schools are D-rated, which usually means shorter tenancies and higher turnover. Who's the typical renter profile here, and what's been the actual vacancy rate?
- What's the average days-on-market for RENTAL listings here right now (not sales)? A rising rental-DOM trend means longer vacancies and softer asking-rent achievability than the comps imply.
- What's the recent tenant-quality profile in this submarket — average credit score on applications, eviction rate, late-payment / NSF rate, and stable-employment percentage? A property-management company in the area should have these aggregated.
- How much new for-sale + rental construction is in the pipeline within 1–3 miles? Heavy new supply typically softens prices + rents 12–24 months out; constrained supply supports both.
Investment metrics
- 1% rule
- 2.08% ✓
- Cap rate
- 18.21%
- Cash-on-cash
- 42.57%
- DSCR
- 2.89
- GRM
- 4.0
CMA / ARV
No comps found within radius.
Projected returns pro-forma
-3.0% appreciation · 3.0% rent growth · sell at horizon
- IRR
- 39.3%
- Equity multiple
- 2.68×
- Total profit
- $30,588
- Equity at exit
- $9,692
- IRR
- 45.7%
- Equity multiple
- 5.37×
- Total profit
- $79,594
- Equity at exit
- $5,620
Cash invested: $18,200 (down + closing). Projections, not guarantees.
Landlord ↔ Tenant lean methodology
- Overall (STATE)
- 81 Strongly Landlord-Friendly
- State Missouri
- 81 Strongly Landlord-Friendly · R+10
- County
- — inherits STATE
- City
- — inherits STATE
ZIP-level market 65672
- Home prices YoY
- -12.6%
- Active inventory
- 278
- Price-to-rent
- 4.0×
Monthly cashflow live
- Estimated rent
- $1,351 medium interval (Pro) →
- Mortgage (P&I)
- −$341
- Tax from tax record
- −$54 /mo · $644/yr
- Insurance
- −$27
- HOA
- −$0
- Vacancy / Maint / Mgmt
- −$284
- Net cashflow
- $646
Break-even live
UW: 25.0% down · 7.5% · 30yr · 1.5% tax · 5.0% vac · 8.0% maint · 8.0% mgmt
Financing live
Cash to close
- Down payment
- $16,250
- Closing costs
- $1,950
- Reserves months
- —
- Total cash needed
- —
Loan-product check · same deal, 3 products live
Conventional
25% down · 7.5% · 30yr
- Down + closing
- —
- Monthly P&I
- —
- Monthly cashflow
- —
- DSCR
- —
- Eligible?
- —
Personal DTI + credit; lowest rate.
DSCR
20% down · 8.5% · 30yr
- Down + closing
- —
- Monthly P&I
- —
- Monthly cashflow
- —
- DSCR
- —
- Eligible?
- —
No personal income docs; deal must DSCR.
Hard money
10% down · 12.0% · 12mo
- Down + closing
- —
- Monthly P&I
- —
- Monthly cashflow
- —
- DSCR
- —
- Eligible?
- —
Short-term bridge; refi at stabilization.
Rent comps 3 comps
| Address | Beds | Baths | Sqft | Rent | $/sqft | DOM | Units | Dist |
|---|---|---|---|---|---|---|---|---|
| 934 Evergreen St Hollister, MO | 2.0 | 2.0 | 1458 | $1,600 | $1.10 | 43d | 1 | 0.50mi |
| KEH Hollister, MO | 3.0 | 2.0 | 1447 | $874 | $0.60 | 43d | 1 | 1.14mi |
| 172 Humanity Ln Unit D Branson, MO | 3.0 | 2.0 | 1200 | $1,200 | $1.00 | 43d | 1 | 1.47mi |
Listing history 5 events
-
2026-03-21status Pending
-
2026-03-20status Active
-
2026-02-19status Pending
-
2026-02-16$65,000 Active
-
1994-09-12soldstatus
ⓘ Source: listings_history table (triggers on properties + properties_extension) + one-shot
backfill from property_details.listing_events for pre-trigger history.
Tax reassessment forecast MO · Resets to sale price
- Current annual tax
- $644 · $54/mo
- Projected year-2 tax
- $644 · $54/mo
- Expected delta
- $0/yr ($0/mo · 0.0%)
ⓘ Screening estimate from a state-policy table — verify with the county assessor before closing.
Climate risk First Street
- Flood 1/10 Low FEMA zone X (unshaded) · 0% chance over 30 yrs
- Wildfire 4/10 Moderate
- Heat 5/10 Major 7 d/yr ≥106°F today · 20 d/yr by 30 yrs out
- Wind 2/10 Low 100% chance of damaging wind over 30 yrs
- Air quality 1/10 Low 0 unhealthy d/yr today · 0 by 30 yrs out
Nearby sold comps map
Loading sold comps map…
Walkable amenities ~0.75 mi
Loading nearby amenities…
Taxation est. · year 1
- Rental income
- $16,211
- − Mortgage interest
- −$3,641
- − Property taxes
- −$644
- − Insurance
- −$325
- − Repairs & maintenance
- −$1,297
- − Management
- −$1,297
- − Depreciation
- −$1,891
- Taxable income
- $7,116
- Est. tax owed @ 24.0%
- −$1,708
- After-tax cash flow
- $6,039/yr
For passive investors: Depreciation is non-cash, so a rental often shows a tax loss while cash-flowing — sheltering income. Rental losses are passive: they offset passive income freely, and up to $25,000/yr can offset ordinary (W-2) income if you actively participate and your MAGI is under $100k (phasing out to $0 by $150k); unused losses carry forward. On sale, claimed depreciation is recaptured at up to 25%, and gains may owe capital-gains tax (a 1031 exchange can defer both). Figures are a year-1 estimate at your 24.0% rate — not tax advice; consult a CPA.
Schools (NCES district)
- District
- Hollister R-V
- NCES district ID
- 2914550
- Math proficiency
- 40% ▲ 7.00%
- Reading proficiency
- 49% ▲ 5.00%
- Median HH income
- $38,213
- Composite
- 37.07/100
- National rank
- #4505
- State rank
- #108 of 324 in MO
Livability — Hollister
- Score
- 71/100
- State rank
- #109
- US rank
- #7035
Category grades
Schools grade is shown separately in the Schools card above.
Census & demographics
- Census place
- Hollister, MO
- Population (ZIP)
- 8,512
Population outlook (Taney County) Hauer SSP2
- Today (2025)
- 59,017 people
- By 2030
- 61,235 · +3.8%
- By 2040
- 65,225 · +10.5%
- By 2050
- 68,842 · +16.6%
- By 2075
- 77,705 · +31.7%
- By 2100
- 82,002 · +38.9%
Race, ethnicity, and origin ACS 2023
- Neighborhood character
- Predominantly White (89%)
- Race & ethnicity
- White 89% Hispanic / Latino 8% Two or more races 7%
- Hispanic origin (detail)
- Mexican 3% Cuban 2%
- Common ancestry
- Portuguese 4% Slovak 3% Iranian 2%
- Foreign-born
- 3% · Canada, Guatemala
- Languages at home
- 95% English-only · Spanish 4%
Political lean MEDSL · Taney
- 2024 margin
- Solid R (+59.3) · D 19.9% · R 79.2%
- 2008→2024 swing
- -22.2pp toward R · 2008: -37.2pp · 2024: -59.3pp
- All cycles
- 2024: R+59.3 2020: R+57.7 2016: R+59.3 2012: R+47.4 2008: R+37.2
Not yet ingested
- Civics
- —
Market trends
- HPI YoY
- ▼ -28.71%
- Current HPI
- 200.061
- Rent YoY
- —
- Metro
- —
- State GDP YoY
- ▲ 1.84%
- F500 in state
- 20
Industry mix (Fortune 500 HQ in MO)
| Industry | F500 HQs | Revenue |
|---|---|---|
| Healthcare | 1 | $163B |
|
||
| Insurance | 1 | $21B |
|
||
| Industrial Technology | 1 | $17B |
|
||
| Retail | 1 | $16B |
|
||
| Industrial Distribution | 1 | $10B |
|
||
| Utilities | 1 | $9B |
|
||
Price history
5 events — show timeline
- 2026-03-21 Pending — SOMO
- 2026-03-20 Relisted — SOMO
- 2026-02-19 Pending — SOMO
- 2026-02-16 Listed $65,000 SOMO
- 1994-09-12 Sold (Public Records) — Public Records
Property tax history
+0.9%/yrLatest (2025): $644 · -4.3% YoY. Source: county tax records.
Cash-flow waterfall
monthlySold comps — $/sqft
last 12 mo · ≤1 miLoading sold comps…