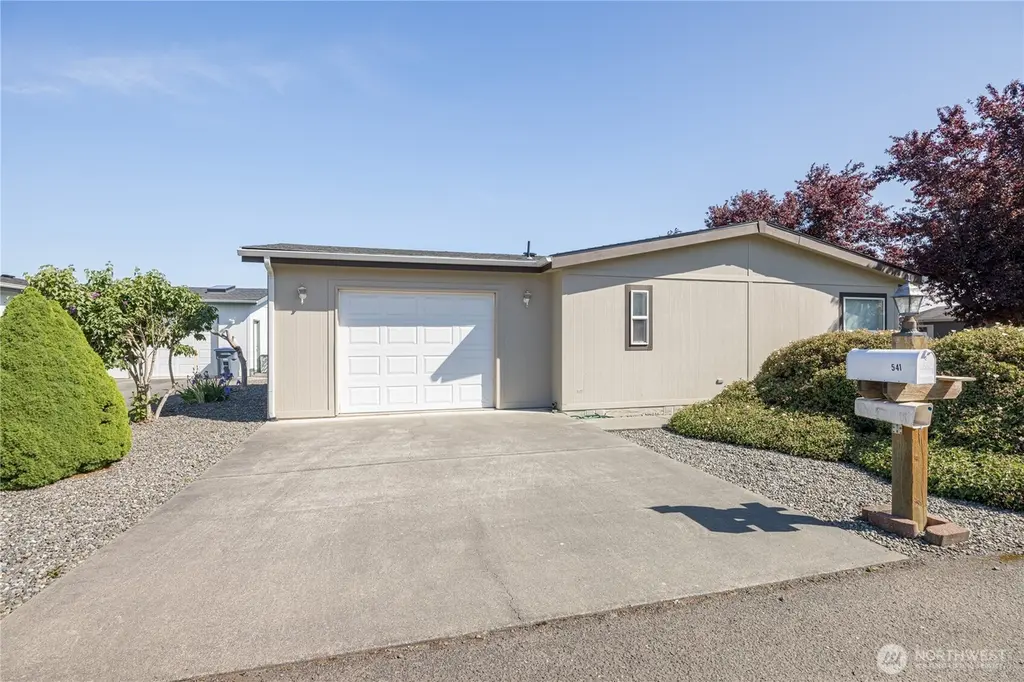
541 N 7th · Sequim, WA
Flood risk 1/10 · Minimal
- FEMA flood zone
- X
- Chance of flooding over 30 yrs
- 0.0%
- Est. flood insurance / yr
- $507 – $1,088
Fire risk 1/10 · Minimal
- Est. fire insurance / yr
- $604 – $1,122
Heat risk 2/10 · Minimal
- Hot days now (above 83°F)
- 7 days/yr
- Hot days in 30 yrs
- 17 days/yr
Wind risk 1/10 · Minimal
- Chance of severe wind over 30 yrs
- —
Air-quality risk 6/10 · Moderate
- Unhealthy air days now
- 7 days/yr
- Unhealthy air days in 30 yrs
- 8 days/yr
Risk factors via First Street. Map © Google.
Why this score? — see what drove the C grade
The composite is a weighted blend of 9 inputs, each scored 0–100. Each bar is that input's sub-score; the figure is the points it added to the 100-point composite (weight × sub-score).
- Cash flow +24.6/30.0
- DSCR +8.0/10.0
- 1% rule +6.4/10.0
- Schools +5.3/10.0
- Livability +3.5/5.0
- ARV discount +3.1/15.0
- Rent growth +2.5/5.0
- Condition / age +2.5/5.0
- Appreciation +0.0/10.0
$219,950
🖨 Deal sheet (PDF) 📄 Offer letter ✓ Due diligence
Listing remarks
Welcome to easy, comfortable living in the heart of Sequim! This well-maintained 3-bedroom, 2-bath home is located in the desirable Hendrickson Mobile Estates, a welcoming 55+ community known for its peaceful atmosphere and friendly neighbors. One of this home’s standout features is its excellent walkability. Ideally situated just minutes from downtown Sequim, you’ll enjoy convenient access to everyday essentials and local favorites—Safeway, shops, cafés, restaurants, and services are all nearby. Whether you’re heading out for groceries, grabbing coffee, or enjoying a leisurely stroll, this location makes it easy to stay active and connected without relying he
Key facts
- Versatile third room
- Garage
- Built 2003
Tags
Property features AI
Finance
- Other: Taxes reported (annual): $225
- Financial info: Listing terms include Cash, Conventional, FHA
- HOA & community: Land lease: $650
Exterior
- Parking: Individual garage (has garage)
- Utilities: Public water
- Home design: Manufactured double-wide home; One level; Manufactured house (double wide)
- Construction: Cement construction materials; Composition roof; Mobile home remains on site
- Exterior features: Cement/concrete exterior; Located in Hendrickson Park (park-approved for sale); Senior community
Interior
- Kitchen: Dishwasher; Refrigerator; Stove/Range
- Bedrooms: 3 bedrooms
- Flooring: Vinyl plank; Cement/Concrete exterior surfaces
- Bathrooms: 2 full bathrooms; 2 bathtubs; 2 showers
- Heating & cooling: Forced air heating; Electric energy source
- Interior features: Walk-in closet; Dishwasher; Dryer; Refrigerator; Stove/Range
- Laundry & utility: Washer; Dryer
Neighborhood map
What this means for you Summary
Snapshot
- This is a 3-bed/2.0-bath manufactured listed at $220k.
Deal economics
- At list price, monthly cash flow is $456 ($5k/yr) — positive.
- The deal already cash-flows at list — no discount required.
- Meets the 1% rule at list price ($3k rent vs $220k).
- Recommended offer: $213k (3.0% below list) — sets the bar for market timing.
- Cap rate 8.8% vs local median 3.1% in Sequim — top-decile yield for the area; either an underpriced asset or a hidden risk that comps aren't pricing in. Stress-test before assuming the spread holds.
Location & tenants
- Location reads 70/100 on livability (#245 in WA) — a middle-class / working-renter tenant base. Strengths: health & safety A+, crime B, cost of living B; Watch: employment D, amenities D-, commute F.
- Sequim School District (town): math 55% / reading 66% proficiency, ranked #64 of 291 in WA (top 22%) — acceptable for families but not a draw, mixed tenant base, ~2y average lease.
- Zoned schools: Greywolf Elementary School (524 students, 50% FRL); Sequim Middle School (568 students, 52% FRL); Sequim Senior High (794 students, 50% FRL).
- Market conditions: 605 active listings in the ZIP; 4 comparable units currently listed for rent nearby; rentals lingering (median 46d on market — plan ~5-8 weeks vacancy on turnover, expect pricing pressure); 100% of comp listings sitting > 30 days — soft ceiling on asking rent; 166 units permitted in Clallam County in 2024 (0 in 5+ unit buildings).
- This rent runs 40% of the median local income ($74k/yr) — at the standard rent-burdened threshold; future hikes will face affordability resistance.
Forward outlook
- Local home prices are declining (-3.0%/yr); year-one equity from $2k of loan paydown is wiped out by about $7k of value loss. Plan a longer hold.
- Clallam County population projected at +5% by 2050 — modest demand growth; plan on rents tracking national, not racing it.
Negotiation context
- It's been on market 42 days — a 3% lower offer ($213k) is reasonable based on typical stale-listing flexibility.
Questions for the listing agent
- It's been on market 42 days. Have you received any prior offers? Is the seller open to a 3% concession, seller financing, or rate buy-down credit?
- Is there a deadline driving the sale (1031 exchange, divorce, estate, relocation)? That informs how much negotiation room exists.
- Schools are B-rated — typically a magnet for longer-tenancy family renters. What's the average tenant stay here, and is there a school-zone premium baked into asking?
- What's the average days-on-market for RENTAL listings here right now (not sales)? A rising rental-DOM trend means longer vacancies and softer asking-rent achievability than the comps imply.
- What's the recent tenant-quality profile in this submarket — average credit score on applications, eviction rate, late-payment / NSF rate, and stable-employment percentage? A property-management company in the area should have these aggregated.
- How much new for-sale + rental construction is in the pipeline within 1–3 miles? Heavy new supply typically softens prices + rents 12–24 months out; constrained supply supports both.
Investment metrics
- 1% rule
- 1.14% ✓
- Cap rate
- 8.78%
- Cash-on-cash
- 8.88%
- DSCR
- 1.40
- GRM
- 7.3
CMA / ARV
- ARV (median comp)
- $200,313
- List price
- $219,950
- Delta
- 9.80%
- Verdict
- FAIR
- Comps
- 20 within 1.0 mi
Show comp detail 12 sales within ~0.75 mi
| Address | Dist | Beds/Ba | Sqft | Sold | Price | $/sf | Match |
|---|---|---|---|---|---|---|---|
| 747 W Heritage Loop | 0.08mi | 2/2.0 (-1) | 1,458 (+4%) | 1mo | $250,000 | $171 | 84 |
| 301 N 7th Ave #74 Ave | 0.18mi | 2/2.0 (-1) | 1,338 (-5%) | 2mo | $60,000 | $45 | 78 |
| 734 Heritage Loop | 0.09mi | 2/2.0 (-1) | 1,458 (+4%) | 9mo | $335,000 | $230 | 77 |
| 508 N 7th Ave | 0.09mi | 2/2.0 (-1) | 1,502 (+7%) | 3mo | $240,000 | $160 | 76 |
| 507 N 7th Ave | 0.07mi | 2/2.0 (-1) | 1,502 (+7%) | 5mo | $235,000 | $156 | 76 |
| 325 N Fifth Ave #34 | 0.25mi | 2/2.0 (-1) | 1,388 (-1%) | 9mo | $190,000 | $137 | 74 |
| 523 N 7th Ave | 0.02mi | 3/2.0 | 1,546 (+10%) | 10mo | $219,000 | $142 | 74 |
| 645 N 7th | 0.08mi | 3/2.0 | 1,612 (+15%) | 2mo | $249,950 | $155 | 70 |
| 19 Juniper Mobile Ests | 0.35mi | 2/2.0 (-1) | 1,344 (-4%) | 4mo | $97,000 | $72 | 68 |
| 51 Juniper Mobile Ests | 0.32mi | 2/2.0 (-1) | 1,442 (+3%) | 9mo | $135,000 | $94 | 68 |
| 610 N 7th Ave | 0.05mi | 3/2.0 | 1,600 (+14%) | 8mo | $205,000 | $128 | 68 |
| 713 W Heritage Loop | 0.11mi | 2/2.0 (-1) | 1,269 (-10%) | 8mo | $259,000 | $204 | 67 |
Match score weights: distance 35% · size 25% · config 20% · recency 20%. Top-matched comps best support the ARV.
Projected returns pro-forma
-3.0% appreciation · 3.0% rent growth · sell at horizon
- IRR
- -2.8%
- Equity multiple
- 0.89×
- Total profit
- $-6,566
- Equity at exit
- $32,795
- IRR
- 6.9%
- Equity multiple
- 1.52×
- Total profit
- $31,826
- Equity at exit
- $19,017
Cash invested: $61,586 (down + closing). Projections, not guarantees.
Landlord ↔ Tenant lean methodology
- Overall (STATE)
- 28 Tenant-Leaning
- State Washington
- 28 Tenant-Leaning · D+8
- County
- — inherits STATE
- City
- — inherits STATE
ZIP-level market 98382
- Active inventory
- 605
- Price-to-rent
- 7.3×
Monthly cashflow live
- Estimated rent
- $2,501 medium interval (Pro) →
- Mortgage (P&I)
- −$1,153
- Tax est. 1.5%
- −$275 /mo · $3,299/yr
- Insurance
- −$92
- HOA
- −$0
- Vacancy / Maint / Mgmt
- −$525
- Net cashflow
- $456
Break-even live
Sensitivity live
| Price | -10% $608 | -5% $532 | +0% $456 | +5% $380 | +10% $304 |
|---|---|---|---|---|---|
| Rent | -10% $258 | -5% $357 | +0% $456 | +5% $555 | +10% $654 |
| Rate | -1.0pp $567 | -0.5pp $512 | base $456 | +0.5pp $399 | +1.0pp $341 |
UW: 25.0% down · 7.5% · 30yr · 1.5% tax · 5.0% vac · 8.0% maint · 8.0% mgmt
Financing live
Cash to close
- Down payment
- $54,988
- Closing costs
- $6,598
- Reserves months
- —
- Total cash needed
- —
Loan-product check · same deal, 3 products live
Conventional
25% down · 7.5% · 30yr
- Down + closing
- —
- Monthly P&I
- —
- Monthly cashflow
- —
- DSCR
- —
- Eligible?
- —
Personal DTI + credit; lowest rate.
DSCR
20% down · 8.5% · 30yr
- Down + closing
- —
- Monthly P&I
- —
- Monthly cashflow
- —
- DSCR
- —
- Eligible?
- —
No personal income docs; deal must DSCR.
Hard money
10% down · 12.0% · 12mo
- Down + closing
- —
- Monthly P&I
- —
- Monthly cashflow
- —
- DSCR
- —
- Eligible?
- —
Short-term bridge; refi at stabilization.
Rent comps 4 comps
| Address | Beds | Baths | Sqft | Rent | $/sqft | DOM | Units | Dist |
|---|---|---|---|---|---|---|---|---|
| 850 Tommy Ct Sequim, WA | 3.0 | 2.0 | 1350 | $2,300 | $1.70 | 45d | 1 | 0.23mi |
| 522 W Evergreen Farm Way Sequim, WA | 2.0 | 2.0 | 1336 | $2,450 | $1.83 | 45d | 1 | 0.63mi |
| 246 W Maple St Sequim, WA | 3.0 | 2.0 | 1200 | $2,300 | $1.92 | 45d | 1 | 0.76mi |
| 1045 S 3rd Ave Unit 33 Sequim, WA | 2.0 | 1.5 | 956 | $2,100 | $2.20 | 45d | 1 | 1.12mi |
Listing history 17 events
-
2026-06-19days on market $219,950 Active 42 DOM
-
2026-06-18days on market $219,950 Active 41 DOM
-
2026-06-17days on market $219,950 Active 40 DOM
-
2026-06-16days on market $219,950 Active 39 DOM
-
2026-06-15days on market $219,950 Active 38 DOM
-
2026-06-14days on market $219,950 Active 36 DOM
-
2026-06-12days on market $219,950 Active 35 DOM
-
2026-06-09days on market $219,950 Active 32 DOM
-
2026-06-08days on market $219,950 Active 31 DOM
-
2026-06-07days on market $219,950 Active 30 DOM
-
2026-06-05days on market $219,950 Active 27 DOM
-
2026-06-03days on market $219,950 Active 26 DOM
-
2026-06-02days on market $219,950 Active 25 DOM
-
2026-06-01days on market $219,950 Active 24 DOM
-
2026-05-31days on market $219,950 Active 23 DOM
-
2026-05-30days on market $219,950 Active 22 DOM
-
2026-05-08$219,950 Active
ⓘ Source: listings_history table (triggers on properties + properties_extension) + one-shot
backfill from property_details.listing_events for pre-trigger history.
Climate risk First Street
- Flood 1/10 Low FEMA zone X · 0% chance over 30 yrs
- Wildfire 1/10 Low
- Heat 2/10 Low 7 d/yr ≥83°F today · 17 d/yr by 30 yrs out
- Wind 1/10 Low
- Air quality 6/10 Major 7 unhealthy d/yr today · 8 by 30 yrs out
Nearby sold comps map
Loading sold comps map…
Walkable amenities ~0.75 mi
Loading nearby amenities…
Taxation est. · year 1
- Rental income
- $30,014
- − Mortgage interest
- −$12,321
- − Property taxes
- −$3,299
- − Insurance
- −$1,100
- − Repairs & maintenance
- −$2,401
- − Management
- −$2,401
- − Depreciation
- −$6,399
- Taxable income
- $2,094
- Est. tax owed @ 24.0%
- −$503
- After-tax cash flow
- $4,968/yr
For passive investors: Depreciation is non-cash, so a rental often shows a tax loss while cash-flowing — sheltering income. Rental losses are passive: they offset passive income freely, and up to $25,000/yr can offset ordinary (W-2) income if you actively participate and your MAGI is under $100k (phasing out to $0 by $150k); unused losses carry forward. On sale, claimed depreciation is recaptured at up to 25%, and gains may owe capital-gains tax (a 1031 exchange can defer both). Figures are a year-1 estimate at your 24.0% rate — not tax advice; consult a CPA.
Schools (NCES district)
- District
- Sequim School District
- NCES district ID
- 5307830
- Math proficiency
- 55% ▼ -1.00%
- Reading proficiency
- 66% ▲ 1.00%
- Median HH income
- $46,969
- Composite
- 52.77/100
- National rank
- #3312
- State rank
- #64 of 291 in WA
Livability — Sequim
- Score
- 70/100
- State rank
- #245
- US rank
- #7845
Category grades
Schools grade is shown separately in the Schools card above.
Census & demographics
- Census place
- Sequim, WA
- County
- Clallam County · 31,052 people
- City population
- 31,052
- Metro
- Port Angeles, WA
- Population (ZIP)
- 31,052
- Household income
- $74,189
- Rent vs Own
- Severe rent burden
- 666.0
Population outlook (Clallam County) Hauer SSP2
- Today (2025)
- 76,817 people
- By 2030
- 78,177 · +1.8%
- By 2040
- 79,795 · +3.9%
- By 2050
- 80,890 · +5.3%
- By 2075
- 83,933 · +9.3%
- By 2100
- 82,141 · +6.9%
Race, ethnicity, and origin ACS 2023
- Neighborhood character
- Predominantly White (85%)
- Race & ethnicity
- White 85% Two or more races 7% Hispanic / Latino 4% Asian 2%
- Common ancestry
- Portuguese 5% Slovak 5% Italian 4%
- Foreign-born
- 6% · Canada
- Languages at home
- 95% English-only · Spanish 2% German/W. Germanic 1% Other Indo-European 1%
Political lean MEDSL · Clallam
- 2024 margin
- Lean D (+7.9) · D 52.6% · R 44.7% · Other 2.7%
- 2008→2024 swing
- +4.6pp toward D · 2008: 3.3pp · 2024: 7.9pp
- All cycles
- 2024: D+7.9 2020: D+3.4 2016: R+1.6 2012: D+0.4 2008: D+3.3
Not yet ingested
- Civics
- —
Market trends
- HPI YoY
- ▼ -225.89%
- Current HPI
- 181.4372
- Rent YoY
- —
- Metro
- Port Angeles, WA
- State GDP YoY
- ▲ 4.65%
- F500 in state
- 22
Industry mix (Fortune 500 HQ in WA)
| Industry | F500 HQs | Revenue |
|---|---|---|
| Retail | 2 | $269B |
|
||
| Technology / Retail | 1 | $638B |
|
||
| Technology | 1 | $245B |
|
||
| Telecommunications | 1 | $38B |
|
||
| Food / Beverage | 1 | $36B |
|
||
| Automotive / Trucks | 1 | $34B |
|
||
Price history
1 event — show timeline
- 2026-05-08 Listed $219,950 NWMLS as Distributed by MLS Grid
Property tax history
+1.0%/yrLatest (2026): $228 · +4.6% YoY. Source: county tax records.
Cash-flow waterfall
monthlySold comps — $/sqft
last 12 mo · ≤1 miLoading sold comps…