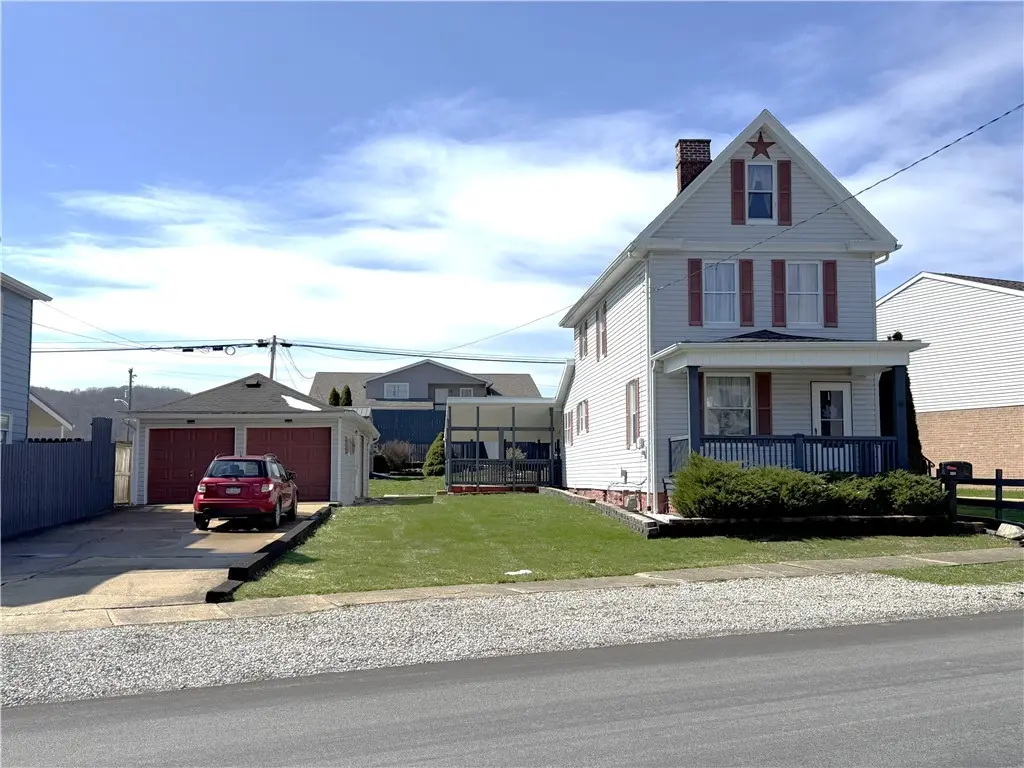
324 Arthur St · West Kittanning, PA
Flood risk 1/10 · Minimal
- FEMA flood zone
- X (unshaded)
- Chance of flooding over 30 yrs
- 0.0%
- Est. flood insurance / yr
- $507 – $1,088
Fire risk 1/10 · Minimal
- Est. fire insurance / yr
- $511 – $949
Heat risk 4/10 · Minor
- Hot days now (above 97°F)
- 7 days/yr
- Hot days in 30 yrs
- 18 days/yr
Wind risk 2/10 · Minimal
- Chance of severe wind over 30 yrs
- —
Air-quality risk 3/10 · Minor
- Unhealthy air days now
- 2 days/yr
- Unhealthy air days in 30 yrs
- 4 days/yr
Risk factors via First Street. Map © Google.
Why this score? — see what drove the D- grade
The composite is a weighted blend of 9 inputs, each scored 0–100. Each bar is that input's sub-score; the figure is the points it added to the 100-point composite (weight × sub-score).
- Appreciation +10.0/10.0
- Cash flow +8.8/30.0
- Schools +4.0/10.0
- Livability +3.9/5.0
- ARV discount +2.5/15.0
- Rent growth +2.5/5.0
- Condition / age +2.5/5.0
- DSCR +2.4/10.0
- 1% rule +1.7/10.0
$165,000
🖨 Deal sheet (PDF) 📄 Offer letter ✓ Due diligence
Listing remarks
Welcome to this charming two-story 2 or 3 bedroom home situated on a . 25-acre lot in West Kittanning. From the moment you arrive, you’ll appreciate the thoughtful updates and inviting layout this home has to offer. The newly remodeled kitchen features ample cabinet space and newer appliances, making it both functional and stylish. Just off the kitchen, you’ll find a convenient main-floor laundry area with additional cabinetry and a powder room. A cozy breakfast nook with newer LVP flooring provides the perfect spot for casual dining, while the spacious formal dining room with elegant wainscoting is ideal for entertaining, or can be used as the family room. The main floor is com
Key facts
- Versatile third room
- 0.25 acre lot
- Garage
Tags
Property features AI
Finance
- HOA & community: Public transportation nearby
Exterior
- Parking: Detached garage; Off-street parking; Total parking for 4 vehicles
- Utilities: Public water; Public sewer
- Home design: 2-story vinyl-sided home; Asphalt roof; Resale property
- Construction: Vinyl siding construction; Asphalt roof
- Exterior features: Quarter-acre lot
Interior
- Kitchen: Stove; Refrigerator
- Bedrooms: Bedroom (Upper level); Additional bedroom-sized room (Upper level) — 12x11; Den/bonus/extra rooms available (Upper level) — Bonus Room 26x9; Den 15x13
- Flooring: Carpet
- Bathrooms: 1 full bathroom; 1 half bathroom
- Heating & cooling: Gas forced-air heating; Central air conditioning
- Interior features: Multi-pane windows; Full interior-entry basement
- Laundry & utility: Washer; Dryer; Main-level laundry room 11x8
Neighborhood map
What this means for you Summary
Snapshot
- This is a 3-bed/1.0-bath single-family listed at $165k.
Deal economics
- At list price, monthly cash flow is $-134 ($-2k/yr) — negative.
- To cash-flow at today's rent, offer at most $141k (14.4% below list).
- To meet the 1% rule (rent ≥ 1% of price), the offer needs to be $111k (32.6% below list).
- Recommended offer: $111k (32.6% below list) — sets the bar for 1% rule.
Location & tenants
- Location reads 78/100 on livability (#296 in PA, #2,630 nationally) — a middle-class / working-renter tenant base. Strengths: crime A+, cost of living A+, housing A+; Watch: employment D, amenities F, commute F.
- Armstrong SD (rural): math 38% / reading 58% proficiency, ranked #233 of 539 in PA (top 43%) — families likely to look elsewhere, expect single-tenant / working-renter base with shorter leases.
- Zoned schools: West Hills Primary Sch (math 52% / reading 62%, grade C+, #444 of 1,518 statewide, top 32%, 548 students, 100% FRL); West Hills Intermediate Sch (math 37% / reading 59%, grade C-, #153 of 512 statewide, top 30%, 475 students, 100% FRL); Armstrong Jshs (math 37% / reading 55%, grade D-, #178 of 437 statewide, top 42%, 1,478 students, 100% FRL) — zoned schools average 100% FRL vs 37% district-wide (63 pts higher); higher-poverty schools than district average — tighter screening recommended.
- Market conditions: 31 active listings in the ZIP; 58 units permitted in Armstrong County in 2024 (20 in 5+ unit buildings).
Forward outlook
- In year one you build about $18k of equity ($1k loan paydown + $16k appreciation (10.0% local appreciation)).
- Armstrong County population projected at -27% by 2050 — secular population decline; favor cash flow + early exit over multi-decade hold.
- By year 3, paydown + projected appreciation supports a ~$45k cash-out refi (75% LTV) — recoverable capital for the next deal without selling this one.
Negotiation context
- It's been on market 76 days — a 6% lower offer ($155k) is reasonable based on typical stale-listing flexibility.
- Current owner paid $20k; list at $165k implies a 725% gain — meaningful room to come down on a strong offer.
Risks & watch-outs
- Watch-outs: built in 1900 — expect roof / HVAC / electrical / plumbing capex.
Questions for the listing agent
- What do current leases actually rent for vs. the listed asking? Can we see a recent rent roll and the last 12 months of T-12 income?
- It's been on market 76 days. Have you received any prior offers? Is the seller open to a 33% concession, seller financing, or rate buy-down credit?
- Built in 1900 — when were the roof, HVAC, electrical panel, plumbing, and water heater last replaced?
- Why hasn't it sold? Are there any deal-killer items the seller is aware of (foundation, flood, title, zoning, code violations)?
- Is there a deadline driving the sale (1031 exchange, divorce, estate, relocation)? That informs how much negotiation room exists.
- The area grade is low — what's the realistic commute time and amenity access for the typical tenant pool here? Any planned neighborhood developments (good or bad) we should know about?
- What's the average days-on-market for RENTAL listings here right now (not sales)? A rising rental-DOM trend means longer vacancies and softer asking-rent achievability than the comps imply.
- What's the recent tenant-quality profile in this submarket — average credit score on applications, eviction rate, late-payment / NSF rate, and stable-employment percentage? A property-management company in the area should have these aggregated.
- How much new for-sale + rental construction is in the pipeline within 1–3 miles? Heavy new supply typically softens prices + rents 12–24 months out; constrained supply supports both.
Investment metrics
- 1% rule
- 0.67% ✗
- Cap rate
- 5.32%
- Cash-on-cash
- -3.49%
- DSCR
- 0.84
- GRM
- 12.4
CMA / ARV
- ARV (on-the-fly)
- $148,352
- Comps found
- 12
Show comp detail 12 sales within ~0.75 mi
| Address | Dist | Beds/Ba | Sqft | Sold | Price | $/sf | Match |
|---|---|---|---|---|---|---|---|
| 306 Cleveland St | 0.08mi | 3/2.0 | 1,232 (+1%) | 1mo | $149,900 | $122 | 90 |
| 115 Residential Ave | 0.08mi | 2/1.0 (-1) | 1,200 (-1%) | 10mo | $115,000 | $96 | 80 |
| 309 Cleveland St | 0.10mi | 3/2.0 | 1,260 (+4%) | 16mo | $177,500 | $141 | 72 |
| 317 Mckinley St | 0.14mi | 3/1.0 | 1,048 (-14%) | 4mo | $115,000 | $110 | 67 |
| 216 Pine Hill Rd | 0.52mi | 3/1.5 | 1,300 (+7%) | 2mo | $190,000 | $146 | 61 |
| 711 S Harrison St | 0.43mi | 2/1.0 (-1) | 1,268 (+4%) | 8mo | $215,000 | $170 | 61 |
| 701 S Harrison St | 0.38mi | 3/1.0 | 1,350 (+11%) | 8mo | $220,000 | $163 | 57 |
| 226 Ridge Ave | 0.34mi | 4/1.5 (+1) | 1,342 (+10%) | 3mo | $25,000 | $19 | 57 |
| 354 Franklin Hill Rd | 0.55mi | 3/1.5 | 1,058 (-13%) | 10mo | $162,500 | $154 | 42 |
| 504 N Water St | 0.71mi | 3/1.0 | 1,152 (-5%) | 19mo | $125,000 | $109 | 42 |
| 540 N Water St | 0.75mi | 2/1.0 (-1) | 1,266 (+4%) | 15mo | $91,500 | $72 | 41 |
| 215 Pine Hill Rd | 0.52mi | 2/1.0 (-1) | 1,044 (-14%) | 22mo | $125,000 | $120 | 28 |
Match score weights: distance 35% · size 25% · config 20% · recency 20%. Top-matched comps best support the ARV.
Projected returns pro-forma
10.0% appreciation · 3.0% rent growth · sell at horizon
- IRR
- 21.8%
- Equity multiple
- 2.76×
- Total profit
- $81,244
- Equity at exit
- $148,645
- IRR
- 19.6%
- Equity multiple
- 6.32×
- Total profit
- $245,859
- Equity at exit
- $320,559
Cash invested: $46,200 (down + closing). Projections, not guarantees.
Landlord ↔ Tenant lean methodology
- Overall (STATE)
- 62 Landlord-Friendly
- State Pennsylvania
- 62 Landlord-Friendly · EVEN
- County
- — inherits STATE
- City
- — inherits STATE
ZIP-level market 16201
- Home prices YoY
- 10.0%
- Active inventory
- 31
- Price-to-rent
- 12.4×
Monthly cashflow live
- Estimated rent
- $1,113 medium interval (Pro) →
- Mortgage (P&I)
- −$865
- Tax from tax record
- −$80 /mo · $954/yr
- Insurance
- −$69
- HOA
- −$0
- Vacancy / Maint / Mgmt
- −$234
- Net cashflow
- $-134
Break-even live
Sensitivity live
| Price | -10% $-41 | -5% $-88 | +0% $-134 | +5% $-181 | +10% $-228 |
|---|---|---|---|---|---|
| Rent | -10% $-222 | -5% $-178 | +0% $-134 | +5% $-90 | +10% $-46 |
| Rate | -1.0pp $-51 | -0.5pp $-92 | base $-134 | +0.5pp $-177 | +1.0pp $-221 |
UW: 25.0% down · 7.5% · 30yr · 1.5% tax · 5.0% vac · 8.0% maint · 8.0% mgmt
Financing live
Cash to close
- Down payment
- $41,250
- Closing costs
- $4,950
- Reserves months
- —
- Total cash needed
- —
Loan-product check · same deal, 3 products live
Conventional
25% down · 7.5% · 30yr
- Down + closing
- —
- Monthly P&I
- —
- Monthly cashflow
- —
- DSCR
- —
- Eligible?
- —
Personal DTI + credit; lowest rate.
DSCR
20% down · 8.5% · 30yr
- Down + closing
- —
- Monthly P&I
- —
- Monthly cashflow
- —
- DSCR
- —
- Eligible?
- —
No personal income docs; deal must DSCR.
Hard money
10% down · 12.0% · 12mo
- Down + closing
- —
- Monthly P&I
- —
- Monthly cashflow
- —
- DSCR
- —
- Eligible?
- —
Short-term bridge; refi at stabilization.
Listing history 7 events
-
2026-06-04statusdays on market $165,000 Pending 76 DOM
-
2026-06-02days on market $165,000 Contingent 75 DOM
-
2026-06-01days on market $165,000 Contingent 74 DOM
-
2026-05-31days on market $165,000 Contingent 73 DOM
-
2026-04-20historical Contingent
-
2026-03-19$165,000 Active
-
1995-08-15soldstatus $20,000
ⓘ Source: listings_history table (triggers on properties + properties_extension) + one-shot
backfill from property_details.listing_events for pre-trigger history.
Tax reassessment forecast PA · Partial reset (capped growth)
- Current annual tax
- $954 · $80/mo
- Projected year-2 tax
- $1,781 · $148/mo
- Expected delta
- +$826/yr (+$69/mo · 86.6%)
ⓘ Screening estimate from a state-policy table — verify with the county assessor before closing.
Climate risk First Street
- Flood 1/10 Low FEMA zone X (unshaded) · 0% chance over 30 yrs
- Wildfire 1/10 Low
- Heat 4/10 Moderate 7 d/yr ≥97°F today · 18 d/yr by 30 yrs out
- Wind 2/10 Low
- Air quality 3/10 Moderate 2 unhealthy d/yr today · 4 by 30 yrs out
Nearby sold comps map
Loading sold comps map…
Walkable amenities ~0.75 mi
Loading nearby amenities…
Taxation est. · year 1
- Rental income
- $13,355
- − Mortgage interest
- −$9,243
- − Property taxes
- −$954
- − Insurance
- −$825
- − Repairs & maintenance
- −$1,068
- − Management
- −$1,068
- − Depreciation
- −$4,800
- Taxable loss
- −$4,604
- Est. tax savings @ 24.0%
- +$1,105
- After-tax cash flow
- $-508/yr
For passive investors: Depreciation is non-cash, so a rental often shows a tax loss while cash-flowing — sheltering income. Rental losses are passive: they offset passive income freely, and up to $25,000/yr can offset ordinary (W-2) income if you actively participate and your MAGI is under $100k (phasing out to $0 by $150k); unused losses carry forward. On sale, claimed depreciation is recaptured at up to 25%, and gains may owe capital-gains tax (a 1031 exchange can defer both). Figures are a year-1 estimate at your 24.0% rate — not tax advice; consult a CPA.
Schools (NCES district)
- District
- Armstrong SD
- NCES district ID
- 4202590
- Math proficiency
- 38% ▼ -13.00%
- Reading proficiency
- 58% ▼ -6.00%
- Median HH income
- $43,333
- Composite
- 40.41/100
- National rank
- #3729
- State rank
- #233 of 539 in PA
Livability — West Kittanning
- Score
- 78/100
- State rank
- #296
- US rank
- #2630
Category grades
Schools grade is shown separately in the Schools card above.
Census & demographics
- Census place
- West Kittanning, PA
- Population (ZIP)
- 16,734
Population outlook (Armstrong County) Hauer SSP2
- Today (2025)
- 62,513 people
- By 2030
- 59,579 · -4.7%
- By 2040
- 52,890 · -15.4%
- By 2050
- 45,904 · -26.6%
- By 2075
- 32,023 · -48.8%
- By 2100
- 20,415 · -67.3%
Race, ethnicity, and origin ACS 2023
- Neighborhood character
- Predominantly White (94%)
- Race & ethnicity
- White 94% Two or more races 4% Hispanic / Latino 2% Black 1%
- Common ancestry
- Romanian 8% Slovak 2% Iranian 1%
- Foreign-born
- 1% · Canada
- Languages at home
- 98% English-only · Spanish 1%
Political lean MEDSL · Armstrong
- 2024 margin
- Solid R (+53.2) · D 23.0% · R 76.2%
- 2008→2024 swing
- -28.6pp toward R · 2008: -24.6pp · 2024: -53.2pp
- All cycles
- 2024: R+53.2 2020: R+52.3 2016: R+52.0 2012: R+37.2 2008: R+24.6
Not yet ingested
- Civics
- —
Market trends
- HPI YoY
- ▲ 24.52%
- Current HPI
- 270.2649
- Rent YoY
- —
- Metro
- —
- State GDP YoY
- ▲ 1.68%
- F500 in state
- 34
Industry mix (Fortune 500 HQ in PA)
| Industry | F500 HQs | Revenue |
|---|---|---|
| Healthcare | 2 | $309B |
|
||
| Insurance | 2 | $27B |
|
||
| Telecommunications / Media | 1 | $124B |
|
||
| Industrial Distribution | 1 | $22B |
|
||
| Financial Services | 1 | $20B |
|
||
| Chemicals / Materials | 1 | $18B |
|
||
Price history
+725.0% since first listed3 events — show timeline
- 2026-04-20 Contingent — West Penn MLS
- 2026-03-19 Listed $165,000 West Penn MLS
- 1995-08-15 Sold (Public Records) $20,000 Public Records
Property tax history
+0.9%/yrLatest (2026): $954 · +0.0% YoY. Source: county tax records.
Cash-flow waterfall
monthlySold comps — $/sqft
last 12 mo · ≤1 miLoading sold comps…