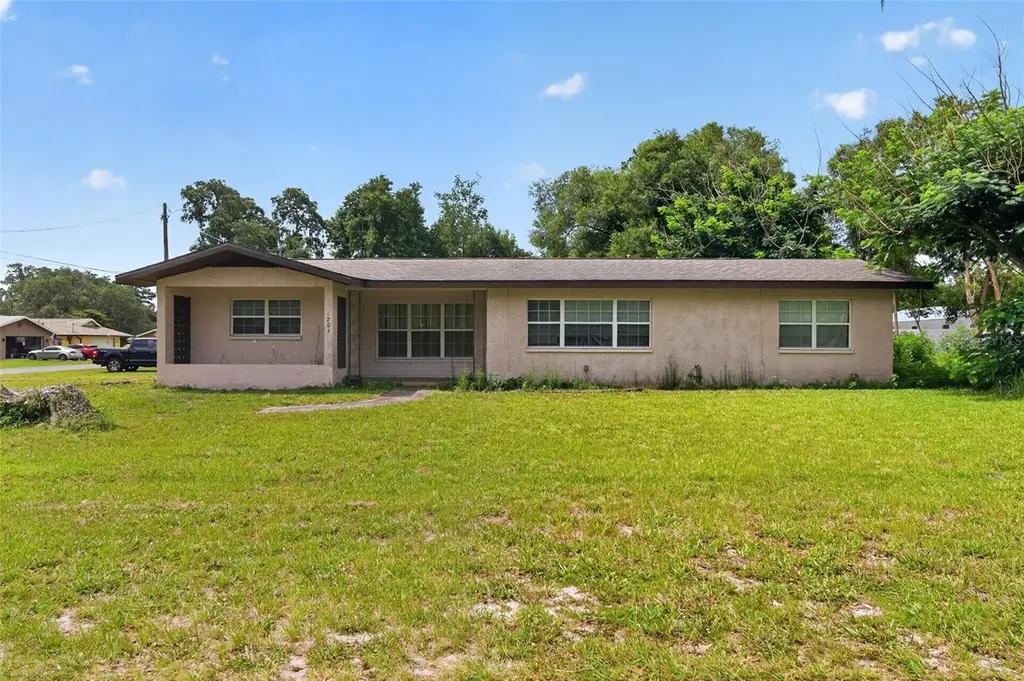
1705 Eden Dr · Inverness, FL
Flood risk 1/10 · Minimal
- FEMA flood zone
- X (unshaded)
- Chance of flooding over 30 yrs
- 0.0%
- Est. flood insurance / yr
- $507 – $1,088
Fire risk 4/10 · Minor
- Est. fire insurance / yr
- $947 – $1,759
Heat risk 9/10 · Severe
- Hot days now (above 107°F)
- 7 days/yr
- Hot days in 30 yrs
- 24 days/yr
Wind risk 9/10 · Severe
- Chance of severe wind over 30 yrs
- 99.0%
Air-quality risk 1/10 · Minimal
- Unhealthy air days now
- 0 days/yr
- Unhealthy air days in 30 yrs
- 0 days/yr
Risk factors via First Street. Map © Google.
Why this score? — see what drove the D+ grade
The composite is a weighted blend of 9 inputs, each scored 0–100. Each bar is that input's sub-score; the figure is the points it added to the 100-point composite (weight × sub-score).
- ARV discount +15.0/15.0
- Cash flow +13.6/30.0
- DSCR +4.1/10.0
- Schools +4.1/10.0
- 1% rule +3.8/10.0
- Livability +3.4/5.0
- Rent growth +2.5/5.0
- Condition / age +2.5/5.0
- Appreciation +0.0/10.0
$200,000
🖨 Deal sheet 📄 Offer letter ✓ Due diligence
Listing remarks
Welcome home to this spacious 3-bedroom, 2-bath single-family residence located in the heart of Inverness. Situated on a generously sized lot, this property offers plenty of outdoor space for entertaining, gardening, or storing your recreational toys. Inside, you'll find a functional layout with comfortable living areas, ample natural light, and great potential to make it your own. The large yard provides privacy and room to enjoy Florida living year-round. Conveniently located near shopping, dining, schools, parks, lakes, and all that Citrus County's Nature Coast lifestyle has to offer.
Key facts
- Ample natural light
- Generously sized lot
- Large yard
Tags
Property features AI
Finance
- Other: Property classified as residential, single family; Lot approximately 0.32 acres (dimensions ~115 x 72); Living area about 1,776 square feet
- HOA & community: No association indicated; No association approval required
Exterior
- Utilities: Public utilities; Sewer: Other; Water source: See remarks
- Home design: Single family residence; Single-story (One level); East-facing
- Construction: Block construction; Other roof; Slab foundation; Built on one level
- Exterior features: Other exterior features; Asphalt road access
Interior
- Kitchen: Refrigerator
- Bedrooms: 3 bedrooms
- Flooring: Other flooring
- Bathrooms: 2 full bathrooms
- Heating & cooling: Central heating; Central air conditioning
- Interior features: Living room and dining room combined; Split bedroom floorplan
- Laundry & utility: Laundry located inside
Neighborhood map
What this means for you Summary
Snapshot
- This is a 3-bed/2.0-bath single-family listed at $200k.
Deal economics
- At list price, monthly cash flow is $11 ($128/yr) — positive.
- The deal already cash-flows at list — no discount required.
- To meet the 1% rule (rent ≥ 1% of price), the offer needs to be $175k (12.3% below list).
- Recommended offer: $175k (12.3% below list) — sets the bar for 1% rule.
- Cap rate 6.4% vs local median 4.9% in Inverness — meaningfully above typical; check what's discounted (condition, days-on-market, listing class) to confirm the premium yield is real.
Location & tenants
- Location reads 67/100 on livability (#564 in FL) — a middle-class / working-renter tenant base. Strengths: cost of living A+, housing A-; Watch: health & safety C-, amenities F, commute F.
- Citrus (rural): math 49% / reading 50% proficiency, ranked #44 of 73 in FL (top 60%) — families likely to look elsewhere, expect single-tenant / working-renter base with shorter leases.
- Market conditions: 208 active listings in the ZIP; 9 comparable units currently listed for rent nearby; rentals at typical pace (median 21d on market — plan ~3-4 weeks tenant-placement turnaround); 2,443 units permitted in Citrus County in 2024 (0 in 5+ unit buildings).
Forward outlook
- Local home prices are declining (-3.0%/yr); year-one equity from $1k of loan paydown is wiped out by about $6k of value loss. Plan a longer hold.
- Citrus County population projected to shrink 10% by 2050 — rents likely to lag national; underwrite the cash flow, not the appreciation.
Negotiation context
- Only 7 days on market — expect competitive offers; lowballing is unlikely to land.
- Current owner paid $162k; 23% above their basis — modest negotiation headroom, anchor on the comps not their cost.
Risks & watch-outs
- Climate carrying-cost: severe wind risk, 99% chance of damaging wind over 30y; extreme-heat days projected 7→24/yr by 2055 (HVAC capex compounding) — expect insurance premiums to compound above CPI over the hold.
Questions for the listing agent
- Built in 1961 — when were the roof, HVAC, electrical panel, plumbing, and water heater last replaced?
- Is there a deadline driving the sale (1031 exchange, divorce, estate, relocation)? That informs how much negotiation room exists.
- Schools are B-rated — typically a magnet for longer-tenancy family renters. What's the average tenant stay here, and is there a school-zone premium baked into asking?
- The area grade is low — what's the realistic commute time and amenity access for the typical tenant pool here? Any planned neighborhood developments (good or bad) we should know about?
- What's the average days-on-market for RENTAL listings here right now (not sales)? A rising rental-DOM trend means longer vacancies and softer asking-rent achievability than the comps imply.
- What's the recent tenant-quality profile in this submarket — average credit score on applications, eviction rate, late-payment / NSF rate, and stable-employment percentage? A property-management company in the area should have these aggregated.
- How much new for-sale + rental construction is in the pipeline within 1–3 miles? Heavy new supply typically softens prices + rents 12–24 months out; constrained supply supports both.
Investment metrics
- 1% rule
- 0.88% ✗
- Cap rate
- 6.36%
- Cash-on-cash
- 0.23%
- DSCR
- 1.01
- GRM
- 9.5
CMA / ARV
- ARV (on-the-fly)
- $264,624
- Comps found
- 12
Show comp detail 12 sales within ~0.75 mi
| Address | Dist | Beds/Ba | Sqft | Sold | Price | $/sf | Match |
|---|---|---|---|---|---|---|---|
| 1801 Eden Dr | 0.03mi | 3/2.0 | 1,694 (-5%) | 10mo | $200,000 | $118 | 83 |
| 1309 Emerson St | 0.37mi | 3/2.0 | 1,760 (-1%) | 4mo | $160,000 | $91 | 78 |
| 729 Sinclair Ter | 0.08mi | 4/2.0 (+1) | 1,907 (+7%) | 10mo | $315,000 | $165 | 70 |
| 1809 Teasdale St | 0.20mi | 3/2.0 | 1,588 (-11%) | 4mo | $250,000 | $157 | 70 |
| 2316 S Shelly Ave | 0.20mi | 3/2.0 | 1,985 (+12%) | 10mo | $324,500 | $163 | 63 |
| 1403 Lake Shore Dr | 0.29mi | 3/2.0 | 1,541 (-13%) | 3mo | $230,000 | $149 | 62 |
| 2319 S Shelly Ave | 0.19mi | 3/2.0 | 1,515 (-15%) | 10mo | $330,685 | $218 | 58 |
| 810 Eden Dr | 0.74mi | 3/2.0 | 1,745 (-2%) | 8mo | $269,800 | $155 | 56 |
| 7555 E Shore Dr | 0.60mi | 4/2.0 (+1) | 1,760 (-1%) | 12mo | $151,250 | $86 | 55 |
| 1303 Claymore St | 0.41mi | 3/3.0 | 1,917 (+8%) | 14mo | $221,000 | $115 | 52 |
| 1215 E Bucknell Ave | 0.73mi | 3/2.0 | 1,921 (+8%) | 9mo | $170,100 | $89 | 45 |
| 1880 S Westlake Dr | 0.75mi | 4/2.5 (+1) | 1,922 (+8%) | 6mo | $278,000 | $145 | 39 |
Match score weights: distance 35% · size 25% · config 20% · recency 20%. Top-matched comps best support the ARV.
Projected returns pro-forma
-3.0% appreciation · 3.0% rent growth · sell at horizon
- IRR
- -15.9%
- Equity multiple
- 0.43×
- Total profit
- $-31,706
- Equity at exit
- $29,821
- IRR
- -7.5%
- Equity multiple
- 0.52×
- Total profit
- $-26,643
- Equity at exit
- $17,292
Cash invested: $56,000 (down + closing). Projections, not guarantees.
Landlord ↔ Tenant lean methodology
- Overall (STATE)
- 87 Strongly Landlord-Friendly
- State Florida
- 87 Strongly Landlord-Friendly · R+3
- County
- — inherits STATE
- City
- — inherits STATE
ZIP-level market 34450
- Home prices YoY
- -18.7%
- Active inventory
- 208
- Price-to-rent
- 9.5×
Monthly cashflow live
- Estimated rent
- $1,753 high interval (Pro) →
- Mortgage (P&I)
- −$1,049
- Tax from tax record
- −$242 /mo · $2,906/yr
- Insurance
- −$83
- HOA
- −$0
- Vacancy / Maint / Mgmt
- −$368
- Net cashflow
- $11
Break-even live
UW: 25.0% down · 7.5% · 30yr · 1.5% tax · 5.0% vac · 8.0% maint · 8.0% mgmt
Financing live
Cash to close
- Down payment
- $50,000
- Closing costs
- $6,000
- Reserves months
- —
- Total cash needed
- —
Loan-product check · same deal, 3 products live
Conventional
25% down · 7.5% · 30yr
- Down + closing
- —
- Monthly P&I
- —
- Monthly cashflow
- —
- DSCR
- —
- Eligible?
- —
Personal DTI + credit; lowest rate.
DSCR
20% down · 8.5% · 30yr
- Down + closing
- —
- Monthly P&I
- —
- Monthly cashflow
- —
- DSCR
- —
- Eligible?
- —
No personal income docs; deal must DSCR.
Hard money
10% down · 12.0% · 12mo
- Down + closing
- —
- Monthly P&I
- —
- Monthly cashflow
- —
- DSCR
- —
- Eligible?
- —
Short-term bridge; refi at stabilization.
Rent comps 9 comps
| Address | Beds | Baths | Sqft | Rent | $/sqft | DOM | Units | Dist |
|---|---|---|---|---|---|---|---|---|
| 732 Sinclair Ter Inverness, FL | 3.0 | 2.0 | 1347 | $1,700 | $1.26 | 21d | 1 | 0.10mi |
| 1017 Carnegie Dr Inverness, FL | 3.0 | 2.0 | 1334 | $1,800 | $1.35 | 21d | 1 | 0.47mi |
| 1112 Eden Dr Inverness, FL | 3.0 | 2.0 | 1334 | $1,750 | $1.31 | 21d | 1 | 0.50mi |
| 908 Columbia Ln Inverness, FL | 3.0 | 2.0 | 1334 | $1,800 | $1.35 | 21d | 1 | 0.94mi |
| 415 W Circlewood St Inverness, FL | 3.0 | 2.0 | 1621 | $1,850 | $1.14 | 21d | 1 | 1.15mi |
| 6874 E Culpepper Ct Inverness, FL | 2.0 | 2.0 | 1233 | $1,600 | $1.30 | 21d | 1 | 1.17mi |
| 608 Whitney Ave Inverness, FL | 3.0 | 2.0 | 1288 | $1,660 | $1.29 | 21d | 1 | 1.22mi |
| 3521 S Belgrave Dr Inverness, FL | 2.0 | 2.0 | 1554 | $2,250 | $1.45 | 21d | 1 | 1.27mi |
| 3367 S Dalton Ter Inverness, FL | 3.0 | 2.0 | 1357 | $1,795 | $1.32 | 21d | 1 | 1.38mi |
Listing history 7 events
-
2026-06-19days on market $200,000 Active 7 DOM
-
2026-06-18days on market $200,000 Active 6 DOM
-
2026-06-17days on market $200,000 Active 5 DOM
-
2026-06-16days on market $200,000 Active 4 DOM
-
2026-06-15days on market $200,000 Active 3 DOM
-
2026-06-13remarks 594-char remark
-
2026-06-13$200,000 Active 1 DOM
ⓘ Source: listings_history table (triggers on properties + properties_extension) + one-shot
backfill from property_details.listing_events for pre-trigger history.
Tax reassessment forecast FL · Resets to sale price
- Current annual tax
- $2,906 · $242/mo
- Projected year-2 tax
- $2,906 · $242/mo
- Expected delta
- $0/yr ($0/mo · 0.0%)
ⓘ Screening estimate from a state-policy table — verify with the county assessor before closing.
Climate risk First Street
- Flood 1/10 Low FEMA zone X (unshaded) · 0% chance over 30 yrs
- Wildfire 4/10 Moderate
- Heat 9/10 Extreme 7 d/yr ≥107°F today · 24 d/yr by 30 yrs out
- Wind 9/10 Extreme 99% chance of damaging wind over 30 yrs
- Air quality 1/10 Low 0 unhealthy d/yr today · 0 by 30 yrs out
Nearby sold comps map
Loading sold comps map…
Walkable amenities ~0.75 mi
Loading nearby amenities…
Taxation est. · year 1
- Rental income
- $21,039
- − Mortgage interest
- −$11,203
- − Property taxes
- −$2,906
- − Insurance
- −$1,000
- − Repairs & maintenance
- −$1,683
- − Management
- −$1,683
- − Depreciation
- −$5,818
- Taxable loss
- −$3,255
- Est. tax savings @ 24.0%
- +$781
- After-tax cash flow
- $910/yr
For passive investors: Depreciation is non-cash, so a rental often shows a tax loss while cash-flowing — sheltering income. Rental losses are passive: they offset passive income freely, and up to $25,000/yr can offset ordinary (W-2) income if you actively participate and your MAGI is under $100k (phasing out to $0 by $150k); unused losses carry forward. On sale, claimed depreciation is recaptured at up to 25%, and gains may owe capital-gains tax (a 1031 exchange can defer both). Figures are a year-1 estimate at your 24.0% rate — not tax advice; consult a CPA.
Schools (NCES district)
- District
- Citrus
- NCES district ID
- 1200270
- Math proficiency
- 49% ▼ -10.00%
- Reading proficiency
- 50% ▼ -6.00%
- Median HH income
- $38,618
- Composite
- 41.28/100
- National rank
- #3519
- State rank
- #44 of 73 in FL
Livability — Inverness
- Score
- 67/100
- State rank
- #564
- US rank
- #10791
Category grades
Schools grade is shown separately in the Schools card above.
Census & demographics
- City population
- 10,621
- Population (ZIP)
- 10,408
Population outlook (Citrus County) Hauer SSP2
- Today (2025)
- 138,622 people
- By 2030
- 136,886 · -1.3%
- By 2040
- 132,009 · -4.8%
- By 2050
- 125,196 · -9.7%
- By 2075
- 108,570 · -21.7%
- By 2100
- 84,454 · -39.1%
Race, ethnicity, and origin ACS 2023
- Neighborhood character
- Predominantly White (81%)
- Race & ethnicity
- White 81% Two or more races 10% Hispanic / Latino 8% Asian 3% Black 1%
- Hispanic origin (detail)
- Mexican 3% Puerto Rican 3%
- Common ancestry
- Romanian 4% Slovak 3% Lithuanian 2%
- Foreign-born
- 8% · Canada
- Languages at home
- 90% English-only · Spanish 4% Other Indo-European 3% Tagalog/Filipino 1%
Political lean MEDSL · Citrus
- 2024 margin
- Solid R (+45.9) · D 26.8% · R 72.6%
- 2008→2024 swing
- -29.8pp toward R · 2008: -16.1pp · 2024: -45.9pp
- All cycles
- 2024: R+45.9 2020: R+41.0 2016: R+39.7 2012: R+21.9 2008: R+16.1
Not yet ingested
- Civics
- —
Market trends
- HPI YoY
- ▼ -72.56%
- Current HPI
- 315.9725
- Rent YoY
- —
- Metro
- —
- State GDP YoY
- ▲ 3.28%
- F500 in state
- 36
Industry mix (Fortune 500 HQ in FL)
| Industry | F500 HQs | Revenue |
|---|---|---|
| Industrial Technology | 2 | $29B |
|
||
| Insurance | 2 | $17B |
|
||
| Retail | 1 | $60B |
|
||
| Technology Distribution | 1 | $58B |
|
||
| Homebuilding | 1 | $35B |
|
||
| Technology Manufacturing | 1 | $35B |
|
||
Price history
+900.0% since first listed5 events — show timeline
- 2026-06-12 Listed $200,000 Stellar MLS as Distributed by MLS Grid
- 2021-08-17 Sold (Public Records) $162,000 Public Records
- 2004-05-12 Sold (Public Records) $70,000 Public Records
- 1982-11-01 Sold (Public Records) $34,000 Public Records
- 1974-04-01 Sold (Public Records) $20,000 Public Records
Property tax history
+20.0%/yrLatest (2025): $2,906 · +5.9% YoY. Source: county tax records.
Cash-flow waterfall
monthlySold comps — $/sqft
last 12 mo · ≤1 miLoading sold comps…