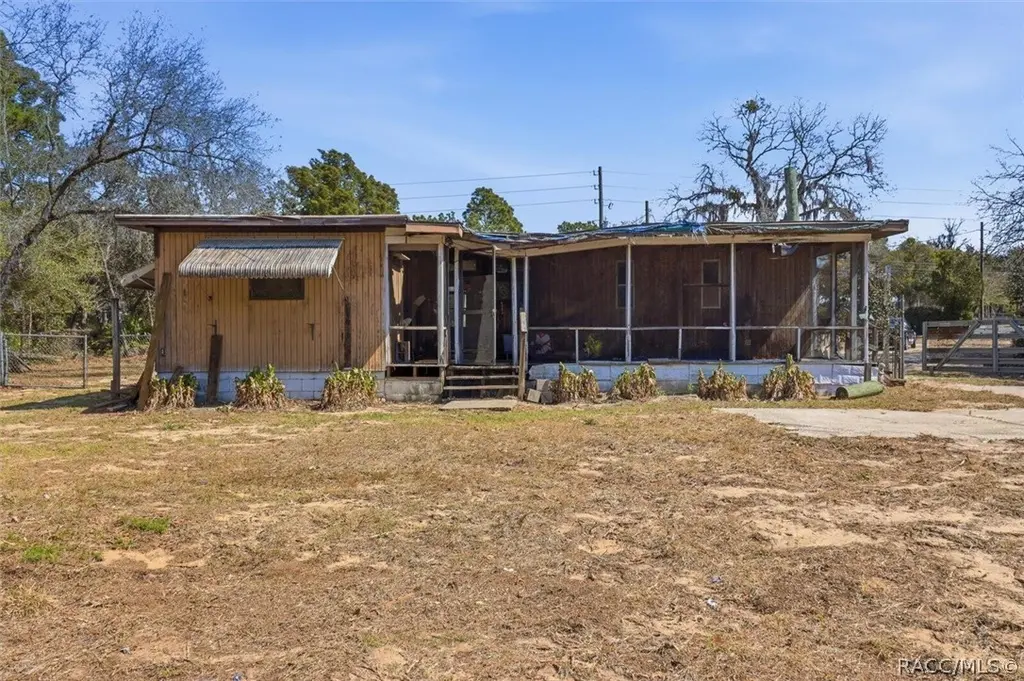
2012 S Rock Crusher Rd · Homosassa Springs, FL
Flood risk 1/10 · Minimal
- FEMA flood zone
- X (unshaded)
- Chance of flooding over 30 yrs
- 0.0%
- Est. flood insurance / yr
- $507 – $1,088
Fire risk 6/10 · Moderate
- Est. fire insurance / yr
- $947 – $1,759
Heat risk 9/10 · Severe
- Hot days now (above 108°F)
- 7 days/yr
- Hot days in 30 yrs
- 25 days/yr
Wind risk 9/10 · Severe
- Chance of severe wind over 30 yrs
- 99.0%
Air-quality risk 1/10 · Minimal
- Unhealthy air days now
- 0 days/yr
- Unhealthy air days in 30 yrs
- 0 days/yr
Risk factors via First Street. Map © Google.
Why this score? — see what drove the B+ grade
The composite is a weighted blend of 9 inputs, each scored 0–100. Each bar is that input's sub-score; the figure is the points it added to the 100-point composite (weight × sub-score).
- Cash flow +30.0/30.0
- ARV discount +15.0/15.0
- 1% rule +10.0/10.0
- DSCR +10.0/10.0
- Schools +4.1/10.0
- Livability +3.6/5.0
- Rent growth +2.5/5.0
- Condition / age +2.5/5.0
- Appreciation +0.0/10.0
$73,000
🖨 Deal sheet (PDF) 📄 Offer letter ✓ Due diligence
Listing remarks
This charming handyman special is nestled on a generous 0.94-acre lot in Homosassa, offering incredible potential. Featuring 2 bedrooms, 1 bathroom, and 960 square feet, this property is an excellent opportunity for those looking for an affordable place to call home, a relaxing weekend getaway, or investment. Located outside of a flood zone, this home provides added peace of mind.
Key facts
- 0.94-acre lot
- 0.94 acre lot
- Built 1981
Tags
Property features AI
Finance
- Other: Zoning: RURMH
- Financial info: Annual tax reported
Exterior
- Parking: Paved driveway; Unpaved parking areas
- Utilities: Septic tank
- Home design: Manufactured residential home; Single-wide manufactured home
- Construction: Metal roof
- Exterior features: Cleared lot; Paved road access
Interior
- Kitchen: No kitchen appliances listed
- Bedrooms: Total of 1 room (may include living/sleeping area)
- Bathrooms: 1 full bathroom
- Heating & cooling: No cooling system
- Interior features: No built-in appliances listed
- Laundry & utility: No laundry appliances listed
Neighborhood map
What this means for you Summary
Snapshot
- This is a 2-bed/1.0-bath manufactured listed at $73k.
Deal economics
- At list price, monthly cash flow is $845 ($10k/yr) — positive.
- The deal already cash-flows at list — no discount required.
- Meets the 1% rule at list price ($2k rent vs $73k).
- Recommended offer: $69k (6.0% below list) — sets the bar for market timing.
- Cap rate 20.2% vs local median 5.9% in Homosassa Springs — top-decile yield for the area; either an underpriced asset or a hidden risk that comps aren't pricing in. Stress-test before assuming the spread holds.
Location & tenants
- Location reads 71/100 on livability (#391 in FL) — a middle-class / working-renter tenant base. Strengths: cost of living A+, housing A+, health & safety A+; Watch: crime C-, amenities F, commute F.
- Citrus (rural): math 49% / reading 50% proficiency, ranked #44 of 73 in FL (top 60%) — families likely to look elsewhere, expect single-tenant / working-renter base with shorter leases.
- Zoned schools: Rock Crusher Elementary School (math 70% / reading 56%, grade B, #582 of 2,144 statewide, top 28%, 665 students, 68% FRL); Crystal River Middle School (math 49% / reading 47%, grade C-, #286 of 571 statewide, top 50%, 900 students, 64% FRL); Crystal River High School (math 31% / reading 44%, grade F, #336 of 667 statewide, top 51%, 1,249 students, 56% FRL).
- Market conditions: 307 active listings in the ZIP; 2 comparable units currently listed for rent nearby; 2,443 units permitted in Citrus County in 2024 (0 in 5+ unit buildings).
- This rent runs 45% of the median local income ($46k/yr) — at the standard rent-burdened threshold; future hikes will face affordability resistance.
Forward outlook
- Local home prices are declining (-3.0%/yr); year-one equity from $505 of loan paydown is wiped out by about $2k of value loss. Plan a longer hold.
- Citrus County population projected to shrink 10% by 2050 — rents likely to lag national; underwrite the cash flow, not the appreciation.
- At projected returns (-3.0% appreciation + 3.0% rent growth), your $20k cash investment doubles in ~3 years — after that, you're playing with house money.
Negotiation context
- It's been on market 61 days — a 6% lower offer ($69k) is reasonable based on typical stale-listing flexibility.
- Current owner paid $20k; list at $73k implies a 265% gain — meaningful room to come down on a strong offer.
Risks & watch-outs
- Climate carrying-cost: severe wind risk, 99% chance of damaging wind over 30y; major wildfire risk; extreme-heat days projected 7→25/yr by 2055 (HVAC capex compounding) — expect insurance premiums to compound above CPI over the hold.
Questions for the listing agent
- It's been on market 61 days. Have you received any prior offers? Is the seller open to a 6% concession, seller financing, or rate buy-down credit?
- Why hasn't it sold? Are there any deal-killer items the seller is aware of (foundation, flood, title, zoning, code violations)?
- Is there a deadline driving the sale (1031 exchange, divorce, estate, relocation)? That informs how much negotiation room exists.
- Schools are F-rated, which usually means shorter tenancies and higher turnover. Who's the typical renter profile here, and what's been the actual vacancy rate?
- What's the average days-on-market for RENTAL listings here right now (not sales)? A rising rental-DOM trend means longer vacancies and softer asking-rent achievability than the comps imply.
- What's the recent tenant-quality profile in this submarket — average credit score on applications, eviction rate, late-payment / NSF rate, and stable-employment percentage? A property-management company in the area should have these aggregated.
- How much new for-sale + rental construction is in the pipeline within 1–3 miles? Heavy new supply typically softens prices + rents 12–24 months out; constrained supply supports both.
Investment metrics
- 1% rule
- 2.34% ✓
- Cap rate
- 20.18%
- Cash-on-cash
- 49.59%
- DSCR
- 3.21
- GRM
- 3.6
CMA / ARV
- ARV (on-the-fly)
- $143,040
- Comps found
- 4
Show comp detail 4 sales within ~0.75 mi
| Address | Dist | Beds/Ba | Sqft | Sold | Price | $/sf | Match |
|---|---|---|---|---|---|---|---|
| 2012 S Rock Crusher Rd | 0.00mi | 2/1.0 | 960 (0%) | 0mo | $63,000 | $66 | 100 |
| 2316 S Seiler Pt | 0.40mi | 3/2.0 (+1) | 924 (-4%) | 8mo | $138,000 | $149 | 60 |
| 6200 W Heritage Dr | 0.58mi | 3/2.0 (+1) | 960 (0%) | 13mo | $170,000 | $177 | 53 |
| 2010 S Goode Pt | 0.14mi | 3/2.0 (+1) | 828 (-14%) | 22mo | $105,000 | $127 | 43 |
Match score weights: distance 35% · size 25% · config 20% · recency 20%. Top-matched comps best support the ARV.
Projected returns pro-forma
-3.0% appreciation · 3.0% rent growth · sell at horizon
- IRR
- 47.3%
- Equity multiple
- 3.05×
- Total profit
- $42,000
- Equity at exit
- $10,885
- IRR
- 53.0%
- Equity multiple
- 6.18×
- Total profit
- $105,962
- Equity at exit
- $6,312
Cash invested: $20,440 (down + closing). Projections, not guarantees.
Landlord ↔ Tenant lean methodology
- Overall (STATE)
- 87 Strongly Landlord-Friendly
- State Florida
- 87 Strongly Landlord-Friendly · R+3
- County
- — inherits STATE
- City
- — inherits STATE
ZIP-level market 34448
- Home prices YoY
- -26.1%
- Active inventory
- 307
- Price-to-rent
- 3.6×
Monthly cashflow live
- Estimated rent
- $1,710 medium interval (Pro) →
- Mortgage (P&I)
- −$383
- Tax from tax record
- −$93 /mo · $1,117/yr
- Insurance
- −$30
- HOA
- −$0
- Vacancy / Maint / Mgmt
- −$359
- Net cashflow
- $845
Break-even live
Sensitivity live
| Price | -10% $886 | -5% $865 | +0% $845 | +5% $824 | +10% $803 |
|---|---|---|---|---|---|
| Rent | -10% $710 | -5% $777 | +0% $845 | +5% $912 | +10% $980 |
| Rate | -1.0pp $882 | -0.5pp $863 | base $845 | +0.5pp $826 | +1.0pp $807 |
UW: 25.0% down · 7.5% · 30yr · 1.5% tax · 5.0% vac · 8.0% maint · 8.0% mgmt
Financing live
Cash to close
- Down payment
- $18,250
- Closing costs
- $2,190
- Reserves months
- —
- Total cash needed
- —
Loan-product check · same deal, 3 products live
Conventional
25% down · 7.5% · 30yr
- Down + closing
- —
- Monthly P&I
- —
- Monthly cashflow
- —
- DSCR
- —
- Eligible?
- —
Personal DTI + credit; lowest rate.
DSCR
20% down · 8.5% · 30yr
- Down + closing
- —
- Monthly P&I
- —
- Monthly cashflow
- —
- DSCR
- —
- Eligible?
- —
No personal income docs; deal must DSCR.
Hard money
10% down · 12.0% · 12mo
- Down + closing
- —
- Monthly P&I
- —
- Monthly cashflow
- —
- DSCR
- —
- Eligible?
- —
Short-term bridge; refi at stabilization.
Rent comps 2 comps
| Address | Beds | Baths | Sqft | Rent | $/sqft | DOM | Units | Dist |
|---|---|---|---|---|---|---|---|---|
| 5353 W Customer Ct Lecanto, FL | 2.0 | 1.5 | 912 | $1,350 | $1.48 | 22d | 1 | 0.42mi |
| 5652 W Nobis Cir Homosassa, FL | 1.0 | 1.0 | 789 | $1,800 | $2.28 | 22d | 1 | 0.81mi |
Listing history 12 events
-
2026-06-09days on market $73,000 Active 61 DOM
-
2026-06-08days on market $73,000 Active 60 DOM
-
2026-06-07days on market $73,000 Active 59 DOM
-
2026-06-03days on market $73,000 Active 55 DOM
-
2026-06-02days on market $73,000 Active 54 DOM
-
2026-06-01days on market $73,000 Active 53 DOM
-
2026-05-31days on market $73,000 Active 52 DOM
-
2026-05-30days on market $73,000 Active 51 DOM
-
2026-04-09$79,000 Active
-
1998-12-08soldstatus $20,000
-
1991-03-01soldstatus $6,800
-
1981-10-01soldstatus $6,350
ⓘ Source: listings_history table (triggers on properties + properties_extension) + one-shot
backfill from property_details.listing_events for pre-trigger history.
Tax reassessment forecast FL · Resets to sale price
- Current annual tax
- $1,117 · $93/mo
- Projected year-2 tax
- $1,117 · $93/mo
- Expected delta
- $0/yr ($0/mo · 0.0%)
ⓘ Screening estimate from a state-policy table — verify with the county assessor before closing.
Climate risk First Street
- Flood 1/10 Low FEMA zone X (unshaded) · 0% chance over 30 yrs
- Wildfire 6/10 Major
- Heat 9/10 Extreme 7 d/yr ≥108°F today · 25 d/yr by 30 yrs out
- Wind 9/10 Extreme 99% chance of damaging wind over 30 yrs
- Air quality 1/10 Low 0 unhealthy d/yr today · 0 by 30 yrs out
Nearby sold comps map
Loading sold comps map…
Walkable amenities ~0.75 mi
Loading nearby amenities…
Taxation est. · year 1
- Rental income
- $20,523
- − Mortgage interest
- −$4,089
- − Property taxes
- −$1,117
- − Insurance
- −$365
- − Repairs & maintenance
- −$1,642
- − Management
- −$1,642
- − Depreciation
- −$2,124
- Taxable income
- $9,544
- Est. tax owed @ 24.0%
- −$2,291
- After-tax cash flow
- $7,846/yr
For passive investors: Depreciation is non-cash, so a rental often shows a tax loss while cash-flowing — sheltering income. Rental losses are passive: they offset passive income freely, and up to $25,000/yr can offset ordinary (W-2) income if you actively participate and your MAGI is under $100k (phasing out to $0 by $150k); unused losses carry forward. On sale, claimed depreciation is recaptured at up to 25%, and gains may owe capital-gains tax (a 1031 exchange can defer both). Figures are a year-1 estimate at your 24.0% rate — not tax advice; consult a CPA.
Schools (NCES district)
- District
- Citrus
- NCES district ID
- 1200270
- Math proficiency
- 49% ▼ -10.00%
- Reading proficiency
- 50% ▼ -6.00%
- Median HH income
- $38,618
- Composite
- 41.28/100
- National rank
- #3519
- State rank
- #44 of 73 in FL
Livability — Homosassa Springs
- Score
- 71/100
- State rank
- #391
- US rank
- #6877
Category grades
Schools grade is shown separately in the Schools card above.
Census & demographics
- Census place
- Homosassa Springs, FL
- County
- Citrus County · 111,314 people
- Metro
- Homosassa Springs, FL
- Population (ZIP)
- 10,817
- Household income
- $45,916
- Rent vs Own
- Severe rent burden
- 113.0
Population outlook (Citrus County) Hauer SSP2
- Today (2025)
- 138,622 people
- By 2030
- 136,886 · -1.3%
- By 2040
- 132,009 · -4.8%
- By 2050
- 125,196 · -9.7%
- By 2075
- 108,570 · -21.7%
- By 2100
- 84,454 · -39.1%
Race, ethnicity, and origin ACS 2023
- Neighborhood character
- Predominantly White (94%)
- Race & ethnicity
- White 94% Two or more races 3% Hispanic / Latino 3% Black 1%
- Common ancestry
- Slovak 3% Scotch-Irish 2% Lithuanian 2%
- Foreign-born
- 2% · Canada
- Languages at home
- 96% English-only · Spanish 2% Russian/Polish/Slavic 1%
Political lean MEDSL · Citrus
- 2024 margin
- Solid R (+45.9) · D 26.8% · R 72.6%
- 2008→2024 swing
- -29.8pp toward R · 2008: -16.1pp · 2024: -45.9pp
- All cycles
- 2024: R+45.9 2020: R+41.0 2016: R+39.7 2012: R+21.9 2008: R+16.1
Not yet ingested
- Civics
- —
Market trends
- HPI YoY
- ▼ -110.27%
- Current HPI
- 312.4302
- Rent YoY
- —
- Metro
- Homosassa Springs, FL
- State GDP YoY
- ▲ 3.28%
- F500 in state
- 36
Industry mix (Fortune 500 HQ in FL)
| Industry | F500 HQs | Revenue |
|---|---|---|
| Industrial Technology | 2 | $29B |
|
||
| Insurance | 2 | $17B |
|
||
| Retail | 1 | $60B |
|
||
| Technology Distribution | 1 | $58B |
|
||
| Homebuilding | 1 | $35B |
|
||
| Technology Manufacturing | 1 | $35B |
|
||
Price history
+1144.1% since first listed4 events — show timeline
- 2026-04-09 Listed $79,000 RACC
- 1998-12-08 Sold (Public Records) $20,000 Public Records
- 1991-03-01 Sold (Public Records) $6,800 Public Records
- 1981-10-01 Sold (Public Records) $6,350 Public Records
Property tax history
+26.4%/yrLatest (2025): $1,117 · +8.8% YoY. Source: county tax records.
Cash-flow waterfall
monthlySold comps — $/sqft
last 12 mo · ≤1 miLoading sold comps…