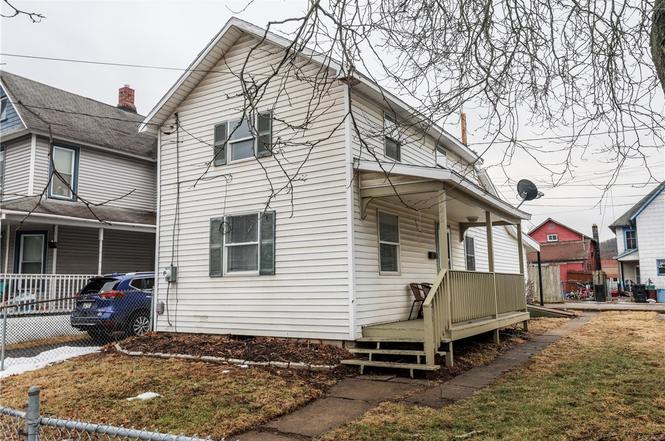
326 Woodview Ave · Corning, NY
Flood risk 1/10 · Minimal
- FEMA flood zone
- X
- Chance of flooding over 30 yrs
- 0.0%
- Est. flood insurance / yr
- $473 – $860
Fire risk 3/10 · Minor
- Est. fire insurance / yr
- $691 – $1,283
Heat risk 3/10 · Minor
- Hot days now (above 94°F)
- 8 days/yr
- Hot days in 30 yrs
- 17 days/yr
Wind risk 1/10 · Minimal
- Chance of severe wind over 30 yrs
- 1.0%
Air-quality risk 1/10 · Minimal
- Unhealthy air days now
- 0 days/yr
- Unhealthy air days in 30 yrs
- 0 days/yr
Risk factors via First Street. Map © Google.
Why this score? — see what drove the B+ grade
The composite is a weighted blend of 9 inputs, each scored 0–100. Each bar is that input's sub-score; the figure is the points it added to the 100-point composite (weight × sub-score).
- Cash flow +28.6/30.0
- ARV discount +15.0/15.0
- DSCR +10.0/10.0
- 1% rule +8.2/10.0
- Livability +4.4/5.0
- Schools +4.2/10.0
- Rent growth +2.5/5.0
- Condition / age +2.5/5.0
- Appreciation +0.0/10.0
$110,000
🖨 Deal sheet 📄 Offer letter ✓ Due diligence
Listing remarks
Renovated and move-in ready, in a convenient location just minutes from Denison Parkway and downtown Corning. This 2-bedroom, 1-bath home has been refreshed from top to bottom. The brand-new kitchen features crisp white cabinetry, butcher block countertops, and stainless steel appliances. New vinyl flooring flows throughout the home, complemented by fresh paint, updated lighting, new hardware, and coordinated finishes that give the entire home a clean, cohesive feel. The main level includes a bedroom, full bathroom, and convenient first-floor laundry. Upstairs, you’ll find a second bedroom with a vaulted ceiling along with a versatile bonus space at the top of the stairs that could se
Key facts
- Fully renovated
- Brand new kitchen
- Updated lighting
Tags
Neighborhood map
What this means for you Summary
Snapshot
- This is a 2-bed/1.0-bath single-family listed at $110k.
Deal economics
- At list price, monthly cash flow is $363 ($4k/yr) — positive.
- The deal already cash-flows at list — no discount required.
- Meets the 1% rule at list price ($1k rent vs $110k).
- Recommended offer: $103k (6.0% below list) — sets the bar for market timing.
- Cap rate 10.3% vs local median 8.0% in Corning — meaningfully above typical; check what's discounted (condition, days-on-market, listing class) to confirm the premium yield is real.
Location & tenants
- Location reads 87/100 on livability (#14 in NY, #334 nationally) — a professional / high-income tenant draw. Strengths: amenities A+, housing A+, health & safety A+; Watch: employment D.
- Corning City School District (town): math 44% / reading 53% proficiency, ranked #406 of 590 in NY (top 69%) — families likely to look elsewhere, expect single-tenant / working-renter base with shorter leases.
- Market conditions: 106 active listings in the ZIP; 4 comparable units currently listed for rent nearby; rentals lingering (median 44d on market — plan ~5-8 weeks vacancy on turnover, expect pricing pressure); 100% of comp listings sitting > 30 days — soft ceiling on asking rent; 196 units permitted in Steuben County in 2024 (0 in 5+ unit buildings).
Forward outlook
- Local home prices are declining (-3.0%/yr); year-one equity from $761 of loan paydown is wiped out by about $3k of value loss. Plan a longer hold.
- Steuben County population projected at -20% by 2050 — secular population decline; favor cash flow + early exit over multi-decade hold.
- At projected returns (-3.0% appreciation + 3.0% rent growth), your $31k cash investment doubles in ~9 years — after that, you're playing with house money.
Negotiation context
- It's been on market 71 days — a 6% lower offer ($103k) is reasonable based on typical stale-listing flexibility.
- 10 sale attempts since 23y ago; this cycle's ask has dropped $15k (12%) from the opening price — seller is motivated, your offer sets the floor, not the list.
Risks & watch-outs
- Watch-outs: built in 1877 — expect roof / HVAC / electrical / plumbing capex.
Questions for the listing agent
- It's been on market 71 days. Have you received any prior offers? Is the seller open to a 6% concession, seller financing, or rate buy-down credit?
- Built in 1877 — when were the roof, HVAC, electrical panel, plumbing, and water heater last replaced?
- Why hasn't it sold? Are there any deal-killer items the seller is aware of (foundation, flood, title, zoning, code violations)?
- Is there a deadline driving the sale (1031 exchange, divorce, estate, relocation)? That informs how much negotiation room exists.
- Schools are A-rated — typically a magnet for longer-tenancy family renters. What's the average tenant stay here, and is there a school-zone premium baked into asking?
- What's the average days-on-market for RENTAL listings here right now (not sales)? A rising rental-DOM trend means longer vacancies and softer asking-rent achievability than the comps imply.
- What's the recent tenant-quality profile in this submarket — average credit score on applications, eviction rate, late-payment / NSF rate, and stable-employment percentage? A property-management company in the area should have these aggregated.
- How much new for-sale + rental construction is in the pipeline within 1–3 miles? Heavy new supply typically softens prices + rents 12–24 months out; constrained supply supports both.
Investment metrics
- 1% rule
- 1.32% ✓
- Cap rate
- 10.25%
- Cash-on-cash
- 14.15%
- DSCR
- 1.63
- GRM
- 6.3
CMA / ARV
- ARV (on-the-fly)
- $146,944
- Comps found
- 9
Show comp detail 9 sales within ~0.75 mi
| Address | Dist | Beds/Ba | Sqft | Sold | Price | $/sf | Match |
|---|---|---|---|---|---|---|---|
| 326 Woodview Ave | 0.00mi | 2/1.0 | 1,148 (0%) | 1mo | $108,500 | $95 | 99 |
| 388 E Second St | 0.29mi | 3/2.0 (+1) | 1,152 (+0%) | 15mo | $147,500 | $128 | 64 |
| 6 Jackson Cir | 0.73mi | 3/1.0 (+1) | 1,152 (+0%) | 7mo | $198,000 | $172 | 54 |
| 156 Watauga Ave | 0.62mi | 3/1.0 (+1) | 1,268 (+10%) | 1mo | $181,000 | $143 | 48 |
| 19 Wilson | 0.61mi | 2/1.0 | 1,296 (+13%) | 2mo | $166,000 | $128 | 48 |
| 134 High Rd | 0.70mi | 3/1.0 (+1) | 1,140 (-1%) | 20mo | $1,300 | $1 | 45 |
| 3010 College Ave | 0.61mi | 3/1.0 (+1) | 1,216 (+6%) | 18mo | $101,850 | $84 | 42 |
| 247 Wall St | 0.67mi | 3/1.5 (+1) | 1,228 (+7%) | 19mo | $240,000 | $195 | 34 |
| 21 Upland Dr | 0.65mi | 3/2.0 (+1) | 1,250 (+9%) | 18mo | $258,000 | $206 | 31 |
Match score weights: distance 35% · size 25% · config 20% · recency 20%. Top-matched comps best support the ARV.
Projected returns pro-forma
-3.0% appreciation · 3.0% rent growth · sell at horizon
- IRR
- 4.5%
- Equity multiple
- 1.17×
- Total profit
- $5,340
- Equity at exit
- $16,401
- IRR
- 14.0%
- Equity multiple
- 2.12×
- Total profit
- $34,572
- Equity at exit
- $9,511
Cash invested: $30,800 (down + closing). Projections, not guarantees.
Landlord ↔ Tenant lean methodology
- Overall (STATE)
- 15 Strongly Tenant-Friendly
- State New York
- 15 Strongly Tenant-Friendly · D+10
- County
- — inherits STATE
- City
- — inherits STATE
ZIP-level market 14830
- Active inventory
- 106
- Price-to-rent
- 6.3×
Monthly cashflow live
- Estimated rent
- $1,447 medium interval (Pro) →
- Mortgage (P&I)
- −$577
- Tax from tax record
- −$157 /mo · $1,886/yr
- Insurance
- −$46
- HOA
- −$0
- Vacancy / Maint / Mgmt
- −$304
- Net cashflow
- $363
Break-even live
UW: 25.0% down · 7.5% · 30yr · 1.5% tax · 5.0% vac · 8.0% maint · 8.0% mgmt
Financing live
Cash to close
- Down payment
- $27,500
- Closing costs
- $3,300
- Reserves months
- —
- Total cash needed
- —
Loan-product check · same deal, 3 products live
Conventional
25% down · 7.5% · 30yr
- Down + closing
- —
- Monthly P&I
- —
- Monthly cashflow
- —
- DSCR
- —
- Eligible?
- —
Personal DTI + credit; lowest rate.
DSCR
20% down · 8.5% · 30yr
- Down + closing
- —
- Monthly P&I
- —
- Monthly cashflow
- —
- DSCR
- —
- Eligible?
- —
No personal income docs; deal must DSCR.
Hard money
10% down · 12.0% · 12mo
- Down + closing
- —
- Monthly P&I
- —
- Monthly cashflow
- —
- DSCR
- —
- Eligible?
- —
Short-term bridge; refi at stabilization.
Rent comps 4 comps
| Address | Beds | Baths | Sqft | Rent | $/sqft | DOM | Units | Dist |
|---|---|---|---|---|---|---|---|---|
| 311 Denison Pkwy E Unit 201 Corning, NY | 1.0 | 1.0 | 920 | $1,350 | $1.47 | 43d | 1 | 0.05mi |
| 265 Denison Pkwy E Corning, NY | 1.0–2.0 | 1.0 | 910 | $1,495 | $1.64 | 43d | 1 | 0.11mi |
| 90 E Market St Unit 2 Corning, NY | 2.0 | 1.0 | 1044 | $2,200 | $2.11 | 43d | 1 | 0.52mi |
| 125 W Market St Corning, NY | 1.0 | 1.0 | 1026 | $1,600 | $1.56 | 43d | 1 | 0.98mi |
Listing history 27 events
-
2026-05-22soldstatus $108,500 Closed
-
2026-05-06status Pending
-
2026-03-16historical Active Under Contract
-
2026-03-09status Active
-
2026-03-09price $110,000
-
2026-03-04historical Active Under Contract
-
2026-02-24$125,000 Active
-
2024-11-30historical $1,250
-
2024-11-09price $1,250
-
2024-11-09historical
-
2024-10-18$1,300
-
2024-08-23$94,900
-
2023-11-09soldstatus $65,000
-
2023-02-26historical
-
2022-08-26$73,000
-
2020-02-19soldstatus $32,000
-
2020-02-11soldstatus $32,000
-
2019-11-06$48,000
-
2006-06-20soldstatus $18,000
-
2006-06-15soldstatus $18,000
-
2006-05-03historical
-
2006-04-21$26,000
-
2006-01-03$29,000
-
2005-12-28historical
-
2005-02-08$37,805
-
2004-03-22historical
-
2003-09-22$62,900
ⓘ Source: listings_history table (triggers on properties + properties_extension) + one-shot
backfill from property_details.listing_events for pre-trigger history.
Tax reassessment forecast NY · Partial reset (capped growth)
- Current annual tax
- $1,886 · $157/mo
- Projected year-2 tax
- $1,886 · $157/mo
- Expected delta
- $0/yr ($0/mo · 0.0%)
ⓘ Screening estimate from a state-policy table — verify with the county assessor before closing.
Climate risk First Street
- Flood 1/10 Low FEMA zone X · 0% chance over 30 yrs
- Wildfire 3/10 Moderate
- Heat 3/10 Moderate 8 d/yr ≥94°F today · 17 d/yr by 30 yrs out
- Wind 1/10 Low 100% chance of damaging wind over 30 yrs
- Air quality 1/10 Low 0 unhealthy d/yr today · 0 by 30 yrs out
Nearby sold comps map
Loading sold comps map…
Walkable amenities ~0.75 mi
Loading nearby amenities…
Taxation est. · year 1
- Rental income
- $17,362
- − Mortgage interest
- −$6,162
- − Property taxes
- −$1,886
- − Insurance
- −$550
- − Repairs & maintenance
- −$1,389
- − Management
- −$1,389
- − Depreciation
- −$3,200
- Taxable income
- $2,787
- Est. tax owed @ 24.0%
- −$669
- After-tax cash flow
- $3,689/yr
For passive investors: Depreciation is non-cash, so a rental often shows a tax loss while cash-flowing — sheltering income. Rental losses are passive: they offset passive income freely, and up to $25,000/yr can offset ordinary (W-2) income if you actively participate and your MAGI is under $100k (phasing out to $0 by $150k); unused losses carry forward. On sale, claimed depreciation is recaptured at up to 25%, and gains may owe capital-gains tax (a 1031 exchange can defer both). Figures are a year-1 estimate at your 24.0% rate — not tax advice; consult a CPA.
Schools (NCES district)
- District
- Corning City School District
- NCES district ID
- 3608400
- Math proficiency
- 44% ▼ -12.00%
- Reading proficiency
- 53% ▲ 4.00%
- Median HH income
- $53,042
- Composite
- 41.8/100
- National rank
- #3392
- State rank
- #406 of 590 in NY
Livability — Corning
- Score
- 87/100
- State rank
- #14
- US rank
- #334
Category grades
Schools grade is shown separately in the Schools card above.
Census & demographics
- Census place
- Corning, NY
- County
- Steuben County · 41,193 people
- City population
- 19,015
- Metro
- Corning, NY
- Population (ZIP)
- 19,015
- Household income
- $73,263
- Rent vs Own
- Severe rent burden
- 565.0
Population outlook (Steuben County) Hauer SSP2
- Today (2025)
- 93,062 people
- By 2030
- 89,793 · -3.5%
- By 2040
- 82,353 · -11.5%
- By 2050
- 74,286 · -20.2%
- By 2075
- 55,589 · -40.3%
- By 2100
- 37,587 · -59.6%
Race, ethnicity, and origin ACS 2023
- Neighborhood character
- Predominantly White (91%)
- Race & ethnicity
- White 91% Two or more races 3% Black 3% Hispanic / Latino 3% Asian 2%
- Common ancestry
- Romanian 4% Slovak 3% Lithuanian 2%
- Foreign-born
- 5% · Canada, China
- Languages at home
- 95% English-only · Russian/Polish/Slavic 1% Spanish 1% Other Asian/Pacific 1%
Political lean MEDSL · Steuben
- 2024 margin
- Solid R (+31.8) · D 34.1% · R 65.9%
- 2008→2024 swing
- -15.0pp toward R · 2008: -16.8pp · 2024: -31.8pp
- All cycles
- 2024: R+31.8 2020: R+29.6 2016: R+36.2 2012: R+16.4 2008: R+16.8
Not yet ingested
- Civics
- —
Market trends
- HPI YoY
- ▼ -94.59%
- Current HPI
- 173.9857
- Rent YoY
- —
- Metro
- Corning, NY
- State GDP YoY
- ▲ 2.60%
- F500 in state
- 92
Industry mix (Fortune 500 HQ in NY)
| Industry | F500 HQs | Revenue |
|---|---|---|
| Financial Services | 10 | $950B |
|
||
| Consumer Goods | 9 | $162B |
|
||
| Insurance | 4 | $225B |
|
||
| Telecommunications | 2 | $144B |
|
||
| Pharmaceuticals | 2 | $112B |
|
||
| Media / Entertainment | 2 | $69B |
|
||
Price history
+72.5% since first listed27 events — show timeline
- 2026-05-22 Sold (MLS) $108,500 UNYREIS
- 2026-05-06 Pending — UNYREIS
- 2026-03-16 Contingent — UNYREIS
- 2026-03-09 Relisted — UNYREIS
- 2026-03-09 Price Changed $110,000 UNYREIS
- 2026-03-04 Contingent — UNYREIS
- 2026-02-24 Listed $125,000 UNYREIS
- 2024-11-30 Rental Removed $1,250 APPFOLIO
- 2024-11-09 Price Changed $1,250 APPFOLIO
- 2024-11-09 Listing Removed — UNYREIS
- 2024-10-18 Listed for Rent $1,300 APPFOLIO
- 2024-08-23 Listed $94,900 UNYREIS
- 2023-11-09 Sold (Public Records) $65,000 Public Records
- 2023-02-26 Listing Removed — UNYREIS
- 2022-08-26 Listed $73,000 UNYREIS
- 2020-02-19 Sold (Public Records) $32,000 Public Records
- 2020-02-11 Sold (MLS) $32,000 UNYREIS
- 2019-11-06 Listed $48,000 UNYREIS
- 2006-06-20 Sold (Public Records) $18,000 Public Records
- 2006-06-15 Sold (MLS) $18,000 UNYREIS
- 2006-05-03 Listing Removed — UNYREIS
- 2006-04-21 Listed $26,000 UNYREIS
- 2006-01-03 Listed $29,000 UNYREIS
- 2005-12-28 Listing Removed — UNYREIS
- 2005-02-08 Listed $37,805 UNYREIS
- 2004-03-22 Listing Removed — UNYREIS
- 2003-09-22 Listed $62,900 UNYREIS
Property tax history
+1.3%/yrLatest (2025): $1,886 · -1.9% YoY. Source: county tax records.
Cash-flow waterfall
monthlySold comps — $/sqft
last 12 mo · ≤1 miLoading sold comps…