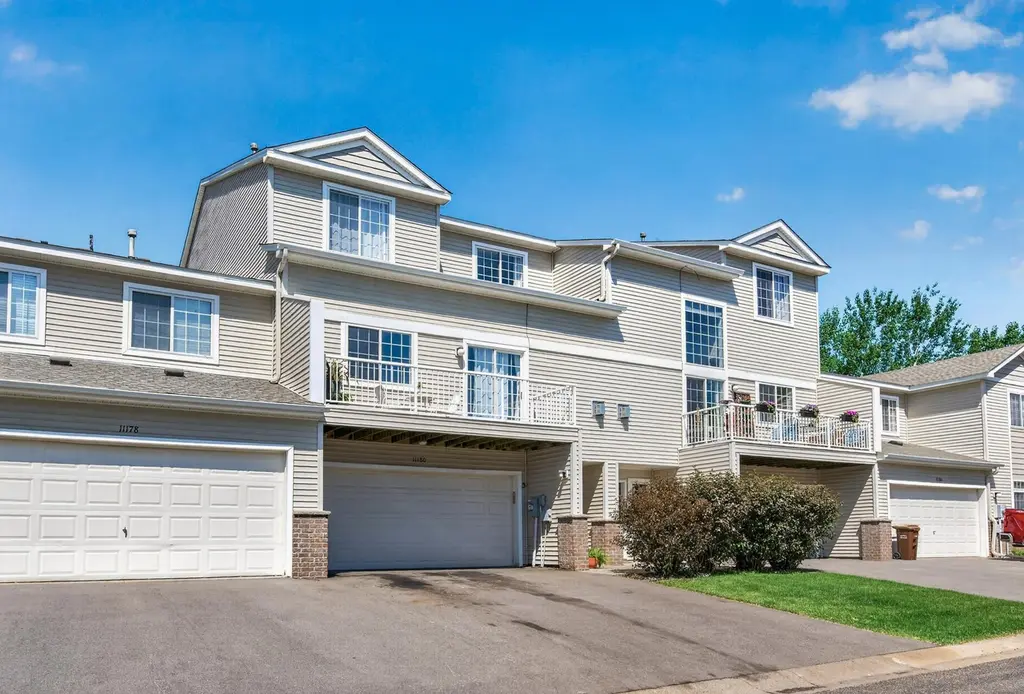
11180 76th St NE · Otsego, MN
Flood risk 1/10 · Minimal
- FEMA flood zone
- X
- Chance of flooding over 30 yrs
- 0.0%
- Est. flood insurance / yr
- $507 – $1,088
Fire risk 1/10 · Minimal
- Est. fire insurance / yr
- $888 – $1,650
Heat risk 2/10 · Minimal
- Hot days now (above 99°F)
- 7 days/yr
- Hot days in 30 yrs
- 14 days/yr
Wind risk 2/10 · Minimal
- Chance of severe wind over 30 yrs
- —
Air-quality risk 2/10 · Minimal
- Unhealthy air days now
- 1 days/yr
- Unhealthy air days in 30 yrs
- 2 days/yr
Risk factors via First Street. Map © Google.
Why this score? — see what drove the D+ grade
The composite is a weighted blend of 9 inputs, each scored 0–100. Each bar is that input's sub-score; the figure is the points it added to the 100-point composite (weight × sub-score).
- Cash flow +16.9/30.0
- ARV discount +7.5/15.0
- 1% rule +5.3/10.0
- DSCR +5.3/10.0
- Schools +5.2/10.0
- Livability +3.5/5.0
- Rent growth +2.5/5.0
- Condition / age +2.5/5.0
- Appreciation +0.0/10.0
$270,000
🖨 Deal sheet (PDF) 📄 Offer letter ✓ Due diligence
Listing remarks MLS
Beautifully move-in ready townhome in a convenient location! Remodeled 2021 with quality in mind, including all new SS appliances, granite countertop, carpet and LVP flooring. Fresh wood work and wall painting throughout and more! Conveniently located near shops, restaurants and schools! This one will go fast... get it quick!
Key facts
- Move-in ready
- Gazebo
- Granite countertop
Tags
Property features AI
Finance
- HOA & community: Has HOA (First Service Residential); HOA fee $310 monthly; HOA covers hazard insurance, lawn care, grounds maintenance, professional management, and snow removal
Exterior
- Parking: Attached garage with garage door opener (2 parking spaces)
- Utilities: City water (connected / in street); City sewer (connected / in street); Electric service with circuit breakers; Fuel: Electric and natural gas
- Home design: Residential property (attached); Two levels
- Construction: Asphalt roof; Other construction materials; Foundation area listed as 750
- Exterior features: Vinyl exterior; Deck; Patio; No fencing
Interior
- Kitchen: Dishwasher; Disposal; Microwave; Range; Refrigerator; Eat-in kitchen
- Bedrooms: Three bedrooms total (one on the main floor; two on the upper level)
- Bathrooms: One full bathroom on the upper level; One three-quarter bathroom on the main floor
- Heating & cooling: Forced air heating; Central air conditioning
- Interior features: Living room fireplace; Eat-in kitchen; Main floor bedroom; No basement
- Laundry & utility: Washer; Dryer
Neighborhood map
What this means for you Summary
Snapshot
- This is a 3-bed/1.0-bath townhouse listed at $270k.
Deal economics
- At list price, monthly cash flow is $177 ($2k/yr) — positive.
- The deal already cash-flows at list — no discount required.
- Meets the 1% rule at list price ($3k rent vs $270k).
- Cap rate 7.1% vs local median 4.0% in Otsego — top-decile yield for the area; either an underpriced asset or a hidden risk that comps aren't pricing in. Stress-test before assuming the spread holds.
Location & tenants
- Location reads 69/100 on livability (#367 in MN) — a middle-class / working-renter tenant base. Strengths: employment A+, housing A+, crime A-; Watch: cost of living C-, amenities F, commute F.
- Independent School District 728 (suburban): math 56% / reading 60% proficiency, ranked #37 of 301 in MN (top 12%) — acceptable for families but not a draw, mixed tenant base, ~2y average lease; only 14% free/reduced lunch — higher-income household profile.
- Zoned schools: Otsego Elementary (math 64% / reading 64%, grade B, #157 of 857 statewide, top 19%, 563 students, 21% FRL); Rogers Middle School (math 61% / reading 63%, grade B+, #19 of 258 statewide, top 8%, 979 students, 16% FRL); Rogers Senior High (math 66% / reading 64%, grade B, #28 of 471 statewide, top 6%, 1,740 students, 18% FRL) — zoned schools at 18% FRL track the district average.
- Market conditions: 143 active listings in the ZIP; 2 comparable units currently listed for rent nearby; high-income renter base; 1,260 units permitted in Wright County in 2024 (180 in 5+ unit buildings).
Forward outlook
- Local home prices are declining (-3.0%/yr); year-one equity from $2k of loan paydown is wiped out by about $8k of value loss. Plan a longer hold.
- Wright County population projected at +9% by 2050 — modest demand growth; plan on rents tracking national, not racing it.
Negotiation context
- Only 13 days on market — expect competitive offers; lowballing is unlikely to land.
- 2 sale attempts since 5y ago with the ask held roughly flat each time — persistent listings suggest the price (not the market) is what's stuck; bring a comps-based counter.
Questions for the listing agent
- What does the HOA fee cover, when was the last increase, and are there any pending special assessments or reserve-fund shortfalls?
- Is there a deadline driving the sale (1031 exchange, divorce, estate, relocation)? That informs how much negotiation room exists.
- Schools are B-rated — typically a magnet for longer-tenancy family renters. What's the average tenant stay here, and is there a school-zone premium baked into asking?
- The area grade is low — what's the realistic commute time and amenity access for the typical tenant pool here? Any planned neighborhood developments (good or bad) we should know about?
- What's the average days-on-market for RENTAL listings here right now (not sales)? A rising rental-DOM trend means longer vacancies and softer asking-rent achievability than the comps imply.
- What's the recent tenant-quality profile in this submarket — average credit score on applications, eviction rate, late-payment / NSF rate, and stable-employment percentage? A property-management company in the area should have these aggregated.
- How much new for-sale + rental construction is in the pipeline within 1–3 miles? Heavy new supply typically softens prices + rents 12–24 months out; constrained supply supports both.
Investment metrics
- 1% rule
- 1.03% ✓
- Cap rate
- 7.08%
- Cash-on-cash
- 2.81%
- DSCR
- 1.13
- GRM
- 8.1
CMA / ARV
No comps found within radius.
Projected returns pro-forma
-3.0% appreciation · 3.0% rent growth · sell at horizon
- IRR
- -11.8%
- Equity multiple
- 0.57×
- Total profit
- $-32,330
- Equity at exit
- $40,258
- IRR
- -2.6%
- Equity multiple
- 0.83×
- Total profit
- $-13,056
- Equity at exit
- $23,345
Cash invested: $75,600 (down + closing). Projections, not guarantees.
Landlord ↔ Tenant lean methodology
- Overall (STATE)
- 46 Balanced
- State Minnesota
- 46 Balanced · D+2
- County
- — inherits STATE
- City
- — inherits STATE
ZIP-level market 55301
- Home prices YoY
- -14.2%
- Active inventory
- 143
- Price-to-rent
- 8.1×
Monthly cashflow live
- Estimated rent
- $2,789 medium interval (Pro) →
- Mortgage (P&I)
- −$1,416
- Tax from tax record
- −$188 /mo · $2,254/yr
- Insurance
- −$112
- HOA
- −$310
- Vacancy / Maint / Mgmt
- −$586
- Net cashflow
- $177
Break-even live
Sensitivity live
| Price | -10% $330 | -5% $254 | +0% $177 | +5% $101 | +10% $24 |
|---|---|---|---|---|---|
| Rent | -10% $-43 | -5% $67 | +0% $177 | +5% $287 | +10% $397 |
| Rate | -1.0pp $313 | -0.5pp $246 | base $177 | +0.5pp $107 | +1.0pp $36 |
UW: 25.0% down · 7.5% · 30yr · 1.5% tax · 5.0% vac · 8.0% maint · 8.0% mgmt
Financing live
Cash to close
- Down payment
- $67,500
- Closing costs
- $8,100
- Reserves months
- —
- Total cash needed
- —
Loan-product check · same deal, 3 products live
Conventional
25% down · 7.5% · 30yr
- Down + closing
- —
- Monthly P&I
- —
- Monthly cashflow
- —
- DSCR
- —
- Eligible?
- —
Personal DTI + credit; lowest rate.
DSCR
20% down · 8.5% · 30yr
- Down + closing
- —
- Monthly P&I
- —
- Monthly cashflow
- —
- DSCR
- —
- Eligible?
- —
No personal income docs; deal must DSCR.
Hard money
10% down · 12.0% · 12mo
- Down + closing
- —
- Monthly P&I
- —
- Monthly cashflow
- —
- DSCR
- —
- Eligible?
- —
Short-term bridge; refi at stabilization.
Rent comps 2 comps
| Address | Beds | Baths | Sqft | Rent | $/sqft | DOM | Units | Dist |
|---|---|---|---|---|---|---|---|---|
| 7712 Lachman Ave NE Albertville, MN | 3.0 | 2.0 | 1525 | $2,259 | $1.48 | 0d | 1 | 0.12mi |
| 10740 County Road 37 NE Albertville, MN | 2.0–3.0 | 1.0–2.0 | 1092 | $1,740 | $1.59 | 0d | 4 | 1.40mi |
HOA detail
- Monthly dues
- $310 · $3,720/yr
Listing history 9 events
-
2026-06-21days on market $270,000 Active 13 DOM
-
2026-06-18days on market $270,000 Active 10 DOM
-
2026-06-17pricedays on market $270,000 Active 9 DOM
-
2026-06-16days on market $280,000 Active 8 DOM
-
2026-06-15days on market $280,000 Active 7 DOM
-
2026-06-13days on market $280,000 Active 5 DOM
-
2026-06-13days on market $280,000 Active 4 DOM
-
2026-06-08remarks 354-char remark
-
2026-06-08$280,000 Active 1 DOM
ⓘ Source: listings_history table (triggers on properties + properties_extension) + one-shot
backfill from property_details.listing_events for pre-trigger history.
Tax reassessment forecast MN · Partial reset (capped growth)
- Current annual tax
- $2,254 · $188/mo
- Projected year-2 tax
- $2,639 · $220/mo
- Expected delta
- +$385/yr (+$32/mo · 17.1%)
ⓘ Screening estimate from a state-policy table — verify with the county assessor before closing.
Climate risk First Street
- Flood 1/10 Low FEMA zone X · 0% chance over 30 yrs
- Wildfire 1/10 Low
- Heat 2/10 Low 7 d/yr ≥99°F today · 14 d/yr by 30 yrs out
- Wind 2/10 Low
- Air quality 2/10 Low 1 unhealthy d/yr today · 2 by 30 yrs out
Nearby sold comps map
Loading sold comps map…
Walkable amenities ~0.75 mi
Loading nearby amenities…
Taxation est. · year 1
- Rental income
- $33,469
- − Mortgage interest
- −$15,124
- − Property taxes
- −$2,254
- − Insurance
- −$1,350
- − Repairs & maintenance
- −$2,677
- − Management
- −$2,677
- − HOA
- −$3,720
- − Depreciation
- −$7,855
- Taxable loss
- −$2,189
- Est. tax savings @ 24.0%
- +$525
- After-tax cash flow
- $2,651/yr
For passive investors: Depreciation is non-cash, so a rental often shows a tax loss while cash-flowing — sheltering income. Rental losses are passive: they offset passive income freely, and up to $25,000/yr can offset ordinary (W-2) income if you actively participate and your MAGI is under $100k (phasing out to $0 by $150k); unused losses carry forward. On sale, claimed depreciation is recaptured at up to 25%, and gains may owe capital-gains tax (a 1031 exchange can defer both). Figures are a year-1 estimate at your 24.0% rate — not tax advice; consult a CPA.
Schools (NCES district)
- District
- Independent School District 728
- NCES district ID
- 2711370
- Math proficiency
- 56% ▼ -15.00%
- Reading proficiency
- 60% ▼ -10.00%
- Median HH income
- $82,336
- Composite
- 52.5/100
- National rank
- #1567
- State rank
- #37 of 301 in MN
Livability — Otsego
- Score
- 69/100
- State rank
- #367
- US rank
- #8641
Category grades
Schools grade is shown separately in the Schools card above.
Census & demographics
- Census place
- Otsego, MN
- County
- Wright County · 79,164 people
- Metro
- Minneapolis-St. Paul-Bloomington, MN-WI
- Population (ZIP)
- 13,482
- Household income
- $129,232
- Rent vs Own
- Severe rent burden
- 50.0
Population outlook (Wright County) Hauer SSP2
- Today (2025)
- 142,526 people
- By 2030
- 146,915 · +3.1%
- By 2040
- 153,625 · +7.8%
- By 2050
- 155,416 · +9.0%
- By 2075
- 150,352 · +5.5%
- By 2100
- 130,631 · -8.3%
Race, ethnicity, and origin ACS 2023
- Neighborhood character
- Predominantly White (85%)
- Race & ethnicity
- White 85% Black 7% Two or more races 5% Asian 2%
- Common ancestry
- Portuguese 10% Romanian 5% Lithuanian 4%
- Foreign-born
- 7% · South Korea, China, Canada
Political lean MEDSL · Wright
- 2024 margin
- Strong R (+29.4) · D 34.4% · R 63.8% · Other 1.8%
- 2008→2024 swing
- -11.9pp toward R · 2008: -17.4pp · 2024: -29.4pp
- All cycles
- 2024: R+29.4 2020: R+28.6 2016: R+33.2 2012: R+21.4 2008: R+17.4
Not yet ingested
- Civics
- —
Market trends
- HPI YoY
- ▼ -38.52%
- Current HPI
- 233.6299
- Rent YoY
- —
- Metro
- Minneapolis-St. Paul-Bloomington, MN-WI
- State GDP YoY
- ▲ 2.41%
- F500 in state
- 34
Industry mix (Fortune 500 HQ in MN)
| Industry | F500 HQs | Revenue |
|---|---|---|
| Healthcare | 2 | $407B |
|
||
| Retail | 2 | $150B |
|
||
| Consumer Goods | 2 | $32B |
|
||
| Industrial Machinery | 2 | $6B |
|
||
| Agriculture | 1 | $40B |
|
||
| Healthcare / Medical Devices | 1 | $32B |
|
||
Price history
+17.9% since first listed7 events — show timeline
- 2026-06-08 Listed $280,000 NORTHSTARMLS as Distributed by MLS Grid
- 2021-08-12 Sold (Public Records) $250,000 Public Records
- 2021-08-10 Sold (MLS) $250,000 NORTHSTARMLS as Distributed by MLS Grid
- 2021-08-01 Pending — NORTHSTARMLS as Distributed by MLS Grid
- 2021-07-11 Contingent — NORTHSTARMLS as Distributed by MLS Grid
- 2021-07-09 Listed $237,500 NORTHSTARMLS as Distributed by MLS Grid
- 2021-07-03 Coming Soon $237,500 NORTHSTARMLS as Distributed by MLS Grid
Property tax history
+2.7%/yrLatest (2025): $2,254 · -5.4% YoY. Source: county tax records.
Cash-flow waterfall
monthlySold comps — $/sqft
last 12 mo · ≤1 miLoading sold comps…