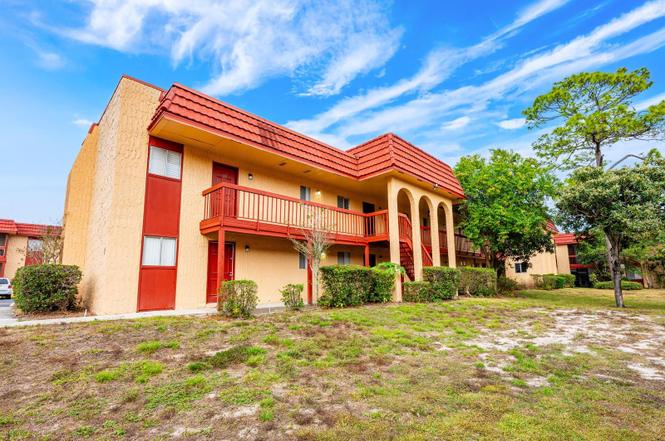
2860 N Powers Dr #134 · Pine Hills, FL
Flood risk 1/10 · Minimal
- FEMA flood zone
- X (unshaded)
- Chance of flooding over 30 yrs
- 0.0%
- Est. flood insurance / yr
- $507 – $1,088
Fire risk 1/10 · Minimal
- Est. fire insurance / yr
- $947 – $1,759
Heat risk 9/10 · Severe
- Hot days now (above 108°F)
- 7 days/yr
- Hot days in 30 yrs
- 23 days/yr
Wind risk 9/10 · Severe
- Chance of severe wind over 30 yrs
- 99.0%
Air-quality risk 1/10 · Minimal
- Unhealthy air days now
- 0 days/yr
- Unhealthy air days in 30 yrs
- 0 days/yr
Risk factors via First Street. Map © Google.
Why this score? — see what drove the C grade
The composite is a weighted blend of 9 inputs, each scored 0–100. Each bar is that input's sub-score; the figure is the points it added to the 100-point composite (weight × sub-score).
- Cash flow +21.8/30.0
- 1% rule +9.6/10.0
- ARV discount +7.5/15.0
- DSCR +7.0/10.0
- Schools +4.1/10.0
- Livability +3.7/5.0
- Condition / age +2.5/5.0
- Rent growth +1.8/5.0
- Appreciation +0.0/10.0
$85,000
🖨 Deal sheet (PDF) 📄 Offer letter ✓ Due diligence
Listing remarks
Experience modern living in this BEAUTIFULLY REMODELED 1-bedroom, 1-bath, 672 SQFT PRIMARY RESIDENCE ONLY condo located in the gated community of Oak Shadows at 2860 N Powers Dr, Unit #134 in Orlando. FULLY UPDATED in 2022, this move-in-ready home features new VINYL FLOORING, a stylish upgraded kitchen with 2022 appliances, and a 2022 AC SYSTEM for year-round comfort. Enjoy a spacious layout with a large covered patio—perfect for relaxing or entertaining—and take advantage of community amenities including secure gated entry, TENNIS COURTS, lush grounds, and a sparkling COMMUNITY POOL. With a low HOA of just $266/month for PRIMARY HOMEOWNERS, this condo is ideal for first-time bu
Key facts
- Upgraded kitchen
- 2022 appliances
- Large covered patio
Tags
Property features AI
Finance
- Other: Unfurnished unit; Third-party listing; Home warranty: none
- Financial info: Total monthly fees reported as $266; Total annual fees reported as $3,192
- HOA & community: Monthly condo fee of $266; Association requires fees and includes management, maintenance of structure and grounds, pool, sewer, trash and water; Association amenities include gated access, maintenance, park and pool; Community features: buyer approval required, park, pool; Pets allowed with restrictions (cats and dogs allowed; breed restrictions apply)
Exterior
- Parking: No designated parking listed
- Security: Smoke detector(s)
- Utilities: Public sewer; Water connected; Sewer connected; Electricity connected; Cable available; Water source not specified
- Home design: Condominium; Residential property; One level interior layout; Faces east; 2 total stories in building; Unit on floor 2
- Construction: Stucco exterior; Shingle roof; Slab foundation; Built on a lot of approximately 0.14 acres
- Exterior features: Awnings
Interior
- Kitchen: Disposal; Range; Refrigerator; Electric water heater
- Bedrooms: 1 bedroom (located on 2nd floor)
- Bathrooms: 1 full bathroom
- Heating & cooling: Central heat; Central air conditioning
- Interior features: No notable interior features listed; Smoke detectors installed
- Laundry & utility: Laundry located outside the unit
Neighborhood map
What this means for you Summary
Snapshot
- This is a 1-bed/1.0-bath condo listed at $85k.
Deal economics
- At list price, monthly cash flow is $132 ($2k/yr) — positive.
- The deal already cash-flows at list — no discount required.
- Meets the 1% rule at list price ($1k rent vs $85k).
- Recommended offer: $75k (12.0% below list) — sets the bar for market timing.
- Cap rate 8.1% vs local median 4.9% in Pine Hills — top-decile yield for the area; either an underpriced asset or a hidden risk that comps aren't pricing in. Stress-test before assuming the spread holds.
Location & tenants
- Location reads 73/100 on livability (#317 in FL) — a middle-class / working-renter tenant base. Strengths: commute A+, cost of living A+, housing A+; Watch: crime D+, employment D, amenities F.
- Orange (suburban): math 46% / reading 51% proficiency, ranked #43 of 73 in FL (top 59%) — families likely to look elsewhere, expect single-tenant / working-renter base with shorter leases.
- Zoned schools: Ridgewood Park Elementary (math 19% / reading 25%, grade F, #2,080 of 2,144 statewide, top 97%, 460 students, 81% FRL); Meadowbrook Middle (math 24% / reading 24%, grade F, #532 of 571 statewide, top 94%, 957 students, 78% FRL); Maynard Evans High (math 12% / reading 27%, grade F, #562 of 667 statewide, top 85%, 2,417 students, 69% FRL) — zoned schools average 76% FRL vs 56% district-wide (20 pts higher); higher-poverty schools than district average — tighter screening recommended.
- Zoned-school proficiency averages 22% at this address vs 48% district-wide (-27 pts) — the specific schools serving this property underperform the Orange average; the district grade overstates school quality for this exact location.
- Market conditions: Rents soft (-2.7%/yr); 181 active listings in the ZIP; 3 comparable units currently listed for rent nearby; rentals at typical pace (median 26d on market — plan ~3-4 weeks tenant-placement turnaround); 8,053 units permitted in Orange County in 2024 (3,133 in 5+ unit buildings).
Forward outlook
- Local home prices are declining (-3.0%/yr); year-one equity from $588 of loan paydown is wiped out by about $3k of value loss. Plan a longer hold.
- Orange County population projected at +52% by 2050 — long-run rental-demand tailwind backs the buy-and-hold thesis.
Negotiation context
- It's been on market 201 days — a 12% lower offer ($75k) is reasonable based on typical stale-listing flexibility.
- Current owner paid $55k; list at $85k implies a 55% gain — meaningful room to come down on a strong offer.
Risks & watch-outs
- Watch-outs: HOA is 21% of rent.
- Climate carrying-cost: severe wind risk, 99% chance of damaging wind over 30y; extreme-heat days projected 7→23/yr by 2055 (HVAC capex compounding) — expect insurance premiums to compound above CPI over the hold.
Questions for the listing agent
- It's been on market 201 days. Have you received any prior offers? Is the seller open to a 12% concession, seller financing, or rate buy-down credit?
- Built in 1979 — when were the roof, HVAC, electrical panel, plumbing, and water heater last replaced?
- What does the HOA fee cover, when was the last increase, and are there any pending special assessments or reserve-fund shortfalls?
- Any open or pending special assessments — roof, HVAC, plumbing, elevator, façade? What's the per-unit balance and payoff schedule, and is the seller paying it off at close or rolling it to the buyer?
- Why hasn't it sold? Are there any deal-killer items the seller is aware of (foundation, flood, title, zoning, code violations)?
- Is there a deadline driving the sale (1031 exchange, divorce, estate, relocation)? That informs how much negotiation room exists.
- Schools are B-rated — typically a magnet for longer-tenancy family renters. What's the average tenant stay here, and is there a school-zone premium baked into asking?
- Crime grade is D in this area — have there been break-ins, vandalism, or insurance claims at this property in the last 3 years? What carrier currently insures it and at what premium?
- What's the average days-on-market for RENTAL listings here right now (not sales)? A rising rental-DOM trend means longer vacancies and softer asking-rent achievability than the comps imply.
- What's the recent tenant-quality profile in this submarket — average credit score on applications, eviction rate, late-payment / NSF rate, and stable-employment percentage? A property-management company in the area should have these aggregated.
- How much new apartment / multifamily construction is in the pipeline within 1–3 miles? Heavy new supply (>2% of stock underway) typically softens rents 12–24 months out; light construction supports rent growth.
Investment metrics
- 1% rule
- 1.46% ✓
- Cap rate
- 8.15%
- Cash-on-cash
- 6.63%
- DSCR
- 1.30
- GRM
- 5.7
CMA / ARV
No comps found within radius.
Projected returns pro-forma
-3.0% appreciation · 0.0% rent growth · sell at horizon
- IRR
- -10.7%
- Equity multiple
- 0.63×
- Total profit
- $-8,862
- Equity at exit
- $12,674
- IRR
- -8.5%
- Equity multiple
- 0.57×
- Total profit
- $-10,290
- Equity at exit
- $7,349
Cash invested: $23,800 (down + closing). Projections, not guarantees.
Landlord ↔ Tenant lean methodology
- Overall (STATE)
- 87 Strongly Landlord-Friendly
- State Florida
- 87 Strongly Landlord-Friendly · R+3
- County
- — inherits STATE
- City
- — inherits STATE
ZIP-level market 32818
- Home prices YoY
- -22.5%
- Rents YoY
- -2.7%
- Active inventory
- 181
- Price-to-rent
- 5.7×
Monthly cashflow live
- Estimated rent
- $1,245 medium interval (Pro) →
- Mortgage (P&I)
- −$446
- Tax from tax record
- −$105 /mo · $1,255/yr
- Insurance
- −$35
- HOA
- −$266
- Vacancy / Maint / Mgmt
- −$261
- Net cashflow
- $132
Break-even live
Sensitivity live
| Price | -10% $180 | -5% $156 | +0% $132 | +5% $107 | +10% $83 |
|---|---|---|---|---|---|
| Rent | -10% $33 | -5% $82 | +0% $132 | +5% $181 | +10% $230 |
| Rate | -1.0pp $174 | -0.5pp $153 | base $132 | +0.5pp $110 | +1.0pp $87 |
UW: 25.0% down · 7.5% · 30yr · 1.5% tax · 5.0% vac · 8.0% maint · 8.0% mgmt
Financing live
Cash to close
- Down payment
- $21,250
- Closing costs
- $2,550
- Reserves months
- —
- Total cash needed
- —
Loan-product check · same deal, 3 products live
Conventional
25% down · 7.5% · 30yr
- Down + closing
- —
- Monthly P&I
- —
- Monthly cashflow
- —
- DSCR
- —
- Eligible?
- —
Personal DTI + credit; lowest rate.
DSCR
20% down · 8.5% · 30yr
- Down + closing
- —
- Monthly P&I
- —
- Monthly cashflow
- —
- DSCR
- —
- Eligible?
- —
No personal income docs; deal must DSCR.
Hard money
10% down · 12.0% · 12mo
- Down + closing
- —
- Monthly P&I
- —
- Monthly cashflow
- —
- DSCR
- —
- Eligible?
- —
Short-term bridge; refi at stabilization.
Rent comps 3 comps
| Address | Beds | Baths | Sqft | Rent | $/sqft | DOM | Units | Dist |
|---|---|---|---|---|---|---|---|---|
| 5600 Silver Star Rd Orlando, FL | 1.0–3.0 | 1.0–2.0 | 850 | $1,075 | $1.26 | 16d | 6 | 0.62mi |
| 5505 Hernandes Dr #113 Orlando, FL | 2.0 | 1.0 | 728 | $1,175 | $1.61 | 25d | 1 | 1.09mi |
| 4757 Silver Star Rd Orlando, FL | 1.0 | 1.0 | 728 | $1,189 | $1.63 | 25d | 1 | 1.48mi |
HOA detail condo
- Monthly dues
- $266 · $3,192/yr
- Likely covers
- landscapingpoolsecurity
- Assessments
- None detected in remarks — confirm with the listing agent.
Listing history 19 events
-
2026-06-21days on market $85,000 Active 201 DOM
-
2026-06-18days on market $85,000 Active 198 DOM
-
2026-06-17days on market $85,000 Active 197 DOM
-
2026-06-16days on market $85,000 Active 196 DOM
-
2026-06-15days on market $85,000 Active 195 DOM
-
2026-06-13days on market $85,000 Active 193 DOM
-
2026-06-13days on market $85,000 Active 192 DOM
-
2026-06-09days on market $85,000 Active 189 DOM
-
2026-06-08days on market $85,000 Active 188 DOM
-
2026-06-07days on market $85,000 Active 187 DOM
-
2026-06-04days on market $85,000 Active 184 DOM
-
2026-06-03days on market $85,000 Active 183 DOM
-
2026-06-02days on market $85,000 Active 182 DOM
-
2026-06-02days on market $85,000 Active 181 DOM
-
2026-05-31days on market $85,000 Active 180 DOM
-
2026-02-22price $85,000
-
2025-12-02$95,000 Active
-
2022-03-18soldstatus $55,000
-
1981-11-01soldstatus $25,000
ⓘ Source: listings_history table (triggers on properties + properties_extension) + one-shot
backfill from property_details.listing_events for pre-trigger history.
Tax reassessment forecast FL · Resets to sale price
- Current annual tax
- $1,255 · $105/mo
- Projected year-2 tax
- $1,255 · $105/mo
- Expected delta
- $0/yr ($0/mo · 0.0%)
ⓘ Screening estimate from a state-policy table — verify with the county assessor before closing.
Climate risk First Street
- Flood 1/10 Low FEMA zone X (unshaded) · 0% chance over 30 yrs
- Wildfire 1/10 Low
- Heat 9/10 Extreme 7 d/yr ≥108°F today · 23 d/yr by 30 yrs out
- Wind 9/10 Extreme 99% chance of damaging wind over 30 yrs
- Air quality 1/10 Low 0 unhealthy d/yr today · 0 by 30 yrs out
Nearby sold comps map
Loading sold comps map…
Walkable amenities ~0.75 mi
Loading nearby amenities…
Taxation est. · year 1
- Rental income
- $14,936
- − Mortgage interest
- −$4,761
- − Property taxes
- −$1,255
- − Insurance
- −$425
- − Repairs & maintenance
- −$1,195
- − Management
- −$1,195
- − HOA
- −$3,192
- − Depreciation
- −$2,473
- Taxable income
- $440
- Est. tax owed @ 24.0%
- −$106
- After-tax cash flow
- $1,473/yr
For passive investors: Depreciation is non-cash, so a rental often shows a tax loss while cash-flowing — sheltering income. Rental losses are passive: they offset passive income freely, and up to $25,000/yr can offset ordinary (W-2) income if you actively participate and your MAGI is under $100k (phasing out to $0 by $150k); unused losses carry forward. On sale, claimed depreciation is recaptured at up to 25%, and gains may owe capital-gains tax (a 1031 exchange can defer both). Figures are a year-1 estimate at your 24.0% rate — not tax advice; consult a CPA.
Schools (NCES district)
- District
- Orange
- NCES district ID
- 1201440
- Math proficiency
- 46% ▼ -9.00%
- Reading proficiency
- 51% ▼ -2.00%
- Median HH income
- $49,350
- Composite
- 41.47/100
- National rank
- #3461
- State rank
- #43 of 73 in FL
Livability — Pine Hills
- Score
- 73/100
- State rank
- #317
- US rank
- #5362
Category grades
Schools grade is shown separately in the Schools card above.
Census & demographics
- Census place
- Pine Hills, FL
- County
- Orange County · 1,471,359 people
- City population
- 60,203
- Metro
- Orlando-Kissimmee-Sanford, FL
- Population (ZIP)
- 59,114
- Household income
- $63,061
- Rent vs Own
- Severe rent burden
- 2059.0
Population outlook (Orange County) Hauer SSP2
- Today (2025)
- 1,618,226 people
- By 2030
- 1,787,404 · +10.5%
- By 2040
- 2,125,621 · +31.4%
- By 2050
- 2,454,016 · +51.6%
- By 2075
- 3,173,711 · +96.1%
- By 2100
- 3,607,781 · +122.9%
Race, ethnicity, and origin ACS 2023
- Neighborhood character
- Predominantly Black (69%)
- Race & ethnicity
- Black 69% Hispanic / Latino 14% White 10% Two or more races 6% Asian 3%
- Hispanic origin (detail)
- Mexican 3% Puerto Rican 5% Cuban 1%
- Common ancestry
- Hispanic 21% Estonian 1% Romanian 1%
- Foreign-born
- 40% · Canada, Vietnam, China
- Languages at home
- 59% English-only · French/Haitian/Cajun 25% Spanish 11% Vietnamese 2%
Political lean MEDSL · Orange
- 2024 margin
- D (+13.6) · D 56.1% · R 42.5% · Other 1.3%
- 2008→2024 swing
- -5.0pp toward R · 2008: 18.6pp · 2024: 13.6pp
- All cycles
- 2024: D+13.6 2020: D+23.1 2016: D+24.6 2012: D+18.2 2008: D+18.6
Not yet ingested
- Civics
- —
Market trends
- HPI YoY
- ▼ -93.40%
- Current HPI
- 321.5821
- Rent YoY
- ▼ -2.66%
- Metro
- Orlando-Kissimmee-Sanford, FL
- State GDP YoY
- ▲ 3.28%
- F500 in state
- 36
Industry mix (Fortune 500 HQ in FL)
| Industry | F500 HQs | Revenue |
|---|---|---|
| Industrial Technology | 2 | $29B |
|
||
| Insurance | 2 | $17B |
|
||
| Retail | 1 | $60B |
|
||
| Technology Distribution | 1 | $58B |
|
||
| Homebuilding | 1 | $35B |
|
||
| Technology Manufacturing | 1 | $35B |
|
||
Price history
+240.0% since first listed4 events — show timeline
- 2026-02-22 Price Changed $85,000 Stellar MLS as Distributed by MLS Grid
- 2025-12-02 Listed $95,000 Stellar MLS as Distributed by MLS Grid
- 2022-03-18 Sold (Public Records) $55,000 Public Records
- 1981-11-01 Sold (Public Records) $25,000 Public Records
Property tax history
+13.3%/yrLatest (2025): $1,255 · +22.8% YoY. Source: county tax records.
Cash-flow waterfall
monthlySold comps — $/sqft
last 12 mo · ≤1 miLoading sold comps…