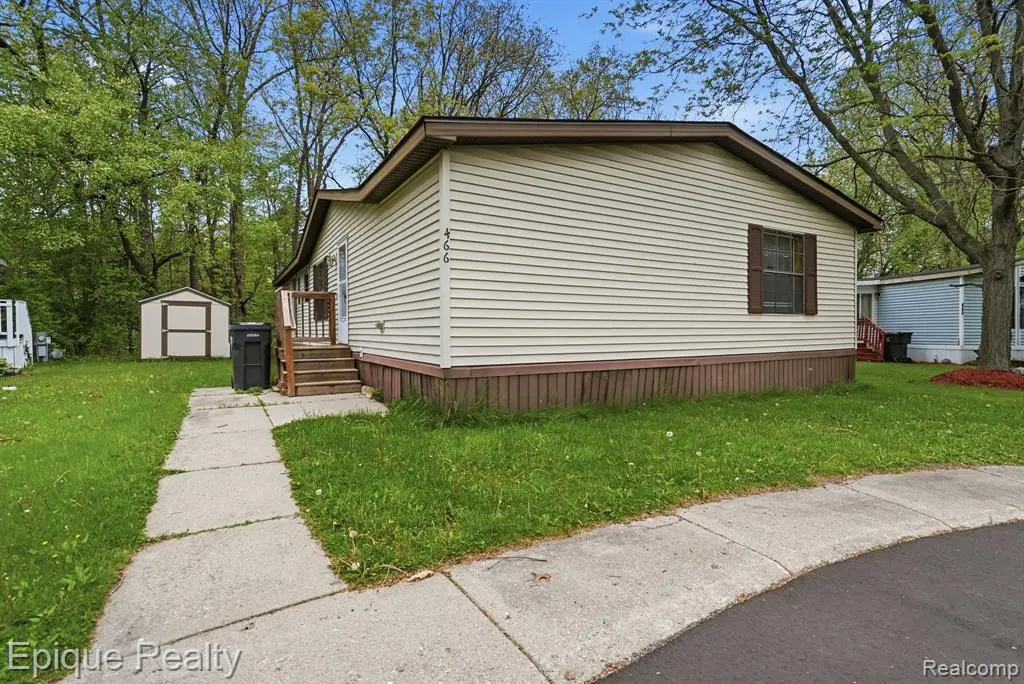
466 Turquoise Dr · Whitmore Lake, MI
Flood risk 1/10 · Minimal
- FEMA flood zone
- X (unshaded)
- Chance of flooding over 30 yrs
- 0.0%
- Est. flood insurance / yr
- $507 – $1,088
Fire risk 2/10 · Minimal
- Est. fire insurance / yr
- $784 – $1,456
Heat risk 3/10 · Minor
- Hot days now (above 97°F)
- 7 days/yr
- Hot days in 30 yrs
- 15 days/yr
Wind risk 2/10 · Minimal
- Chance of severe wind over 30 yrs
- —
Air-quality risk 2/10 · Minimal
- Unhealthy air days now
- 1 days/yr
- Unhealthy air days in 30 yrs
- 3 days/yr
Risk factors via First Street. Map © Google.
Why this score? — see what drove the D grade
The composite is a weighted blend of 9 inputs, each scored 0–100. Each bar is that input's sub-score; the figure is the points it added to the 100-point composite (weight × sub-score).
- Cash flow +15.0/30.0
- ARV discount +7.5/15.0
- 1% rule +5.0/10.0
- DSCR +5.0/10.0
- Livability +3.6/5.0
- Schools +3.4/10.0
- Rent growth +2.5/5.0
- Condition / age +2.5/5.0
- Appreciation +0.0/10.0
$24,000
🖨 Deal sheet 📄 Offer letter ✓ Due diligence
Listing remarks MLS
Discover the inviting single-family residence at 466 Turquoise DR in Northfield Township, MI. Built in 1988, this home is ready to move in, offering a seamless transition to a lifestyle of comfort and ease. The principal bedroom provides a private retreat, featuring an ensuite bathroom for ultimate convenience. This dedicated space ensures privacy and comfort. Thoughtfully designed for daily living, a bathroom is appointed with two sinks, streamlining morning routines and offering ample personal space. The dedicated laundry room adds to the home's practical appeal, making everyday tasks effortlessly manageable. This property presents an exceptional opportunity to embrace a vibrant and comfortable living experience. Lot rent is $657 a month
Key facts
- Built 1988
- Listed 16 days
Property features AI
Exterior
- Parking: No garage
- Utilities: Public water; Public sewer
- Home design: Single-family residence; Residential property; One story; Ground-level entry
- Construction: Vinyl siding; Pillar/post/pier foundation; Built as a single-level structure
- Exterior features: Paved road access; Irregular lot shape; Located in NORTHFIELD ESTATES MOBILE HOME COMMUNITY
Interior
- Bathrooms: 2 full bathrooms
- Heating & cooling: Forced air heating (natural gas); ENERGY STAR qualified heating equipment; No central cooling
- Interior features: 3 total rooms; One-level, ground-level entry
Neighborhood map
What this means for you Summary
Snapshot
- This is a 3-bed/1.0-bath manufactured listed at $24k.
Deal economics
- At list price, monthly cash flow is $1k ($18k/yr) — positive.
- The deal already cash-flows at list — no discount required.
- Meets the 1% rule at list price ($2k rent vs $24k).
- Recommended offer: $24k (1.5% below list) — sets the bar for market timing.
- Cap rate 81.1% vs local median 2.8% in Whitmore Lake — top-decile yield for the area; either an underpriced asset or a hidden risk that comps aren't pricing in. Stress-test before assuming the spread holds.
Location & tenants
- Location reads 71/100 on livability (#279 in MI) — a middle-class / working-renter tenant base. Strengths: crime A+, cost of living A+, housing A+; Watch: amenities F, commute F, health & safety F.
- Whitmore Lake Public School District (rural): math 34% / reading 44% proficiency, ranked #213 of 540 in MI (top 39%) — families likely to look elsewhere, expect single-tenant / working-renter base with shorter leases.
- Market conditions: 87 active listings in the ZIP; 2 comparable units currently listed for rent nearby; solid renter incomes; 996 units permitted in Washtenaw County in 2024 (492 in 5+ unit buildings).
Forward outlook
- Local home prices are declining (-3.0%/yr); year-one equity from $166 of loan paydown is wiped out by about $720 of value loss. Plan a longer hold.
- Washtenaw County population projected at +25% by 2050 — long-run rental-demand tailwind backs the buy-and-hold thesis.
- At projected returns (-3.0% appreciation + 3.0% rent growth), your $7k cash investment doubles in ~1 year — after that, you're playing with house money.
Negotiation context
- It's been on market 16 days — a 2% lower offer ($24k) is reasonable based on typical stale-listing flexibility.
- 2 sale attempts with the ask held roughly flat each time — persistent listings suggest the price (not the market) is what's stuck; bring a comps-based counter.
Questions for the listing agent
- Is there a deadline driving the sale (1031 exchange, divorce, estate, relocation)? That informs how much negotiation room exists.
- The area grade is low — what's the realistic commute time and amenity access for the typical tenant pool here? Any planned neighborhood developments (good or bad) we should know about?
- What's the average days-on-market for RENTAL listings here right now (not sales)? A rising rental-DOM trend means longer vacancies and softer asking-rent achievability than the comps imply.
- What's the recent tenant-quality profile in this submarket — average credit score on applications, eviction rate, late-payment / NSF rate, and stable-employment percentage? A property-management company in the area should have these aggregated.
- How much new for-sale + rental construction is in the pipeline within 1–3 miles? Heavy new supply typically softens prices + rents 12–24 months out; constrained supply supports both.
Investment metrics
- 1% rule
- 8.76% ✓
- Cap rate
- 81.08%
- Cash-on-cash
- 267.09%
- DSCR
- 12.88
- GRM
- 1.0
CMA / ARV
No comps found within radius.
Projected returns pro-forma
-3.0% appreciation · 3.0% rent growth · sell at horizon
- IRR
- —
- Equity multiple
- 14.60×
- Total profit
- $91,406
- Equity at exit
- $3,578
- IRR
- —
- Equity multiple
- 31.12×
- Total profit
- $202,391
- Equity at exit
- $2,075
Cash invested: $6,720 (down + closing). Projections, not guarantees.
Landlord ↔ Tenant lean methodology
- Overall (STATE)
- 62 Landlord-Friendly
- State Michigan
- 62 Landlord-Friendly · EVEN
- County
- — inherits STATE
- City
- — inherits STATE
ZIP-level market 48189
- Active inventory
- 87
- Price-to-rent
- 1.0×
Monthly cashflow live
- Estimated rent
- $2,103 medium interval (Pro) →
- Mortgage (P&I)
- −$126
- Tax est. 1.5%
- −$30 /mo · $360/yr
- Insurance
- −$10
- HOA
- −$0
- Vacancy / Maint / Mgmt
- −$442
- Net cashflow
- $1,496
Break-even live
UW: 25.0% down · 7.5% · 30yr · 1.5% tax · 5.0% vac · 8.0% maint · 8.0% mgmt
Financing live
Cash to close
- Down payment
- $6,000
- Closing costs
- $720
- Reserves months
- —
- Total cash needed
- —
Loan-product check · same deal, 3 products live
Conventional
25% down · 7.5% · 30yr
- Down + closing
- —
- Monthly P&I
- —
- Monthly cashflow
- —
- DSCR
- —
- Eligible?
- —
Personal DTI + credit; lowest rate.
DSCR
20% down · 8.5% · 30yr
- Down + closing
- —
- Monthly P&I
- —
- Monthly cashflow
- —
- DSCR
- —
- Eligible?
- —
No personal income docs; deal must DSCR.
Hard money
10% down · 12.0% · 12mo
- Down + closing
- —
- Monthly P&I
- —
- Monthly cashflow
- —
- DSCR
- —
- Eligible?
- —
Short-term bridge; refi at stabilization.
Rent comps 2 comps
| Address | Beds | Baths | Sqft | Rent | $/sqft | DOM | Units | Dist |
|---|---|---|---|---|---|---|---|---|
| 158 Emerald Cir Whitmore Lake, MI | 3.0 | 1.0–2.0 | 1216 | $1,500 | $1.23 | 4d | 1 | 0.29mi |
| 11859 N Main St Unit 1 Whitmore Lake, MI | 2.0 | 1.5 | 1173 | $1,595 | $1.36 | 2d | 1 | 1.15mi |
Listing history 4 events
-
2026-06-01status $24,000 Pending 16 DOM
-
2026-05-31days on market $24,000 Active 16 DOM
-
2026-05-14$24,000 Active
Show marketing remark (749 chars)
Discover the inviting single-family residence at 466 Turquoise DR in Northfield Township, MI. Built in 1988, this home is ready to move in, offering a seamless transition to a lifestyle of comfort and ease. The principal bedroom provides a private retreat, featuring an ensuite bathroom for ultimate convenience. This dedicated space ensures privacy and comfort. Thoughtfully designed for daily living, a bathroom is appointed with two sinks, streamlining morning routines and offering ample personal space. The dedicated laundry room adds to the home's practical appeal, making everyday tasks effortlessly manageable. This property presents an exceptional opportunity to embrace a vibrant and comfortable living experience. Lot rent is $657 a month
-
2026-05-14$24,000 Active 749-char remark
Show marketing remark (749 chars)
Discover the inviting single-family residence at 466 Turquoise DR in Northfield Township, MI. Built in 1988, this home is ready to move in, offering a seamless transition to a lifestyle of comfort and ease. The principal bedroom provides a private retreat, featuring an ensuite bathroom for ultimate convenience. This dedicated space ensures privacy and comfort. Thoughtfully designed for daily living, a bathroom is appointed with two sinks, streamlining morning routines and offering ample personal space. The dedicated laundry room adds to the home's practical appeal, making everyday tasks effortlessly manageable. This property presents an exceptional opportunity to embrace a vibrant and comfortable living experience. Lot rent is $657 a month
ⓘ Source: listings_history table (triggers on properties + properties_extension) + one-shot
backfill from property_details.listing_events for pre-trigger history.
Climate risk First Street
- Flood 1/10 Low FEMA zone X (unshaded) · 0% chance over 30 yrs
- Wildfire 2/10 Low
- Heat 3/10 Moderate 7 d/yr ≥97°F today · 15 d/yr by 30 yrs out
- Wind 2/10 Low
- Air quality 2/10 Low 1 unhealthy d/yr today · 3 by 30 yrs out
Nearby sold comps map
Loading sold comps map…
Walkable amenities ~0.75 mi
Loading nearby amenities…
Taxation est. · year 1
- Rental income
- $25,239
- − Mortgage interest
- −$1,344
- − Property taxes
- −$360
- − Insurance
- −$120
- − Repairs & maintenance
- −$2,019
- − Management
- −$2,019
- − Depreciation
- −$698
- Taxable income
- $18,678
- Est. tax owed @ 24.0%
- −$4,483
- After-tax cash flow
- $13,466/yr
For passive investors: Depreciation is non-cash, so a rental often shows a tax loss while cash-flowing — sheltering income. Rental losses are passive: they offset passive income freely, and up to $25,000/yr can offset ordinary (W-2) income if you actively participate and your MAGI is under $100k (phasing out to $0 by $150k); unused losses carry forward. On sale, claimed depreciation is recaptured at up to 25%, and gains may owe capital-gains tax (a 1031 exchange can defer both). Figures are a year-1 estimate at your 24.0% rate — not tax advice; consult a CPA.
Schools (NCES district)
- District
- Whitmore Lake Public School District
- NCES district ID
- 2636330
- Math proficiency
- 34% ▼ -6.00%
- Reading proficiency
- 44% ▼ -5.00%
- Median HH income
- $55,263
- Composite
- 34.13/100
- National rank
- #5286
- State rank
- #213 of 540 in MI
Livability — Whitmore Lake
- Score
- 71/100
- State rank
- #279
- US rank
- #6864
Category grades
Schools grade is shown separately in the Schools card above.
Census & demographics
- Census place
- Whitmore Lake, MI
- County
- Washtenaw County · 306,860 people
- City population
- 13,893
- Metro
- Ann Arbor, MI
- Population (ZIP)
- 13,893
- Household income
- $87,145
- Rent vs Own
- Severe rent burden
- 105.0
Population outlook (Washtenaw County) Hauer SSP2
- Today (2025)
- 402,878 people
- By 2030
- 424,104 · +5.3%
- By 2040
- 464,633 · +15.3%
- By 2050
- 504,728 · +25.3%
- By 2075
- 614,463 · +52.5%
- By 2100
- 676,181 · +67.8%
Race, ethnicity, and origin ACS 2023
- Neighborhood character
- Predominantly White (91%)
- Race & ethnicity
- White 91% Hispanic / Latino 3% Two or more races 3% Black 2% Asian 1%
- Common ancestry
- Romanian 9% Lithuanian 6% Slovak 5%
- Foreign-born
- 3% · Canada
- Languages at home
- 97% English-only · French/Haitian/Cajun 1% Spanish 1%
Political lean MEDSL · Washtenaw
- 2024 margin
- Solid D (+44.4) · D 71.0% · R 26.6% · Other 2.4%
- 2008→2024 swing
- +3.5pp toward D · 2008: 41.0pp · 2024: 44.4pp
- All cycles
- 2024: D+44.4 2020: D+46.6 2016: D+41.5 2012: D+36.0 2008: D+41.0
Not yet ingested
- Civics
- —
Market trends
- HPI YoY
- ▼ -192.47%
- Current HPI
- 187.7383
- Rent YoY
- —
- Metro
- Ann Arbor, MI
- State GDP YoY
- ▲ 1.37%
- F500 in state
- 28
Industry mix (Fortune 500 HQ in MI)
| Industry | F500 HQs | Revenue |
|---|---|---|
| Automotive Parts | 3 | $48B |
|
||
| Automotive | 2 | $372B |
|
||
| Chemicals | 1 | $45B |
|
||
| Automotive Retail | 1 | $29B |
|
||
| Healthcare / Medical Devices | 1 | $23B |
|
||
| Automotive Technology | 1 | $20B |
|
||
Price history
+0.0% since first listed2 events — show timeline
- 2026-05-14 Listed $24,000 MiRealSource-MiMLS
- 2026-05-14 Listed $24,000 REALCOMP
Property tax history
-12.3%/yrLatest (2025): $9 · -75.3% YoY. Source: county tax records.
Cash-flow waterfall
monthlySold comps — $/sqft
last 12 mo · ≤1 miLoading sold comps…