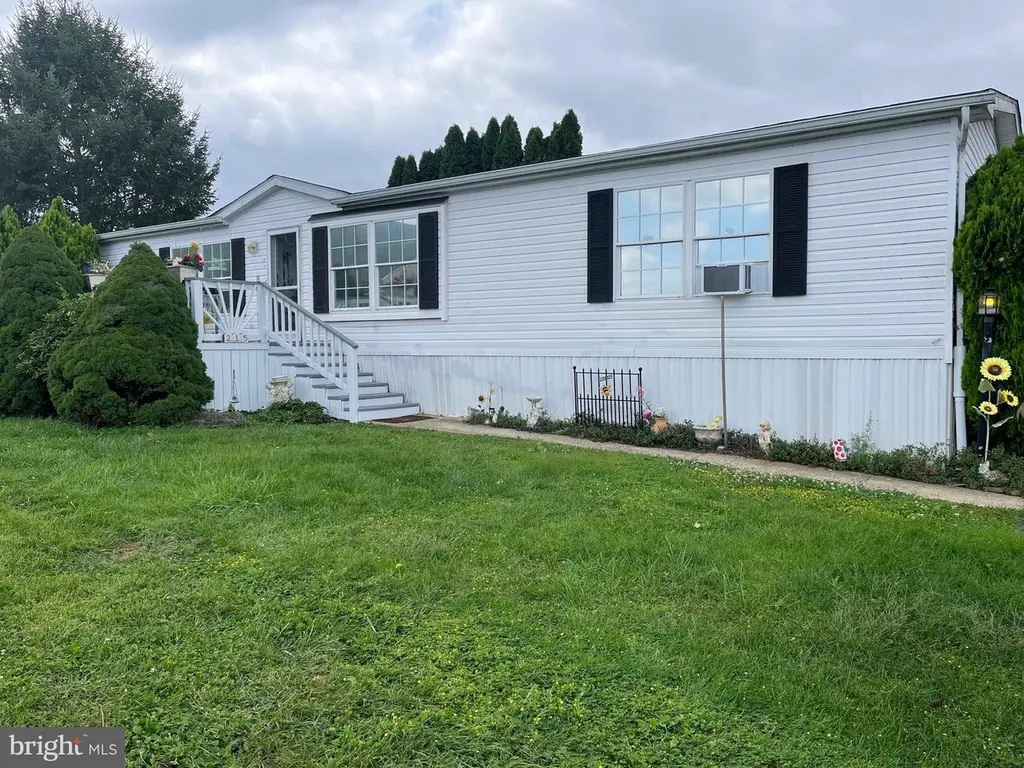
215 Longwood Ct W · Millersville, PA
Flood risk 1/10 · Minimal
- FEMA flood zone
- X (unshaded)
- Chance of flooding over 30 yrs
- 0.0%
- Est. flood insurance / yr
- $507 – $1,088
Fire risk 2/10 · Minimal
- Est. fire insurance / yr
- $511 – $949
Heat risk 6/10 · Moderate
- Hot days now (above 101°F)
- 7 days/yr
- Hot days in 30 yrs
- 15 days/yr
Wind risk 4/10 · Minor
- Chance of severe wind over 30 yrs
- 13.0%
Air-quality risk 4/10 · Minor
- Unhealthy air days now
- 4 days/yr
- Unhealthy air days in 30 yrs
- 7 days/yr
Risk factors via First Street. Map © Google.
Why this score? — see what drove the B grade
The composite is a weighted blend of 9 inputs, each scored 0–100. Each bar is that input's sub-score; the figure is the points it added to the 100-point composite (weight × sub-score).
- Cash flow +30.0/30.0
- 1% rule +10.0/10.0
- DSCR +10.0/10.0
- ARV discount +7.5/15.0
- Schools +5.1/10.0
- Livability +4.2/5.0
- Rent growth +2.6/5.0
- Condition / age +2.5/5.0
- Appreciation +0.0/10.0
$95,000
🖨 Deal sheet 📄 Offer letter ✓ Due diligence
Listing remarks
Located in the desirable Penn Manor School District, this spacious doublewide offers a comfortable and functional layout. Featuring 4 bedrooms and 2 full bathrooms, the home includes two separate living areas—perfect for everyday living and entertaining. One space is currently used as a cozy family/game room, offering flexibility to fit your lifestyle. All major systems are in working order, and the home is situated in a convenient location close to shopping, dining, and local amenities.
Key facts
- Convenient location
- Built 1994
- Listed 5 days
Tags
Property features AI
Finance
- Other: Annual ground rent listed as an income/expense item
- Financial info: Ground rent exists and is paid monthly; Monthly ground rent: $865; Annual taxes reported (2024): $986
- HOA & community: Association fees cover all ground fee, recreation facilities, road maintenance, trash, sewer, and snow removal; Community amenities include basketball courts, exercise room, party room, swimming pool, and playgrounds/tot lots
Exterior
- Parking: Paved parking
- Utilities: Public water; Public sewer; Electric service available; Cable TV available
- Home design: Manufactured double-wide home; Redman model; Good to average condition; Ground rent ownership
- Construction: Frame construction with vinyl siding; Above-grade and below-grade structures
- Exterior features: Deck(s); Not in a federal flood zone; Pets allowed with breed and size/weight restrictions
Interior
- Bedrooms: Four bedrooms on the main level
- Bathrooms: Two full bathrooms (both on main level)
- Heating & cooling: Forced air heating (natural gas); Central air conditioning plus window units; Electric hot water
- Interior features: Estimated living area; Two or more access exits
Neighborhood map
What this means for you Summary
Snapshot
- This is a 2-bed/2.0-bath manufactured listed at $95k.
Deal economics
- At list price, monthly cash flow is $802 ($10k/yr) — positive.
- The deal already cash-flows at list — no discount required.
- Meets the 1% rule at list price ($2k rent vs $95k).
- Cap rate 16.4% vs local median 3.0% in Millersville — top-decile yield for the area; either an underpriced asset or a hidden risk that comps aren't pricing in. Stress-test before assuming the spread holds.
Location & tenants
- Location reads 84/100 on livability (#101 in PA, #728 nationally) — a professional / high-income tenant draw. Strengths: crime A+, cost of living A+, housing A+; Watch: amenities D-, commute F.
- Penn Manor SD (suburban): math 52% / reading 65% proficiency, ranked #80 of 539 in PA (top 15%) — acceptable for families but not a draw, mixed tenant base, ~2y average lease.
- Market conditions: Rents flat; 292 active listings in the ZIP; 12 comparable units currently listed for rent nearby; rentals at typical pace (median 14d on market — plan ~3-4 weeks tenant-placement turnaround); solid renter incomes; 1,093 units permitted in Lancaster County in 2024 (201 in 5+ unit buildings).
Forward outlook
- Local home prices are declining (-3.0%/yr); year-one equity from $657 of loan paydown is wiped out by about $3k of value loss. Plan a longer hold.
- Lancaster County population projected at +5% by 2050 — modest demand growth; plan on rents tracking national, not racing it.
- At projected returns (-3.0% appreciation + 0.5% rent growth), your $27k cash investment doubles in ~4 years — after that, you're playing with house money.
Negotiation context
- Only 5 days on market — expect competitive offers; lowballing is unlikely to land.
- 7 sale attempts since 18y ago with the ask held roughly flat each time — persistent listings suggest the price (not the market) is what's stuck; bring a comps-based counter.
- Current owner paid $44k; list at $95k implies a 118% gain — meaningful room to come down on a strong offer.
Risks & watch-outs
- Climate carrying-cost: extreme-heat days projected 7→15/yr by 2055 (HVAC capex compounding) — expect insurance premiums to compound above CPI over the hold.
Questions for the listing agent
- Is there a deadline driving the sale (1031 exchange, divorce, estate, relocation)? That informs how much negotiation room exists.
- Schools are A-rated — typically a magnet for longer-tenancy family renters. What's the average tenant stay here, and is there a school-zone premium baked into asking?
- What's the average days-on-market for RENTAL listings here right now (not sales)? A rising rental-DOM trend means longer vacancies and softer asking-rent achievability than the comps imply.
- What's the recent tenant-quality profile in this submarket — average credit score on applications, eviction rate, late-payment / NSF rate, and stable-employment percentage? A property-management company in the area should have these aggregated.
- How much new for-sale + rental construction is in the pipeline within 1–3 miles? Heavy new supply typically softens prices + rents 12–24 months out; constrained supply supports both.
Investment metrics
- 1% rule
- 1.90% ✓
- Cap rate
- 16.42%
- Cash-on-cash
- 36.16%
- DSCR
- 2.61
- GRM
- 4.4
CMA / ARV
No comps found within radius.
Projected returns pro-forma
-3.0% appreciation · 0.47% rent growth · sell at horizon
- IRR
- 29.1%
- Equity multiple
- 2.17×
- Total profit
- $31,184
- Equity at exit
- $14,165
- IRR
- 35.0%
- Equity multiple
- 3.84×
- Total profit
- $75,440
- Equity at exit
- $8,214
Cash invested: $26,600 (down + closing). Projections, not guarantees.
Landlord ↔ Tenant lean methodology
- Overall (STATE)
- 62 Landlord-Friendly
- State Pennsylvania
- 62 Landlord-Friendly · EVEN
- County
- — inherits STATE
- City
- — inherits STATE
ZIP-level market 17603
- Rents YoY
- 0.5%
- Active inventory
- 292
- Price-to-rent
- 4.4×
Monthly cashflow live
- Estimated rent
- $1,805 high interval (Pro) →
- Mortgage (P&I)
- −$498
- Tax from tax record
- −$87 /mo · $1,042/yr
- Insurance
- −$40
- HOA
- −$0
- Vacancy / Maint / Mgmt
- −$379
- Net cashflow
- $802
Break-even live
UW: 25.0% down · 7.5% · 30yr · 1.5% tax · 5.0% vac · 8.0% maint · 8.0% mgmt
Financing live
Cash to close
- Down payment
- $23,750
- Closing costs
- $2,850
- Reserves months
- —
- Total cash needed
- —
Loan-product check · same deal, 3 products live
Conventional
25% down · 7.5% · 30yr
- Down + closing
- —
- Monthly P&I
- —
- Monthly cashflow
- —
- DSCR
- —
- Eligible?
- —
Personal DTI + credit; lowest rate.
DSCR
20% down · 8.5% · 30yr
- Down + closing
- —
- Monthly P&I
- —
- Monthly cashflow
- —
- DSCR
- —
- Eligible?
- —
No personal income docs; deal must DSCR.
Hard money
10% down · 12.0% · 12mo
- Down + closing
- —
- Monthly P&I
- —
- Monthly cashflow
- —
- DSCR
- —
- Eligible?
- —
Short-term bridge; refi at stabilization.
Rent comps 12 comps
| Address | Beds | Baths | Sqft | Rent | $/sqft | DOM | Units | Dist |
|---|---|---|---|---|---|---|---|---|
| 250 Stone Mill Rd Lancaster, PA | 1.0–3.0 | 1.0 | 1002 | $1,462 | $1.46 | 14d | 1 | 0.29mi |
| 1415 Spencer Ave Lancaster, PA | 1.0–3.0 | 1.0–2.0 | 1181 | $2,610 | $2.21 | 14d | 1 | 0.77mi |
| 100 Country View Ln Millersville, PA | 1.0–2.0 | 1.0–2.0 | 970 | $1,838 | $1.89 | 14d | 6 | 0.81mi |
| 101 Roselawn Ave Lancaster, PA | 3.0 | 2.0 | 1166 | $1,785 | $1.53 | 14d | 1 | 1.02mi |
| 27 Roselle Ave Lancaster, PA | 2.0 | 1.0 | 1128 | $1,575 | $1.40 | 44d | 1 | 1.05mi |
| 135 Grandview Ave Lancaster, PA | 3.0 | 2.0 | 1395 | $3,295 | $2.36 | 14d | 1 | 1.11mi |
| 1633A Judie Ln Lancaster, PA | 1.0–2.0 | 1.0–2.0 | 848 | $1,698 | $2.00 | 14d | 13 | 1.21mi |
| 1115 Marietta Ave Unit WH15037 Lancaster, PA | 2.0 | 2.0 | 1298 | $1,695 | $1.31 | 44d | 1 | 1.28mi |
| 1831 Hidden Ln Lancaster, PA | 2.0–3.0 | 1.5–2.5 | 1182 | $1,898 | $1.61 | 14d | 3 | 1.44mi |
| 40 Fairview Ave Lancaster, PA | 3.0 | 1.0 | 1152 | $1,700 | $1.48 | 14d | 1 | 1.45mi |
| 741 Manor St Lancaster, PA | 3.0 | 1.0 | 1200 | $1,695 | $1.41 | 44d | 1 | 1.46mi |
| 678 1/2 Columbia Ave Apt 2 Lancaster, PA | 3.0 | 1.0 | 1100 | $1,495 | $1.36 | 14d | 1 | 1.48mi |
Listing history 16 events
-
2026-05-01status Pending
-
2026-04-26$95,000 Active
-
2024-10-07historical
-
2024-09-22$110,000 Active
-
2017-12-29soldstatus $43,500
-
2017-12-05historical
-
2017-11-25$48,000
-
2014-05-30soldstatus $52,000
-
2014-05-23historical
-
2014-03-16$57,500
-
2013-02-25historical
-
2012-11-28$50,275
-
2012-05-04historical
-
2011-08-16$59,000
-
2008-08-08soldstatus $68,000
-
2008-02-06$68,000
ⓘ Source: listings_history table (triggers on properties + properties_extension) + one-shot
backfill from property_details.listing_events for pre-trigger history.
Tax reassessment forecast PA · Partial reset (capped growth)
- Current annual tax
- $1,042 · $87/mo
- Projected year-2 tax
- $1,272 · $106/mo
- Expected delta
- +$229/yr (+$19/mo · 22.0%)
ⓘ Screening estimate from a state-policy table — verify with the county assessor before closing.
Climate risk First Street
- Flood 1/10 Low FEMA zone X (unshaded) · 0% chance over 30 yrs
- Wildfire 2/10 Low
- Heat 6/10 Major 7 d/yr ≥101°F today · 15 d/yr by 30 yrs out
- Wind 4/10 Moderate 13% chance of damaging wind over 30 yrs
- Air quality 4/10 Moderate 4 unhealthy d/yr today · 7 by 30 yrs out
Nearby sold comps map
Loading sold comps map…
Walkable amenities ~0.75 mi
Loading nearby amenities…
Taxation est. · year 1
- Rental income
- $21,664
- − Mortgage interest
- −$5,321
- − Property taxes
- −$1,042
- − Insurance
- −$475
- − Repairs & maintenance
- −$1,733
- − Management
- −$1,733
- − Depreciation
- −$2,764
- Taxable income
- $8,595
- Est. tax owed @ 24.0%
- −$2,063
- After-tax cash flow
- $7,556/yr
For passive investors: Depreciation is non-cash, so a rental often shows a tax loss while cash-flowing — sheltering income. Rental losses are passive: they offset passive income freely, and up to $25,000/yr can offset ordinary (W-2) income if you actively participate and your MAGI is under $100k (phasing out to $0 by $150k); unused losses carry forward. On sale, claimed depreciation is recaptured at up to 25%, and gains may owe capital-gains tax (a 1031 exchange can defer both). Figures are a year-1 estimate at your 24.0% rate — not tax advice; consult a CPA.
Schools (NCES district)
- District
- Penn Manor SD
- NCES district ID
- 4218630
- Math proficiency
- 52% ▼ -7.00%
- Reading proficiency
- 65% ▼ -7.00%
- Median HH income
- $59,275
- Composite
- 50.67/100
- National rank
- #1826
- State rank
- #80 of 539 in PA
Livability — Millersville
- Score
- 84/100
- State rank
- #101
- US rank
- #728
Category grades
Schools grade is shown separately in the Schools card above.
Census & demographics
- County
- Lancaster County · 390,309 people
- City population
- 11,753
- Metro
- Lancaster, PA
- Population (ZIP)
- 67,571
- Household income
- $77,084
- Rent vs Own
- Severe rent burden
- 2557.0
Population outlook (Lancaster County) Hauer SSP2
- Today (2025)
- 561,011 people
- By 2030
- 570,969 · +1.8%
- By 2040
- 585,929 · +4.4%
- By 2050
- 591,056 · +5.4%
- By 2075
- 594,747 · +6.0%
- By 2100
- 558,850 · -0.4%
Race, ethnicity, and origin ACS 2023
- Neighborhood character
- Diverse neighborhood (Simpson 0.59)
- Race & ethnicity
- White 58% Hispanic / Latino 27% Two or more races 12% Black 7% Asian 4%
- Hispanic origin (detail)
- Mexican 1% Puerto Rican 19% Cuban 1% Dominican 2%
- Common ancestry
- Romanian 2% Slovak 2% Lithuanian 1%
- Foreign-born
- 9% · Canada, China, India
- Languages at home
- 77% English-only · Spanish 17% Other Indo-European 1% Chinese 1%
Political lean MEDSL · Lancaster
- 2024 margin
- R (+15.9) · D 41.5% · R 57.5%
- 2008→2024 swing
- -4.1pp toward R · 2008: -11.8pp · 2024: -15.9pp
- All cycles
- 2024: R+15.9 2020: R+15.8 2016: R+19.7 2012: R+19.2 2008: R+11.8
Not yet ingested
- Civics
- —
Market trends
- HPI YoY
- ▼ -508.78%
- Current HPI
- 289.3324
- Rent YoY
- ▲ 0.47%
- Metro
- Lancaster, PA
- State GDP YoY
- ▲ 1.68%
- F500 in state
- 34
Industry mix (Fortune 500 HQ in PA)
| Industry | F500 HQs | Revenue |
|---|---|---|
| Healthcare | 2 | $309B |
|
||
| Insurance | 2 | $27B |
|
||
| Telecommunications / Media | 1 | $124B |
|
||
| Industrial Distribution | 1 | $22B |
|
||
| Financial Services | 1 | $20B |
|
||
| Chemicals / Materials | 1 | $18B |
|
||
Price history
+39.7% since first listed16 events — show timeline
- 2026-05-01 Pending — BRIGHT MLS
- 2026-04-26 Listed $95,000 BRIGHT MLS
- 2024-10-07 Listing Removed — BRIGHT MLS
- 2024-09-22 Listed $110,000 BRIGHT MLS
- 2017-12-29 Sold (MLS) $43,500 BRIGHT MLS
- 2017-12-05 Listing Removed — BRIGHT MLS
- 2017-11-25 Listed $48,000 BRIGHT MLS
- 2014-05-30 Sold (MLS) $52,000 BRIGHT MLS
- 2014-05-23 Listing Removed — BRIGHT MLS
- 2014-03-16 Listed $57,500 BRIGHT MLS
- 2013-02-25 Listing Removed — BRIGHT MLS
- 2012-11-28 Listed $50,275 BRIGHT MLS
- 2012-05-04 Listing Removed — BRIGHT MLS
- 2011-08-16 Listed $59,000 BRIGHT MLS
- 2008-08-08 Sold (MLS) $68,000 BRIGHT MLS
- 2008-02-06 Listed $68,000 BRIGHT MLS
Property tax history
-0.6%/yrLatest (2026): $1,042 · +4.1% YoY. Source: county tax records.
Cash-flow waterfall
monthlySold comps — $/sqft
last 12 mo · ≤1 miLoading sold comps…