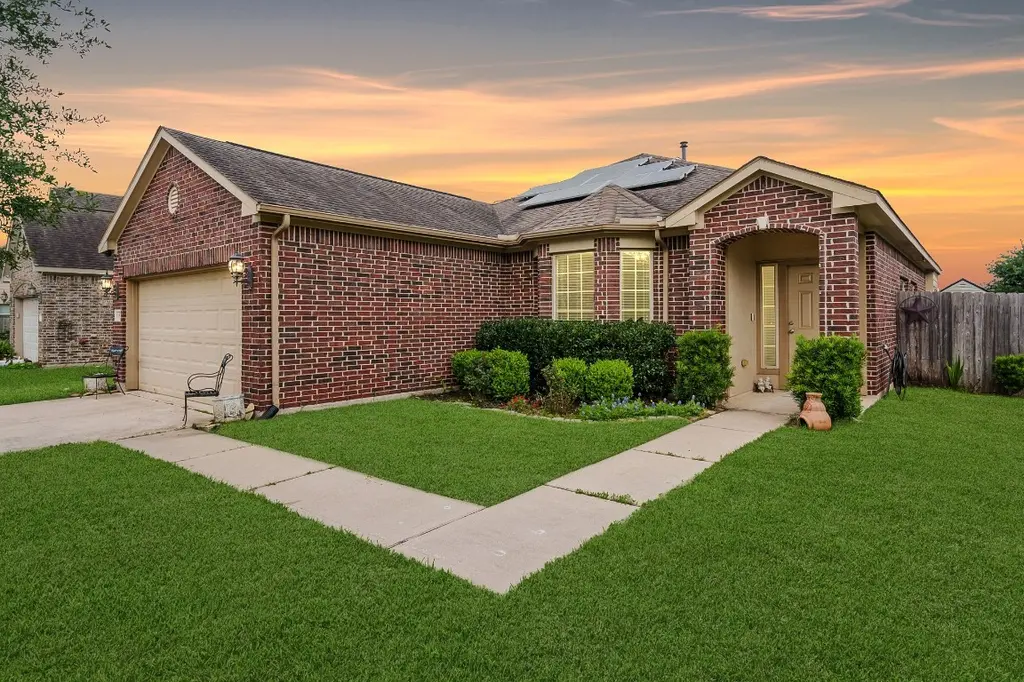
5710 Micah Ln · Cumings, TX
Flood risk 1/10 · Minimal
- FEMA flood zone
- X
- Chance of flooding over 30 yrs
- 0.0%
- Est. flood insurance / yr
- $507 – $1,088
Fire risk 4/10 · Minor
- Est. fire insurance / yr
- $1,222 – $2,270
Heat risk 9/10 · Severe
- Hot days now (above 110°F)
- 7 days/yr
- Hot days in 30 yrs
- 24 days/yr
Wind risk 9/10 · Severe
- Chance of severe wind over 30 yrs
- 99.0%
Air-quality risk 2/10 · Minimal
- Unhealthy air days now
- 1 days/yr
- Unhealthy air days in 30 yrs
- 1 days/yr
Risk factors via First Street. Map © Google.
Why this score? — see what drove the D grade
The composite is a weighted blend of 9 inputs, each scored 0–100. Each bar is that input's sub-score; the figure is the points it added to the 100-point composite (weight × sub-score).
- ARV discount +15.0/15.0
- Cash flow +7.7/30.0
- Schools +4.6/10.0
- 1% rule +4.1/10.0
- Livability +3.4/5.0
- Condition / age +2.5/5.0
- Rent growth +2.3/5.0
- DSCR +1.8/10.0
- Appreciation +0.0/10.0
$259,000
🖨 Deal sheet (PDF) 📄 Offer letter ✓ Due diligence
Listing remarks MLS
Beautiful new construction home built by Rausch Coleman! Charming 1 story plan with 4 bedroom and 2 bathrooms. Don't miss out on this charming new home, and schedule your appointment today!
Key facts
- Fitness center
- Gourmet kitchen
- Covered patio
Tags
Property features AI
Finance
- HOA & community: Community association (Kingdom Heights / The Millis Group); Annual association fee; Association fee covers clubhouse, common areas, and recreation facilities; Community amenities include clubhouse, sport court, fitness center, meeting/party room, playground, park, pool, and trails; Community pool
Exterior
- Parking: Attached garage with 2 spaces; Driveway; Garage with automatic door opener
- Security: Prewired for security; Smoke detectors
- Utilities: Public water; Public sewer (also lists septic tank)
- Home design: Residential property; Built in 2018; Slab foundation; Composition roof
- Construction: Brick and cement siding construction; Year built 2018; Slab foundation; Composition roof
- Exterior features: Covered patio; Fully fenced backyard; Fence; Sprinkler/irrigation system; Porch; Patio; Private yard; Deck; Backs to greenbelt/park; Side yard; Greenbelt and subdivision setting
Interior
- Kitchen: Dishwasher; Free-standing range; Garbage disposal; Gas oven; Gas range; Microwave; Oven; Refrigerator
- Bedrooms: Primary bedroom on the first floor (13 x 16); Bedroom on the first floor (13 x 15); Bedroom on the first floor (13 x 10); Bedroom on the first floor (13 x 10)
- Flooring: Carpet; Tile
- Bathrooms: 2 full bathrooms; Bathroom on the first floor (5 x 6); Bathroom on the first floor (7 x 5)
- Heating & cooling: Central heating (gas, with solar); Central air conditioning
- Interior features: Breakfast bar; Double vanity; Entrance foyer; Granite counters; High ceilings; Kitchen island; Kitchen/family room combo; Pantry; Soaking tub; Separate shower; Tub/shower combination; Vanity; Vaulted ceilings; Walk-in pantry; Window treatments; Kitchen/dining combo; Accessible bedroom, common areas, kitchen, entrance, doors and hallways; Window coverings
- Laundry & utility: Washer; Dryer; Washer hookup; Electric dryer hookup
Neighborhood map
What this means for you Summary
Snapshot
- This is a 4-bed/2.0-bath single-family listed at $259k.
Deal economics
- At list price, monthly cash flow is $-297 ($-4k/yr) — negative.
- To cash-flow at today's rent, offer at most $207k (20.2% below list).
- To meet the 1% rule (rent ≥ 1% of price), the offer needs to be $236k (8.8% below list).
- Recommended offer: $207k (20.2% below list) — sets the bar for cash-flow.
- Cap rate 4.9% vs local median 2.2% in Cumings — top-decile yield for the area; either an underpriced asset or a hidden risk that comps aren't pricing in. Stress-test before assuming the spread holds.
Location & tenants
- Location reads 67/100 on livability (#566 in TX) — a middle-class / working-renter tenant base. Strengths: crime A+, employment A+, housing A+; Watch: amenities F, commute F, health & safety F.
- Lamar CISD (suburban): math 50% / reading 53% proficiency, ranked #116 of 826 in TX (top 14%) — acceptable for families but not a draw, mixed tenant base, ~2y average lease.
- Zoned schools: Frost El (math 71% / reading 71%, grade A-, #128 of 4,322 statewide, top 3%, 1,046 students, 33% FRL); Briscoe J H (math 59% / reading 60%, grade B, #166 of 1,662 statewide, top 11%, 1,914 students, 38% FRL); Foster H S (math 64% / reading 74%, grade B, #141 of 1,632 statewide, top 9%, 2,388 students, 34% FRL).
- Zoned-school proficiency averages 66% at this address vs 52% district-wide (+15 pts) — the actual schools serving this property are materially stronger than the Lamar CISD average implies; a family-tenant draw the district grade alone would hide.
- Market conditions: Rents soft (-1.0%/yr); 728 active listings in the ZIP; 2 comparable units currently listed for rent nearby; 12,093 units permitted in Fort Bend County in 2024 (815 in 5+ unit buildings).
- This rent runs 39% of the median local income ($73k/yr) — at the standard rent-burdened threshold; future hikes will face affordability resistance.
Forward outlook
- Local home prices are declining (-3.0%/yr); year-one equity from $2k of loan paydown is wiped out by about $8k of value loss. Plan a longer hold.
- Fort Bend County population projected at +75% by 2050 — long-run rental-demand tailwind backs the buy-and-hold thesis.
Negotiation context
- It's been on market 34 days — a 3% lower offer ($251k) is reasonable based on typical stale-listing flexibility.
- 3 sale attempts since 8y ago with the ask held roughly flat each time — persistent listings suggest the price (not the market) is what's stuck; bring a comps-based counter.
Risks & watch-outs
- Watch-outs: property tax is 3.0% of price.
- Climate carrying-cost: severe wind risk, 99% chance of damaging wind over 30y; extreme-heat days projected 7→24/yr by 2055 (HVAC capex compounding) — expect insurance premiums to compound above CPI over the hold.
Questions for the listing agent
- What do current leases actually rent for vs. the listed asking? Can we see a recent rent roll and the last 12 months of T-12 income?
- It's been on market 34 days. Have you received any prior offers? Is the seller open to a 20% concession, seller financing, or rate buy-down credit?
- Property tax is high relative to price — has the assessment been appealed recently, and will the sale trigger a re-assessment?
- What does the HOA fee cover, when was the last increase, and are there any pending special assessments or reserve-fund shortfalls?
- Is there a deadline driving the sale (1031 exchange, divorce, estate, relocation)? That informs how much negotiation room exists.
- Schools are F-rated, which usually means shorter tenancies and higher turnover. Who's the typical renter profile here, and what's been the actual vacancy rate?
- The area grade is low — what's the realistic commute time and amenity access for the typical tenant pool here? Any planned neighborhood developments (good or bad) we should know about?
- What's the average days-on-market for RENTAL listings here right now (not sales)? A rising rental-DOM trend means longer vacancies and softer asking-rent achievability than the comps imply.
- What's the recent tenant-quality profile in this submarket — average credit score on applications, eviction rate, late-payment / NSF rate, and stable-employment percentage? A property-management company in the area should have these aggregated.
- How much new for-sale + rental construction is in the pipeline within 1–3 miles? Heavy new supply typically softens prices + rents 12–24 months out; constrained supply supports both.
Investment metrics
- 1% rule
- 0.91% ✗
- Cap rate
- 4.92%
- Cash-on-cash
- -4.91%
- DSCR
- 0.78
- GRM
- 9.1
CMA / ARV
- ARV (median comp)
- $321,277
- List price
- $259,000
- Delta
- -19.38%
- Verdict
- UNDERPRICED
- Comps
- 20 within 1.0 mi
Show comp detail 12 sales within ~0.75 mi
| Address | Dist | Beds/Ba | Sqft | Sold | Price | $/sf | Match |
|---|---|---|---|---|---|---|---|
| 5919 Micah Ln | 0.21mi | 3/2.0 (-1) | 2,067 (+9%) | 1mo | $295,000 | $143 | 69 |
| 2507 Good Morrow Dr | 0.26mi | 3/2.0 (-1) | 2,005 (+6%) | 5mo | $329,751 | $164 | 69 |
| 5622 Maxon Ct | 0.13mi | 3/2.0 (-1) | 2,131 (+13%) | 2mo | $295,000 | $138 | 66 |
| 2834 Dark Lantern | 0.47mi | 4/3.0 | 2,067 (+9%) | 0mo | $363,480 | $176 | 58 |
| 2027 Wembley Way | 0.29mi | 3/2.0 (-1) | 2,131 (+13%) | 2mo | $305,000 | $143 | 58 |
| 2019 Preston Park | 0.38mi | 3/2.0 (-1) | 2,095 (+11%) | 2mo | $279,000 | $133 | 58 |
| 2527 Good Morrow Dr | 0.31mi | 3/2.5 (-1) | 2,111 (+12%) | 5mo | $384,560 | $182 | 55 |
| 2650 Wastelbread Ln | 0.45mi | 4/3.0 | 2,067 (+9%) | 7mo | $330,590 | $160 | 54 |
| 5207 Kingdom Heights Blvd | 0.49mi | 4/3.0 | 2,067 (+9%) | 7mo | $367,240 | $178 | 52 |
| 2622 Good Morrow Dr | 0.40mi | 3/2.5 (-1) | 2,111 (+12%) | 5mo | $374,208 | $177 | 50 |
| 5814 Chamberlain Xing | 0.59mi | 4/3.0 | 2,067 (+9%) | 4mo | $359,440 | $174 | 50 |
| 2835 Clapbread Ln | 0.62mi | 3/2.5 (-1) | 2,092 (+11%) | 4mo | $394,850 | $189 | 43 |
Match score weights: distance 35% · size 25% · config 20% · recency 20%. Top-matched comps best support the ARV.
Projected returns pro-forma
-3.0% appreciation · 0.0% rent growth · sell at horizon
- IRR
- -28.8%
- Equity multiple
- 0.07×
- Total profit
- $-67,514
- Equity at exit
- $38,618
- IRR
- -52.3%
- Equity multiple
- -0.50×
- Total profit
- $-108,795
- Equity at exit
- $22,394
Cash invested: $72,520 (down + closing). Projections, not guarantees.
Landlord ↔ Tenant lean methodology
- Overall (STATE)
- 87 Strongly Landlord-Friendly
- State Texas
- 87 Strongly Landlord-Friendly · R+5
- County
- — inherits STATE
- City
- — inherits STATE
ZIP-level market 77471
- Home prices YoY
- -19.3%
- Rents YoY
- -1.0%
- Active inventory
- 728
- Price-to-rent
- 9.1×
Monthly cashflow live
- Estimated rent
- $2,363 medium interval (Pro) →
- Mortgage (P&I)
- −$1,358
- Tax from tax record
- −$639 /mo · $7,672/yr
- Insurance
- −$108
- HOA
- −$58
- Vacancy / Maint / Mgmt
- −$496
- Net cashflow
- $-297
Break-even live
Sensitivity live
| Price | -10% $-150 | -5% $-223 | +0% $-297 | +5% $-370 | +10% $-443 |
|---|---|---|---|---|---|
| Rent | -10% $-483 | -5% $-390 | +0% $-297 | +5% $-203 | +10% $-110 |
| Rate | -1.0pp $-166 | -0.5pp $-231 | base $-297 | +0.5pp $-364 | +1.0pp $-432 |
UW: 25.0% down · 7.5% · 30yr · 1.5% tax · 5.0% vac · 8.0% maint · 8.0% mgmt
Financing live
Cash to close
- Down payment
- $64,750
- Closing costs
- $7,770
- Reserves months
- —
- Total cash needed
- —
Loan-product check · same deal, 3 products live
Conventional
25% down · 7.5% · 30yr
- Down + closing
- —
- Monthly P&I
- —
- Monthly cashflow
- —
- DSCR
- —
- Eligible?
- —
Personal DTI + credit; lowest rate.
DSCR
20% down · 8.5% · 30yr
- Down + closing
- —
- Monthly P&I
- —
- Monthly cashflow
- —
- DSCR
- —
- Eligible?
- —
No personal income docs; deal must DSCR.
Hard money
10% down · 12.0% · 12mo
- Down + closing
- —
- Monthly P&I
- —
- Monthly cashflow
- —
- DSCR
- —
- Eligible?
- —
Short-term bridge; refi at stabilization.
Rent comps 2 comps
| Address | Beds | Baths | Sqft | Rent | $/sqft | DOM | Units | Dist |
|---|---|---|---|---|---|---|---|---|
| 2023 Wembley Way Rosenberg, TX | 3.0 | 3.0 | 2606 | $2,400 | $0.92 | 45d | 1 | 0.31mi |
| 6214 Oxford Lake Dr Rosenberg, TX | 3.0 | 2.0 | 2020 | $2,203 | $1.09 | 45d | 1 | 0.45mi |
HOA detail
- Monthly dues
- $58 · $696/yr
Listing history 11 events
-
2026-06-03days on market $259,000 Active 34 DOM
-
2026-06-02days on market $259,000 Active 33 DOM
-
2026-06-01days on market $259,000 Active 32 DOM
-
2026-05-31days on market $259,000 Active 31 DOM
-
2026-04-30$259,000 Active 594-char remark
-
2026-04-18historical
-
2026-04-10$300,000 Active
-
2019-02-28soldstatus Sold
Show marketing remark (189 chars)
Beautiful new construction home built by Rausch Coleman! Charming 1 story plan with 4 bedroom and 2 bathrooms. Don't miss out on this charming new home, and schedule your appointment today!
-
2018-12-13status Pending
Show marketing remark (189 chars)
Beautiful new construction home built by Rausch Coleman! Charming 1 story plan with 4 bedroom and 2 bathrooms. Don't miss out on this charming new home, and schedule your appointment today!
-
2018-11-19price $195,900
Show marketing remark (189 chars)
Beautiful new construction home built by Rausch Coleman! Charming 1 story plan with 4 bedroom and 2 bathrooms. Don't miss out on this charming new home, and schedule your appointment today!
-
2018-08-30$192,990 Active
Show marketing remark (189 chars)
Beautiful new construction home built by Rausch Coleman! Charming 1 story plan with 4 bedroom and 2 bathrooms. Don't miss out on this charming new home, and schedule your appointment today!
ⓘ Source: listings_history table (triggers on properties + properties_extension) + one-shot
backfill from property_details.listing_events for pre-trigger history.
Tax reassessment forecast TX · Resets to sale price
- Current annual tax
- $7,672 · $639/mo
- Projected year-2 tax
- $7,672 · $639/mo
- Expected delta
- $0/yr ($0/mo · 0.0%)
ⓘ Screening estimate from a state-policy table — verify with the county assessor before closing.
Climate risk First Street
- Flood 1/10 Low FEMA zone X · 0% chance over 30 yrs
- Wildfire 4/10 Moderate
- Heat 9/10 Extreme 7 d/yr ≥110°F today · 24 d/yr by 30 yrs out
- Wind 9/10 Extreme 99% chance of damaging wind over 30 yrs
- Air quality 2/10 Low 1 unhealthy d/yr today · 1 by 30 yrs out
Nearby sold comps map
Loading sold comps map…
Walkable amenities ~0.75 mi
Loading nearby amenities…
Taxation est. · year 1
- Rental income
- $28,359
- − Mortgage interest
- −$14,508
- − Property taxes
- −$7,672
- − Insurance
- −$1,295
- − Repairs & maintenance
- −$2,269
- − Management
- −$2,269
- − HOA
- −$696
- − Depreciation
- −$7,535
- Taxable loss
- −$7,884
- Est. tax savings @ 24.0%
- +$1,892
- After-tax cash flow
- $-1,666/yr
For passive investors: Depreciation is non-cash, so a rental often shows a tax loss while cash-flowing — sheltering income. Rental losses are passive: they offset passive income freely, and up to $25,000/yr can offset ordinary (W-2) income if you actively participate and your MAGI is under $100k (phasing out to $0 by $150k); unused losses carry forward. On sale, claimed depreciation is recaptured at up to 25%, and gains may owe capital-gains tax (a 1031 exchange can defer both). Figures are a year-1 estimate at your 24.0% rate — not tax advice; consult a CPA.
Schools (NCES district)
- District
- Lamar CISD
- NCES district ID
- 4826580
- Math proficiency
- 50% ▼ -12.00%
- Reading proficiency
- 53% ▼ -4.00%
- Median HH income
- $75,213
- Composite
- 46.43/100
- National rank
- #2452
- State rank
- #116 of 826 in TX
Livability — Cumings
- Score
- 67/100
- State rank
- #566
- US rank
- #10828
Category grades
Schools grade is shown separately in the Schools card above.
Census & demographics
- Census place
- Cumings, TX
- County
- Fort Bend County · 836,777 people
- Metro
- Houston-The Woodlands-Sugar Land, TX
- Population (ZIP)
- 45,325
- Household income
- $73,186
- Rent vs Own
- Severe rent burden
- 1688.0
Population outlook (Fort Bend County) Hauer SSP2
- Today (2025)
- 1,004,526 people
- By 2030
- 1,153,104 · +14.8%
- By 2040
- 1,453,718 · +44.7%
- By 2050
- 1,753,781 · +74.6%
- By 2075
- 2,455,772 · +144.5%
- By 2100
- 2,930,528 · +191.7%
Race, ethnicity, and origin ACS 2023
- Neighborhood character
- Diverse neighborhood (Simpson 0.61)
- Race & ethnicity
- Hispanic / Latino 56% White 23% Two or more races 21% Black 12% Asian 7%
- Hispanic origin (detail)
- Mexican 46%
- Common ancestry
- Romanian 1% Lithuanian 1% Slovak 1%
- Foreign-born
- 18% · Canada, China, Vietnam
- Languages at home
- 57% English-only · Spanish 35% Tagalog/Filipino 2% Other Indo-European 1%
Political lean MEDSL · Fort Bend
- 2024 margin
- Toss-up / Even · D 49.5% · R 47.9% · Other 2.6%
- 2008→2024 swing
- +4.0pp toward D · 2008: -2.4pp · 2024: 1.6pp
- All cycles
- 2024: D+1.6 2020: D+10.6 2016: D+6.6 2012: R+6.8 2008: R+2.4
Not yet ingested
- Civics
- —
Market trends
- HPI YoY
- ▼ -74.06%
- Current HPI
- 309.5425
- Rent YoY
- ▼ -0.97%
- Metro
- Houston-The Woodlands-Sugar Land, TX
- State GDP YoY
- ▲ 3.95%
- F500 in state
- 110
Industry mix (Fortune 500 HQ in TX)
| Industry | F500 HQs | Revenue |
|---|---|---|
| Energy | 16 | $1,198B |
|
||
| Technology | 5 | $198B |
|
||
| Engineering / Construction | 4 | $72B |
|
||
| Energy Services | 3 | $60B |
|
||
| Utilities | 3 | $41B |
|
||
| Healthcare | 2 | $330B |
|
||
Price history
+34.2% since first listed8 events — show timeline
- 2026-06-01 Listing Removed — HARMLS
- 2026-04-30 Listed $259,000 HARMLS
- 2026-04-18 Listing Removed — HARMLS
- 2026-04-10 Listed $300,000 HARMLS
- 2019-02-28 Sold (MLS) — HARMLS
- 2018-12-13 Pending — HARMLS
- 2018-11-19 Price Changed $195,900 HARMLS
- 2018-08-30 Listed $192,990 HARMLS
Property tax history
+62.7%/yrLatest (2025): $7,672 · +2.8% YoY. Source: county tax records.
Cash-flow waterfall
monthlySold comps — $/sqft
last 12 mo · ≤1 miLoading sold comps…