 🏗️ New Construction
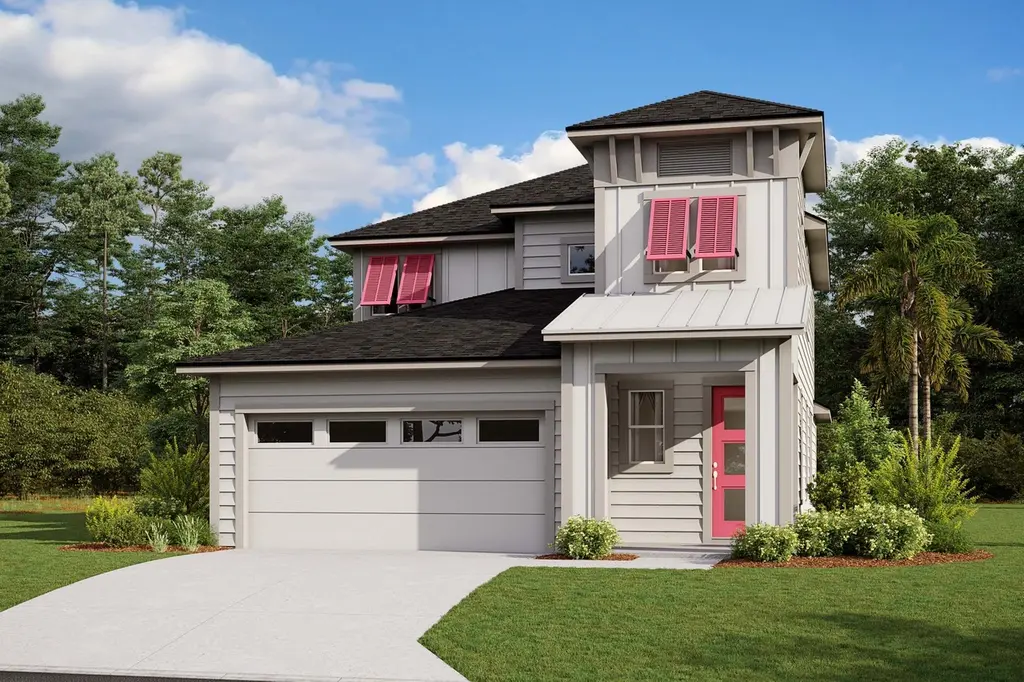
The Hernando at Seabrook Village Phase 2 Plan · Nocatee, FL
Flood risk No data
- FEMA flood zone
- —
- Chance of flooding over 30 yrs
- —
- Est. flood insurance / yr
- —
Fire risk No data
- Est. fire insurance / yr
- —
Heat risk No data
- Hot days now (above threshold)
- —
- Hot days in 30 yrs
- —
Wind risk No data
- Chance of severe wind over 30 yrs
- —
Air-quality risk No data
- Unhealthy air days now
- —
- Unhealthy air days in 30 yrs
- —
Risk factors via First Street. Map © Google.
Why this score? — see what drove the F grade
The composite is a weighted blend of 9 inputs, each scored 0–100. Each bar is that input's sub-score; the figure is the points it added to the 100-point composite (weight × sub-score).
- ARV discount +7.5/15.0
- Schools +6.4/10.0
- Appreciation +4.8/10.0
- Livability +3.5/5.0
- Rent growth +2.8/5.0
- Condition / age +2.5/5.0
- Cash flow +2.4/30.0
- 1% rule +0.0/10.0
- DSCR +0.0/10.0
$600,940
🖨 Deal sheet 📄 Offer letter ✓ Due diligence
Listing remarks MLS
The Hernando features 1,884 Sq Ft. of living space with 4 bedrooms, 2.5 baths, Family Room, Kitchen, Café, 1st Floor Owners Suite, Loft, Covered Patio and 2-Car Garage.
Key facts
- 2 garage spots
- Listed 390 days
Neighborhood map
What this means for you Summary
Snapshot
- This is a 4-bed/2.5-bath single-family listed at $601k.
Deal economics
- At list price, monthly cash flow is $-3k ($-33k/yr) — negative.
- To cash-flow at today's rent, offer at most $385k (36.0% below list).
- To meet the 1% rule (rent ≥ 1% of price), the offer needs to be $336k (44.0% below list).
- Recommended offer: $336k (44.0% below list) — sets the bar for 1% rule.
Location & tenants
- Location reads 70/100 on livability (#425 in FL) — a middle-class / working-renter tenant base. Strengths: schools A+, crime A+, employment A+; Watch: amenities F, commute F, cost of living F.
- St. Johns (rural): math 75% / reading 73% proficiency, ranked #2 of 73 in FL (top 3%) — strong family-tenant draw, lease renewals of 3-5y typical; only 20% free/reduced lunch — higher-income household profile.
- Market conditions: Rents rising (+1.1%/yr); 652 active listings in the ZIP; 2 comparable units currently listed for rent nearby; high-income renter base; 5,575 units permitted in St. Johns County in 2024 (584 in 5+ unit buildings).
- This rent runs 31% of the median local income ($132k/yr) — at the standard rent-burdened threshold; future hikes will face affordability resistance.
Forward outlook
- In year one you build about $2k of equity ($5k loan paydown + $-4k appreciation (-0.5% local appreciation)).
- St. Johns County population projected at +60% by 2050 — long-run rental-demand tailwind backs the buy-and-hold thesis.
- By year 10, paydown + projected appreciation supports a ~$49k cash-out refi (75% LTV) — recoverable capital for the next deal without selling this one.
Negotiation context
- It's been on market 390 days — a 12% lower offer ($529k) is reasonable based on typical stale-listing flexibility.
Questions for the listing agent
- What do current leases actually rent for vs. the listed asking? Can we see a recent rent roll and the last 12 months of T-12 income?
- It's been on market 390 days. Have you received any prior offers? Is the seller open to a 44% concession, seller financing, or rate buy-down credit?
- Why hasn't it sold? Are there any deal-killer items the seller is aware of (foundation, flood, title, zoning, code violations)?
- Is there a deadline driving the sale (1031 exchange, divorce, estate, relocation)? That informs how much negotiation room exists.
- Schools are A-rated — typically a magnet for longer-tenancy family renters. What's the average tenant stay here, and is there a school-zone premium baked into asking?
- The area grade is low — what's the realistic commute time and amenity access for the typical tenant pool here? Any planned neighborhood developments (good or bad) we should know about?
- What's the average days-on-market for RENTAL listings here right now (not sales)? A rising rental-DOM trend means longer vacancies and softer asking-rent achievability than the comps imply.
- What's the recent tenant-quality profile in this submarket — average credit score on applications, eviction rate, late-payment / NSF rate, and stable-employment percentage? A property-management company in the area should have these aggregated.
- How much new for-sale + rental construction is in the pipeline within 1–3 miles? Heavy new supply typically softens prices + rents 12–24 months out; constrained supply supports both.
Investment metrics
- 1% rule
- 0.43% ✗
- Cap rate
- 2.10%
- Cash-on-cash
- -14.98%
- DSCR
- 0.33
- GRM
- 19.3
CMA / ARV
- ARV (median comp)
- $778,200
- List price
- $600,940
- Delta
- -22.78%
- Verdict
- UNDERPRICED
- Comps
- 20 within 1.0 mi
Show comp detail 12 sales within ~0.75 mi
| Address | Dist | Beds/Ba | Sqft | Sold | Price | $/sf | Match |
|---|---|---|---|---|---|---|---|
| 944 Caiden Dr | 0.47mi | 4/2.5 | 2,239 (+2%) | 2mo | $629,000 | $281 | 74 |
| 388 Seamark Dr | 0.53mi | 4/2.5 | 2,239 (+2%) | 2mo | $650,000 | $290 | 71 |
| 406 Reflections Ave | 0.35mi | 4/3.0 | 2,395 (+9%) | 1mo | $670,000 | $280 | 66 |
| 321 Reflections Ave | 0.31mi | 4/3.5 | 2,396 (+9%) | 2mo | $710,000 | $296 | 66 |
| 377 Reflections Ave | 0.35mi | 4/3.0 | 2,395 (+9%) | 3mo | $635,000 | $265 | 65 |
| 385 Reflections Ave | 0.36mi | 3/2.5 (-1) | 2,400 (+9%) | 0mo | $670,000 | $279 | 63 |
| 427 Reflections Ave | 0.39mi | 3/2.5 (-1) | 2,399 (+9%) | 0mo | $699,787 | $292 | 62 |
| 439 Reflections Ave | 0.40mi | 4/3.5 | 2,396 (+9%) | 3mo | $824,988 | $344 | 60 |
| 230 Seamark Dr | 0.67mi | 4/3.0 | 2,322 (+5%) | 2mo | $667,900 | $288 | 56 |
| 855 Caiden Dr | 0.56mi | 4/3.5 | 2,392 (+8%) | 0mo | $790,900 | $331 | 55 |
| 345 Seamark Dr | 0.57mi | 4/3.5 | 2,398 (+9%) | 3mo | $679,900 | $284 | 52 |
| 325 Seamark Dr | 0.60mi | 4/3.5 | 2,398 (+9%) | 2mo | $664,900 | $277 | 52 |
Match score weights: distance 35% · size 25% · config 20% · recency 20%. Top-matched comps best support the ARV.
Projected returns pro-forma
-0.49% appreciation · 1.13% rent growth · sell at horizon
- IRR
- -23.2%
- Equity multiple
- -0.01×
- Total profit
- $-219,861
- Equity at exit
- $207,123
- IRR
- -17.8%
- Equity multiple
- -0.64×
- Total profit
- $-356,337
- Equity at exit
- $234,394
Cash invested: $217,896 (down + closing). Projections, not guarantees.
Landlord ↔ Tenant lean methodology
- Overall (STATE)
- 87 Strongly Landlord-Friendly
- State Florida
- 87 Strongly Landlord-Friendly · R+3
- County
- — inherits STATE
- City
- — inherits STATE
ZIP-level market 32081
- Home prices YoY
- -0.3%
- Rents YoY
- 1.1%
- Active inventory
- 652
- Price-to-rent
- 14.9×
Monthly cashflow live
- Estimated rent
- $3,365 medium interval (Pro) →
- Mortgage (P&I)
- −$4,081
- Tax est. 1.5%
- −$973 /mo · $11,673/yr
- Insurance
- −$324
- HOA
- −$0
- Vacancy / Maint / Mgmt
- −$707
- Net cashflow
- $-2,720
Break-even live
UW: 25.0% down · 7.5% · 30yr · 1.5% tax · 5.0% vac · 8.0% maint · 8.0% mgmt
Financing live
Cash to close
- Down payment
- $194,550
- Closing costs
- $23,346
- Reserves months
- —
- Total cash needed
- —
Loan-product check · same deal, 3 products live
Conventional
25% down · 7.5% · 30yr
- Down + closing
- —
- Monthly P&I
- —
- Monthly cashflow
- —
- DSCR
- —
- Eligible?
- —
Personal DTI + credit; lowest rate.
DSCR
20% down · 8.5% · 30yr
- Down + closing
- —
- Monthly P&I
- —
- Monthly cashflow
- —
- DSCR
- —
- Eligible?
- —
No personal income docs; deal must DSCR.
Hard money
10% down · 12.0% · 12mo
- Down + closing
- —
- Monthly P&I
- —
- Monthly cashflow
- —
- DSCR
- —
- Eligible?
- —
Short-term bridge; refi at stabilization.
Rent comps 2 comps
| Address | Beds | Baths | Sqft | Rent | $/sqft | DOM | Units | Dist |
|---|---|---|---|---|---|---|---|---|
| 10260 Old Dixie Hwy Ponte Vedra, FL | 4.0 | 3.0 | 2500 | $3,099 | $1.24 | 3d | 1 | 1.19mi |
| 48 Pine Shadow Pkwy Ponte Vedra, FL | 3.0 | 2.5 | 1134 | $3,887 | $3.43 | 3d | 46 | 1.48mi |
Listing history 15 events
-
2026-06-18days on market $600,940 Active 390 DOM
-
2026-06-17days on market $600,940 Active 389 DOM
-
2026-06-16days on market $600,940 Active 388 DOM
-
2026-06-15days on market $600,940 Active 387 DOM
-
2026-06-13days on market $600,940 Active 385 DOM
-
2026-06-13days on market $600,940 Active 384 DOM
-
2026-06-10days on market $600,940 Active 381 DOM
-
2026-06-08days on market $600,940 Active 380 DOM
-
2026-06-07days on market $600,940 Active 379 DOM
-
2026-06-03days on market $600,940 Active 375 DOM
-
2026-06-02days on market $600,940 Active 374 DOM
-
2026-06-01days on market $600,940 Active 373 DOM
-
2026-05-31days on market $600,940 Active 372 DOM
-
2026-05-15price $600,940 175-char remark
Show marketing remark (175 chars)
The Hernando features 1,884 Sq Ft. of living space with 4 bedrooms, 2.5 baths, Family Room, Kitchen, Café, 1st Floor Owners Suite, Loft, Covered Patio and 2-Car Garage.
-
2025-05-24$590,940 Active 175-char remark
Show marketing remark (175 chars)
The Hernando features 1,884 Sq Ft. of living space with 4 bedrooms, 2.5 baths, Family Room, Kitchen, Café, 1st Floor Owners Suite, Loft, Covered Patio and 2-Car Garage.
ⓘ Source: listings_history table (triggers on properties + properties_extension) + one-shot
backfill from property_details.listing_events for pre-trigger history.
Nearby sold comps map
Loading sold comps map…
Walkable amenities ~0.75 mi
Loading nearby amenities…
Taxation est. · year 1
- Rental income
- $40,378
- − Mortgage interest
- −$43,591
- − Property taxes
- −$11,673
- − Insurance
- −$3,891
- − Repairs & maintenance
- −$3,230
- − Management
- −$3,230
- − Depreciation
- −$22,639
- Taxable loss
- −$47,876
- Est. tax savings @ 24.0%
- +$11,490
- After-tax cash flow
- $-21,146/yr
For passive investors: Depreciation is non-cash, so a rental often shows a tax loss while cash-flowing — sheltering income. Rental losses are passive: they offset passive income freely, and up to $25,000/yr can offset ordinary (W-2) income if you actively participate and your MAGI is under $100k (phasing out to $0 by $150k); unused losses carry forward. On sale, claimed depreciation is recaptured at up to 25%, and gains may owe capital-gains tax (a 1031 exchange can defer both). Figures are a year-1 estimate at your 24.0% rate — not tax advice; consult a CPA.
Schools (NCES district)
- District
- St. Johns
- NCES district ID
- 1201740
- Math proficiency
- 75% ▼ -5.00%
- Reading proficiency
- 73% ▼ -2.00%
- Median HH income
- $66,842
- Composite
- 64.31/100
- National rank
- #556
- State rank
- #2 of 73 in FL
Livability — Nocatee
- Score
- 70/100
- State rank
- #425
- US rank
- #7550
Category grades
Schools grade is shown separately in the Schools card above.
Census & demographics
- Census place
- Nocatee, FL
- County
- Saint Johns County · 301,599 people
- City population
- 27,365
- Metro
- Jacksonville, FL
- Population (ZIP)
- 29,784
- Household income
- $131,624
- Rent vs Own
- Severe rent burden
- 729.0
Population outlook (St. Johns County) Hauer SSP2
- Today (2025)
- 303,941 people
- By 2030
- 342,590 · +12.7%
- By 2040
- 417,328 · +37.3%
- By 2050
- 487,011 · +60.2%
- By 2075
- 635,395 · +109.1%
- By 2100
- 717,469 · +136.1%
Race, ethnicity, and origin ACS 2023
- Neighborhood character
- Predominantly White (82%)
- Race & ethnicity
- White 82% Two or more races 9% Hispanic / Latino 7% Asian 5% Black 1%
- Hispanic origin (detail)
- Puerto Rican 3% Cuban 1%
- Common ancestry
- Lithuanian 5% Romanian 3% Portuguese 2%
- Foreign-born
- 9% · Canada, China
- Languages at home
- 89% English-only · Spanish 3% Other Indo-European 3% Other Asian/Pacific 2%
Political lean MEDSL · St. Johns
- 2024 margin
- Solid R (+31.4) · D 33.9% · R 65.2%
- 2008→2024 swing
- +0.2pp no change · 2008: -31.6pp · 2024: -31.4pp
- All cycles
- 2024: R+31.4 2020: R+26.7 2016: R+33.4 2012: R+37.8 2008: R+31.6
Not yet ingested
- Civics
- —
Market trends
- HPI YoY
- ▼ -0.49%
- Current HPI
- 145.8421
- Rent YoY
- ▲ 1.13%
- Metro
- Jacksonville, FL
- State GDP YoY
- ▲ 3.28%
- F500 in state
- 36
Industry mix (Fortune 500 HQ in FL)
| Industry | F500 HQs | Revenue |
|---|---|---|
| Industrial Technology | 2 | $29B |
|
||
| Insurance | 2 | $17B |
|
||
| Retail | 1 | $60B |
|
||
| Technology Distribution | 1 | $58B |
|
||
| Homebuilding | 1 | $35B |
|
||
| Technology Manufacturing | 1 | $35B |
|
||
Price history
+1.7% since first listed2 events — show timeline
- 2026-05-15 Price Changed $600,940 Zillow
- 2025-05-24 Listed $590,940 Zillow
Cash-flow waterfall
monthlySold comps — $/sqft
last 12 mo · ≤1 miLoading sold comps…