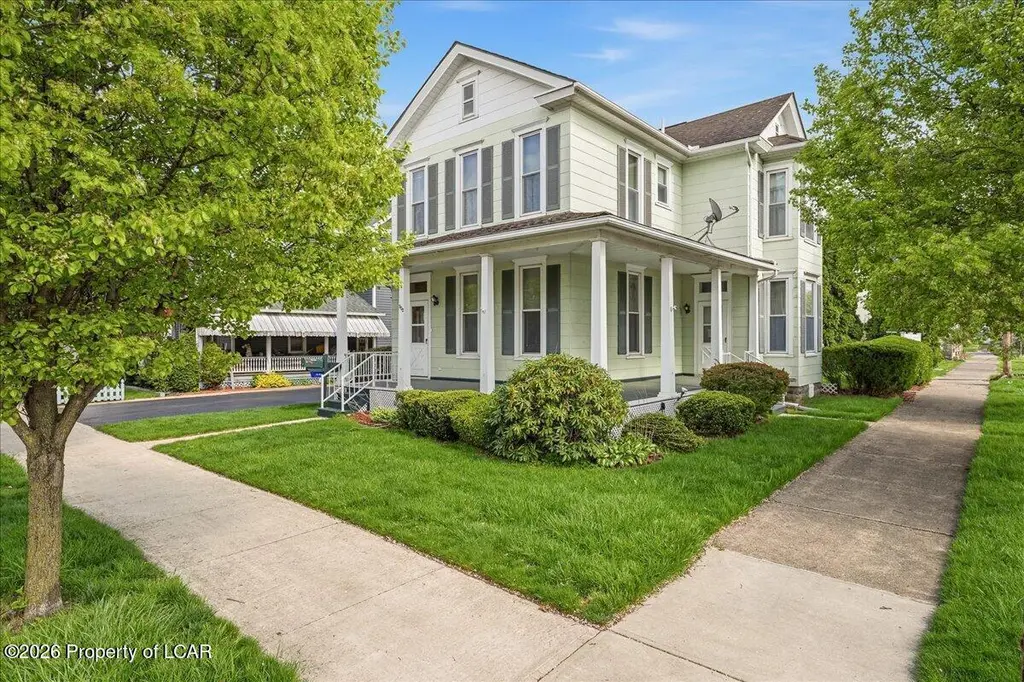
300 E 4th St · Berwick, PA
Flood risk 1/10 · Minimal
- FEMA flood zone
- X (unshaded)
- Chance of flooding over 30 yrs
- 0.0%
- Est. flood insurance / yr
- $473 – $860
Fire risk 1/10 · Minimal
- Est. fire insurance / yr
- $511 – $949
Heat risk 4/10 · Minor
- Hot days now (above 97°F)
- 7 days/yr
- Hot days in 30 yrs
- 16 days/yr
Wind risk 2/10 · Minimal
- Chance of severe wind over 30 yrs
- 4.0%
Air-quality risk 2/10 · Minimal
- Unhealthy air days now
- 1 days/yr
- Unhealthy air days in 30 yrs
- 2 days/yr
Risk factors via First Street. Map © Google.
Why this score? — see what drove the D grade
The composite is a weighted blend of 9 inputs, each scored 0–100. Each bar is that input's sub-score; the figure is the points it added to the 100-point composite (weight × sub-score).
- Cash flow +14.4/30.0
- ARV discount +7.5/15.0
- DSCR +4.4/10.0
- 1% rule +3.8/10.0
- Livability +3.8/5.0
- Schools +3.7/10.0
- Rent growth +2.5/5.0
- Condition / age +2.5/5.0
- Appreciation +0.0/10.0
$179,000
🖨 Deal sheet 📄 Offer letter ✓ Due diligence
Listing remarks MLS
Do Not Miss This Charming Corner Lot Home In Berwick Borough Priced To Sell And Full Of Warmth Potential And Personality. From the moment you arrive, this home gives off a sweet classic feel with its inviting front porch, traditional two story presence, and prominent corner lot setting.
Key facts
- Inviting front porch
- Paved driveway
- Usable outdoor space
Tags
Property features AI
Finance
- Other: Property type: Residential single family residence; Zoned residential (R)
Exterior
- Parking: Garage (1 space); Open/off-street parking (1 space); Driveway with shared driveway access; Garage faces front; Paved parking; Storage in garage area
- Security: Storm door(s)
- Utilities: Public water; Public sewer; Natural gas available
- Home design: Single family house; Faces northwest; No shared/common walls
- Construction: Vinyl siding; Asphalt/fiberglass roof; Stone permanent foundation; Full daylight basement (unfinished) with interior entry, concrete floors and storage space
- Exterior features: Rain gutters; Private yard; Corner lot; Level lot with cleared backyard; Paved road frontage on a city street; Publicly maintained road
Interior
- Kitchen: Electric range; Refrigerator
- Bedrooms: Walk-in closet(s) mentioned
- Flooring: Carpet; Tile
- Bathrooms: 1 full bathroom; 1 half bathroom
- Heating & cooling: Hot water heating; Steam heating; Natural gas available; Ceiling fans for cooling
- Interior features: Eat-in kitchen; Walk-in closet(s); Built-in bookcases and features; Ceiling fan(s); Storage; Unfurnished
- Laundry & utility: Laundry on main level; Dehumidifier
Neighborhood map
What this means for you Summary
Snapshot
- This is a 3-bed/1.5-bath other listed at $179k.
Deal economics
- At list price, monthly cash flow is $37 ($445/yr) — positive.
- The deal already cash-flows at list — no discount required.
- To meet the 1% rule (rent ≥ 1% of price), the offer needs to be $158k (11.8% below list).
- Recommended offer: $158k (11.8% below list) — sets the bar for 1% rule.
- Cap rate 6.5% vs local median 5.4% in Berwick — meaningfully above typical; check what's discounted (condition, days-on-market, listing class) to confirm the premium yield is real.
Location & tenants
- Location reads 76/100 on livability (#412 in PA, #3,762 nationally) — a middle-class / working-renter tenant base. Strengths: crime A+, cost of living A+, housing A+; Watch: amenities F, commute F, employment F.
- Berwick Area SD (other): math 32% / reading 57% proficiency, ranked #291 of 539 in PA (top 54%) — families likely to look elsewhere, expect single-tenant / working-renter base with shorter leases.
- Market conditions: 86 active listings in the ZIP; 82 units permitted in Columbia County in 2024 (0 in 5+ unit buildings).
Forward outlook
- Local home prices are declining (-3.0%/yr); year-one equity from $1k of loan paydown is wiped out by about $5k of value loss. Plan a longer hold.
- Columbia County population projected at -12% by 2050 — secular population decline; favor cash flow + early exit over multi-decade hold.
Negotiation context
- Only 6 days on market — expect competitive offers; lowballing is unlikely to land.
- 2 sale attempts with the ask held roughly flat each time — persistent listings suggest the price (not the market) is what's stuck; bring a comps-based counter.
- Current owner paid $64k; list at $179k implies a 182% gain — meaningful room to come down on a strong offer.
Risks & watch-outs
- Watch-outs: built in 1900 — expect roof / HVAC / electrical / plumbing capex.
Questions for the listing agent
- Built in 1900 — when were the roof, HVAC, electrical panel, plumbing, and water heater last replaced?
- Is there a deadline driving the sale (1031 exchange, divorce, estate, relocation)? That informs how much negotiation room exists.
- Schools are B-rated — typically a magnet for longer-tenancy family renters. What's the average tenant stay here, and is there a school-zone premium baked into asking?
- The area grade is low — what's the realistic commute time and amenity access for the typical tenant pool here? Any planned neighborhood developments (good or bad) we should know about?
- What's the average days-on-market for RENTAL listings here right now (not sales)? A rising rental-DOM trend means longer vacancies and softer asking-rent achievability than the comps imply.
- What's the recent tenant-quality profile in this submarket — average credit score on applications, eviction rate, late-payment / NSF rate, and stable-employment percentage? A property-management company in the area should have these aggregated.
- How much new for-sale + rental construction is in the pipeline within 1–3 miles? Heavy new supply typically softens prices + rents 12–24 months out; constrained supply supports both.
Investment metrics
- 1% rule
- 0.88% ✗
- Cap rate
- 6.54%
- Cash-on-cash
- 0.89%
- DSCR
- 1.04
- GRM
- 9.4
CMA / ARV
No comps found within radius.
Projected returns pro-forma
-3.0% appreciation · 3.0% rent growth · sell at horizon
- IRR
- -14.9%
- Equity multiple
- 0.47×
- Total profit
- $-26,638
- Equity at exit
- $26,689
- IRR
- -6.2%
- Equity multiple
- 0.60×
- Total profit
- $-20,127
- Equity at exit
- $15,477
Cash invested: $50,120 (down + closing). Projections, not guarantees.
Landlord ↔ Tenant lean methodology
- Overall (STATE)
- 62 Landlord-Friendly
- State Pennsylvania
- 62 Landlord-Friendly · EVEN
- County
- — inherits STATE
- City
- — inherits STATE
ZIP-level market 18603
- Active inventory
- 86
- Price-to-rent
- 9.4×
Monthly cashflow live
- Estimated rent
- $1,579 medium interval (Pro) →
- Mortgage (P&I)
- −$939
- Tax from tax record
- −$197 /mo · $2,365/yr
- Insurance
- −$75
- HOA
- −$0
- Vacancy / Maint / Mgmt
- −$332
- Net cashflow
- $37
Break-even live
UW: 25.0% down · 7.5% · 30yr · 1.5% tax · 5.0% vac · 8.0% maint · 8.0% mgmt
Financing live
Cash to close
- Down payment
- $44,750
- Closing costs
- $5,370
- Reserves months
- —
- Total cash needed
- —
Loan-product check · same deal, 3 products live
Conventional
25% down · 7.5% · 30yr
- Down + closing
- —
- Monthly P&I
- —
- Monthly cashflow
- —
- DSCR
- —
- Eligible?
- —
Personal DTI + credit; lowest rate.
DSCR
20% down · 8.5% · 30yr
- Down + closing
- —
- Monthly P&I
- —
- Monthly cashflow
- —
- DSCR
- —
- Eligible?
- —
No personal income docs; deal must DSCR.
Hard money
10% down · 12.0% · 12mo
- Down + closing
- —
- Monthly P&I
- —
- Monthly cashflow
- —
- DSCR
- —
- Eligible?
- —
Short-term bridge; refi at stabilization.
Listing history 5 events
-
2026-04-29status Pending 287-char remark
Show marketing remark (287 chars)
Do Not Miss This Charming Corner Lot Home In Berwick Borough Priced To Sell And Full Of Warmth Potential And Personality. From the moment you arrive, this home gives off a sweet classic feel with its inviting front porch, traditional two story presence, and prominent corner lot setting.
-
2026-04-29status Pending
Show marketing remark (287 chars)
Do Not Miss This Charming Corner Lot Home In Berwick Borough Priced To Sell And Full Of Warmth Potential And Personality. From the moment you arrive, this home gives off a sweet classic feel with its inviting front porch, traditional two story presence, and prominent corner lot setting.
-
2026-04-24$179,000 Active 287-char remark
Show marketing remark (287 chars)
Do Not Miss This Charming Corner Lot Home In Berwick Borough Priced To Sell And Full Of Warmth Potential And Personality. From the moment you arrive, this home gives off a sweet classic feel with its inviting front porch, traditional two story presence, and prominent corner lot setting.
-
2026-04-23$179,000 Active
-
1991-02-28soldstatus $63,500
ⓘ Source: listings_history table (triggers on properties + properties_extension) + one-shot
backfill from property_details.listing_events for pre-trigger history.
Tax reassessment forecast PA · Partial reset (capped growth)
- Current annual tax
- $2,365 · $197/mo
- Projected year-2 tax
- $2,597 · $216/mo
- Expected delta
- +$231/yr (+$19/mo · 9.8%)
ⓘ Screening estimate from a state-policy table — verify with the county assessor before closing.
Climate risk First Street
- Flood 1/10 Low FEMA zone X (unshaded) · 0% chance over 30 yrs
- Wildfire 1/10 Low
- Heat 4/10 Moderate 7 d/yr ≥97°F today · 16 d/yr by 30 yrs out
- Wind 2/10 Low 4% chance of damaging wind over 30 yrs
- Air quality 2/10 Low 1 unhealthy d/yr today · 2 by 30 yrs out
Nearby sold comps map
Loading sold comps map…
Walkable amenities ~0.75 mi
Loading nearby amenities…
Taxation est. · year 1
- Rental income
- $18,948
- − Mortgage interest
- −$10,027
- − Property taxes
- −$2,365
- − Insurance
- −$895
- − Repairs & maintenance
- −$1,516
- − Management
- −$1,516
- − Depreciation
- −$5,207
- Taxable loss
- −$2,578
- Est. tax savings @ 24.0%
- +$619
- After-tax cash flow
- $1,063/yr
For passive investors: Depreciation is non-cash, so a rental often shows a tax loss while cash-flowing — sheltering income. Rental losses are passive: they offset passive income freely, and up to $25,000/yr can offset ordinary (W-2) income if you actively participate and your MAGI is under $100k (phasing out to $0 by $150k); unused losses carry forward. On sale, claimed depreciation is recaptured at up to 25%, and gains may owe capital-gains tax (a 1031 exchange can defer both). Figures are a year-1 estimate at your 24.0% rate — not tax advice; consult a CPA.
Schools (NCES district)
- District
- Berwick Area SD
- NCES district ID
- 4203480
- Math proficiency
- 32% ▼ -14.00%
- Reading proficiency
- 57% ▼ -6.00%
- Median HH income
- $41,964
- Composite
- 37.36/100
- National rank
- #4433
- State rank
- #291 of 539 in PA
Livability — Berwick
- Score
- 76/100
- State rank
- #412
- US rank
- #3762
Category grades
Schools grade is shown separately in the Schools card above.
Census & demographics
- Census place
- Berwick, PA
- Population (ZIP)
- 18,985
Population outlook (Columbia County) Hauer SSP2
- Today (2025)
- 65,170 people
- By 2030
- 64,054 · -1.7%
- By 2040
- 61,131 · -6.2%
- By 2050
- 57,526 · -11.7%
- By 2075
- 50,259 · -22.9%
- By 2100
- 44,756 · -31.3%
Race, ethnicity, and origin ACS 2023
- Neighborhood character
- Predominantly White (91%)
- Race & ethnicity
- White 91% Hispanic / Latino 4% Two or more races 3% Black 3%
- Common ancestry
- Romanian 6% Polish 4% Iranian 3%
- Foreign-born
- 3% · Canada
- Languages at home
- 97% English-only · Spanish 2% Russian/Polish/Slavic 1%
Political lean MEDSL · Columbia
- 2024 margin
- Solid R (+31.0) · D 34.0% · R 65.0%
- 2008→2024 swing
- -26.6pp toward R · 2008: -4.5pp · 2024: -31.0pp
- All cycles
- 2024: R+31.0 2020: R+30.7 2016: R+32.8 2012: R+12.4 2008: R+4.5
Not yet ingested
- Civics
- —
Market trends
- HPI YoY
- ▼ -123.40%
- Current HPI
- 211.5643
- Rent YoY
- —
- Metro
- —
- State GDP YoY
- ▲ 1.68%
- F500 in state
- 34
Industry mix (Fortune 500 HQ in PA)
| Industry | F500 HQs | Revenue |
|---|---|---|
| Healthcare | 2 | $309B |
|
||
| Insurance | 2 | $27B |
|
||
| Telecommunications / Media | 1 | $124B |
|
||
| Industrial Distribution | 1 | $22B |
|
||
| Financial Services | 1 | $20B |
|
||
| Chemicals / Materials | 1 | $18B |
|
||
Price history
+181.9% since first listed5 events — show timeline
- 2026-04-29 Pending — LCAR
- 2026-04-29 Pending — PMAR
- 2026-04-24 Listed $179,000 LCAR
- 2026-04-23 Listed $179,000 PMAR
- 1991-02-28 Sold (Public Records) $63,500 Public Records
Property tax history
+2.7%/yrLatest (2026): $2,365 · +2.2% YoY. Source: county tax records.
Cash-flow waterfall
monthlySold comps — $/sqft
last 12 mo · ≤1 miLoading sold comps…