2 Bed 1 Bath Single Section Plan · Dearborn Heights, MI
Flood risk No data
- FEMA flood zone
- —
- Chance of flooding over 30 yrs
- —
- Est. flood insurance / yr
- —
Fire risk No data
- Est. fire insurance / yr
- —
Heat risk No data
- Hot days now (above threshold)
- —
- Hot days in 30 yrs
- —
Wind risk No data
- Chance of severe wind over 30 yrs
- —
Air-quality risk No data
- Unhealthy air days now
- —
- Unhealthy air days in 30 yrs
- —
Risk factors via First Street. Map © Google.
Why this score? — see what drove the B- grade
The composite is a weighted blend of 9 inputs, each scored 0–100. Each bar is that input's sub-score; the figure is the points it added to the 100-point composite (weight × sub-score).
- Cash flow +30.0/30.0
- 1% rule +10.0/10.0
- DSCR +10.0/10.0
- ARV discount +7.5/15.0
- Livability +4.0/5.0
- Schools +3.2/10.0
- Rent growth +2.6/5.0
- Condition / age +1.0/5.0
- Appreciation +0.0/10.0
$64,900
🖨 Deal sheet 📄 Offer letter ✓ Due diligence
Listing remarks MLS
Welcome to Crestwood Estates, an age-qualified community where an exceptional lifestyle awaits you! Nestled in a prime location, we're a stone's throw from popular restaurants, stores, entertainment options, and essential services like pharmacies and medical facilities. Oak Lanes bowling alley is less than 5 minutes away, and Westland Shopping Center is a quick 10-minute drive. Nature enthusiasts will love the abundance of outdoor recreation spots, including Perrin Recreation Area, Nolar Bend Recreation Area, and Hines Park. Parks like Levagood Park, Rouge Park, and Parkland Park are also close by, along with several golf courses. Our fantastic amenities include a welcoming clubhouse and a pet-friendly environment. Join our caring age-qualified community, complete with on-site management, maintenance, and the convenience of an on-site sales office. Snow removal from the streets in the winter keeps your worries at bay. Experience affordability, top-notch amenities, and unbeatable convenience at Crestwood Estates. Schedule a private tour today - your new home awaits!
Key facts
- On-site sales office
- Prime location
- On-site management
Tags
Neighborhood map
What this means for you Summary
Snapshot
- This is a 2-bed/1.0-bath manufactured listed at $65k. Condition is rated poor.
Deal economics
- At list price, monthly cash flow is $672 ($8k/yr) — positive.
- The deal already cash-flows at list — no discount required.
- Meets the 1% rule at list price ($1k rent vs $65k).
- Recommended offer: $57k (12.0% below list) — sets the bar for market timing.
- Cap rate 18.7% vs local median 5.5% in Dearborn Heights — top-decile yield for the area; either an underpriced asset or a hidden risk that comps aren't pricing in. Stress-test before assuming the spread holds.
Location & tenants
- Location reads 79/100 on livability (#82 in MI, #1,885 nationally) — a middle-class / working-renter tenant base. Strengths: commute A+, cost of living A+, housing A+; Watch: schools C-, crime D+, employment D+.
- Crestwood School District (suburban): math 32% / reading 43% proficiency, ranked #242 of 540 in MI (top 45%) — families likely to look elsewhere, expect single-tenant / working-renter base with shorter leases.
- Market conditions: Rents flat; 143 active listings in the ZIP; 21 comparable units currently listed for rent nearby; rentals at typical pace (median 17d on market — plan ~3-4 weeks tenant-placement turnaround); 2,639 units permitted in Wayne County in 2024 (1,216 in 5+ unit buildings).
Forward outlook
- Local home prices are declining (-3.0%/yr); year-one equity from $449 of loan paydown is wiped out by about $2k of value loss. Plan a longer hold.
- Wayne County population projected at -17% by 2050 — secular population decline; favor cash flow + early exit over multi-decade hold.
- At projected returns (-3.0% appreciation + 0.4% rent growth), your $18k cash investment doubles in ~3 years — after that, you're playing with house money.
Negotiation context
- It's been on market 398 days — a 12% lower offer ($57k) is reasonable based on typical stale-listing flexibility.
Questions for the listing agent
- It's been on market 398 days. Have you received any prior offers? Is the seller open to a 12% concession, seller financing, or rate buy-down credit?
- Have any recent inspections been done? Can we get a copy of the seller's disclosures and any deferred-maintenance estimates?
- Why hasn't it sold? Are there any deal-killer items the seller is aware of (foundation, flood, title, zoning, code violations)?
- Is there a deadline driving the sale (1031 exchange, divorce, estate, relocation)? That informs how much negotiation room exists.
- Crime grade is D in this area — have there been break-ins, vandalism, or insurance claims at this property in the last 3 years? What carrier currently insures it and at what premium?
- What's the average days-on-market for RENTAL listings here right now (not sales)? A rising rental-DOM trend means longer vacancies and softer asking-rent achievability than the comps imply.
- What's the recent tenant-quality profile in this submarket — average credit score on applications, eviction rate, late-payment / NSF rate, and stable-employment percentage? A property-management company in the area should have these aggregated.
- How much new for-sale + rental construction is in the pipeline within 1–3 miles? Heavy new supply typically softens prices + rents 12–24 months out; constrained supply supports both.
Investment metrics
- 1% rule
- 2.19% ✓
- Cap rate
- 18.72%
- Cash-on-cash
- 44.38%
- DSCR
- 2.97
- GRM
- 3.8
CMA / ARV
No comps found within radius.
Projected returns pro-forma
-3.0% appreciation · 0.41% rent growth · sell at horizon
- IRR
- 38.4%
- Equity multiple
- 2.58×
- Total profit
- $28,703
- Equity at exit
- $9,677
- IRR
- 43.6%
- Equity multiple
- 4.64×
- Total profit
- $66,157
- Equity at exit
- $5,611
Cash invested: $18,172 (down + closing). Projections, not guarantees.
Landlord ↔ Tenant lean methodology
- Overall (STATE)
- 62 Landlord-Friendly
- State Michigan
- 62 Landlord-Friendly · EVEN
- County
- — inherits STATE
- City
- — inherits STATE
ZIP-level market 48127
- Rents YoY
- 0.4%
- Active inventory
- 143
- Price-to-rent
- 3.8×
Monthly cashflow live
- Estimated rent
- $1,418 high interval (Pro) →
- Mortgage (P&I)
- −$340
- Tax est. 1.5%
- −$81 /mo · $974/yr
- Insurance
- −$27
- HOA
- −$0
- Vacancy / Maint / Mgmt
- −$298
- Net cashflow
- $672
Break-even live
UW: 25.0% down · 7.5% · 30yr · 1.5% tax · 5.0% vac · 8.0% maint · 8.0% mgmt
Financing live
Cash to close
- Down payment
- $16,225
- Closing costs
- $1,947
- Reserves months
- —
- Total cash needed
- —
Loan-product check · same deal, 3 products live
Conventional
25% down · 7.5% · 30yr
- Down + closing
- —
- Monthly P&I
- —
- Monthly cashflow
- —
- DSCR
- —
- Eligible?
- —
Personal DTI + credit; lowest rate.
DSCR
20% down · 8.5% · 30yr
- Down + closing
- —
- Monthly P&I
- —
- Monthly cashflow
- —
- DSCR
- —
- Eligible?
- —
No personal income docs; deal must DSCR.
Hard money
10% down · 12.0% · 12mo
- Down + closing
- —
- Monthly P&I
- —
- Monthly cashflow
- —
- DSCR
- —
- Eligible?
- —
Short-term bridge; refi at stabilization.
Rent comps 21 comps
| Address | Beds | Baths | Sqft | Rent | $/sqft | DOM | Units | Dist |
|---|---|---|---|---|---|---|---|---|
| 79 3rd St Unit 79 Dearborn Heights, MI | 2.0 | 1.0 | 840 | $1,339 | $1.59 | 24d | 1 | 0.04mi |
| 181 Terri Dr Unit 181 Dearborn Heights, MI | 2.0 | 2.0 | 840 | $1,119 | $1.33 | 4d | 1 | 0.10mi |
| 7014 Kinmore St Dearborn Heights, MI | 3.0 | 1.0 | 960 | $1,900 | $1.98 | 21d | 1 | 0.52mi |
| 7080 Highview St Dearborn Heights, MI | 3.0 | 2.5 | 1105 | $2,000 | $1.81 | 17d | 1 | 0.65mi |
| 6954 Inkster Rd Dearborn Heights, MI | 1.0–2.0 | 1.0–1.5 | 837 | $1,339 | $1.60 | 2d | 9 | 0.67mi |
| 5722 Centralia St Dearborn Heights, MI | 3.0 | 1.0 | 999 | $1,750 | $1.75 | 1d | 1 | 0.83mi |
| 7048 Deering St Garden City, MI | 3.0 | 1.0 | 910 | $1,500 | $1.65 | 17d | 1 | 0.91mi |
| 5726 Inkster Rd Dearborn Heights, MI | 1.0 | 1.0 | 630 | $1,050 | $1.67 | 43d | 1 | 0.99mi |
| 7215 Lathers St Westland, MI | 1.0 | 1.0 | 836 | $1,045 | $1.25 | 24d | 1 | 1.14mi |
| 27201 Canfield St W Dearborn Heights, MI | 1.0–2.0 | 1.0–2.0 | 852 | $1,499 | $1.76 | 1d | 22 | 1.15mi |
| 7435 Lathers St Westland, MI | 3.0 | 1.0 | 1120 | $1,900 | $1.70 | 16d | 1 | 1.16mi |
| 7457 Harrison St Westland, MI | 3.0 | 1.0 | 1120 | $1,900 | $1.70 | 1d | 1 | 1.22mi |
| 5839 Helen St Garden City, MI | 3.0 | 1.0 | 984 | $1,500 | $1.52 | 24d | 1 | 1.22mi |
| 8455 Robindale Ave Dearborn Heights, MI | 3.0 | 1.0 | 1100 | $1,750 | $1.59 | 4d | 1 | 1.22mi |
| 7484 Affeldt St Westland, MI | 3.0 | 1.0 | 1120 | $1,500 | $1.34 | 24d | 1 | 1.25mi |
| 7420 Drexel St Dearborn Heights, MI | 2.0 | 1.0 | 1080 | $1,700 | $1.57 | 43d | 1 | 1.25mi |
| 7420 Drexel St Dearborn Heights, MI | 2.0 | 1.0 | 1080 | $1,700 | $1.57 | 17d | 1 | 1.25mi |
| 7420 Drexel St Dearborn Heights, MI | 2.0 | 1.0 | 1080 | $1,600 | $1.48 | 4d | 1 | 1.25mi |
| 5927 Lathers St Garden City, MI | 3.0 | 1.0 | 1000 | $1,600 | $1.60 | 1d | 1 | 1.30mi |
| 8187 Lenore St Dearborn Heights, MI | 2.0 | 1.0 | 768 | $1,550 | $2.02 | 43d | 1 | 1.38mi |
| 23700 W Warren St Dearborn Heights, MI | 1.0 | 1.0 | 900 | $1,120 | $1.24 | 43d | 2 | 1.43mi |
Listing history 16 events
-
2026-06-18days on market $64,900 Active 398 DOM
-
2026-06-17days on market $64,900 Active 397 DOM
-
2026-06-16days on market $64,900 Active 396 DOM
-
2026-06-15days on market $64,900 Active 395 DOM
-
2026-06-13days on market $64,900 Active 393 DOM
-
2026-06-13days on market $64,900 Active 392 DOM
-
2026-06-09days on market $64,900 Active 389 DOM
-
2026-06-08days on market $64,900 Active 388 DOM
-
2026-06-07days on market $64,900 Active 387 DOM
-
2026-06-04days on market $64,900 Active 384 DOM
-
2026-06-03days on market $64,900 Active 383 DOM
-
2026-06-02days on market $64,900 Active 382 DOM
-
2026-06-01days on market $64,900 Active 381 DOM
-
2026-05-31days on market $64,900 Active 380 DOM
-
2025-10-18price $64,900 1081-char remark
Show marketing remark (1081 chars)
Welcome to Crestwood Estates, an age-qualified community where an exceptional lifestyle awaits you! Nestled in a prime location, we're a stone's throw from popular restaurants, stores, entertainment options, and essential services like pharmacies and medical facilities. Oak Lanes bowling alley is less than 5 minutes away, and Westland Shopping Center is a quick 10-minute drive. Nature enthusiasts will love the abundance of outdoor recreation spots, including Perrin Recreation Area, Nolar Bend Recreation Area, and Hines Park. Parks like Levagood Park, Rouge Park, and Parkland Park are also close by, along with several golf courses. Our fantastic amenities include a welcoming clubhouse and a pet-friendly environment. Join our caring age-qualified community, complete with on-site management, maintenance, and the convenience of an on-site sales office. Snow removal from the streets in the winter keeps your worries at bay. Experience affordability, top-notch amenities, and unbeatable convenience at Crestwood Estates. Schedule a private tour today - your new home awaits!
-
2025-05-17$56,900 Active 1081-char remark
Show marketing remark (1081 chars)
Welcome to Crestwood Estates, an age-qualified community where an exceptional lifestyle awaits you! Nestled in a prime location, we're a stone's throw from popular restaurants, stores, entertainment options, and essential services like pharmacies and medical facilities. Oak Lanes bowling alley is less than 5 minutes away, and Westland Shopping Center is a quick 10-minute drive. Nature enthusiasts will love the abundance of outdoor recreation spots, including Perrin Recreation Area, Nolar Bend Recreation Area, and Hines Park. Parks like Levagood Park, Rouge Park, and Parkland Park are also close by, along with several golf courses. Our fantastic amenities include a welcoming clubhouse and a pet-friendly environment. Join our caring age-qualified community, complete with on-site management, maintenance, and the convenience of an on-site sales office. Snow removal from the streets in the winter keeps your worries at bay. Experience affordability, top-notch amenities, and unbeatable convenience at Crestwood Estates. Schedule a private tour today - your new home awaits!
ⓘ Source: listings_history table (triggers on properties + properties_extension) + one-shot
backfill from property_details.listing_events for pre-trigger history.
Nearby sold comps map
Loading sold comps map…
Walkable amenities ~0.75 mi
Loading nearby amenities…
Taxation est. · year 1
- Rental income
- $17,021
- − Mortgage interest
- −$3,635
- − Property taxes
- −$974
- − Insurance
- −$324
- − Repairs & maintenance
- −$1,362
- − Management
- −$1,362
- − Depreciation
- −$1,888
- Taxable income
- $7,476
- Est. tax owed @ 24.0%
- −$1,794
- After-tax cash flow
- $6,270/yr
For passive investors: Depreciation is non-cash, so a rental often shows a tax loss while cash-flowing — sheltering income. Rental losses are passive: they offset passive income freely, and up to $25,000/yr can offset ordinary (W-2) income if you actively participate and your MAGI is under $100k (phasing out to $0 by $150k); unused losses carry forward. On sale, claimed depreciation is recaptured at up to 25%, and gains may owe capital-gains tax (a 1031 exchange can defer both). Figures are a year-1 estimate at your 24.0% rate — not tax advice; consult a CPA.
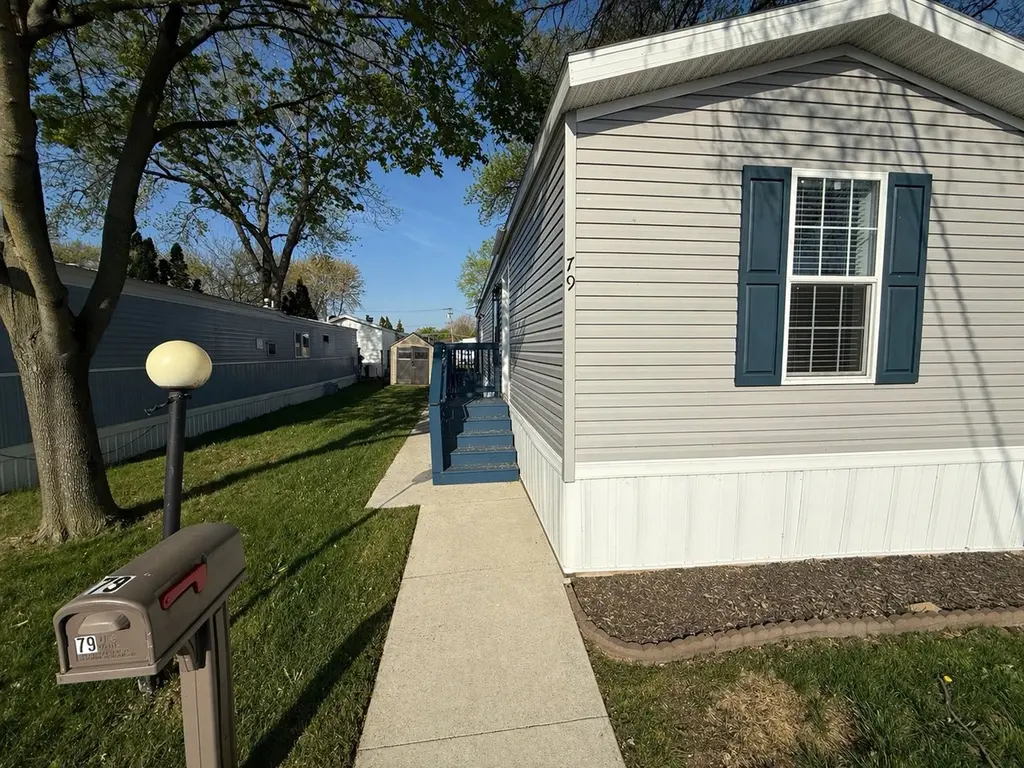
Condition & rehab AI · 1 photo
This manufactured home requires extensive repairs and updates to bring it up to a livable condition. Significant investments in siding, roof, flooring, interior, windows, HVAC, and landscaping are necessary to increase its resale and rental value.
Repairs flagged
- Major siding — Significant wear and tear
- Major roof — Siding condition suggests underlying issues
- Major flooring — No visible flooring, but overall condition suggests need for replacement
- Major interior walls/paint — No visible interior, but overall condition suggests need for repair
- Major windows — No visible windows, but overall condition suggests need for replacement
- Major HVAC/mechanicals — No visible systems, but overall condition suggests need for replacement
- Major landscaping — Overgrown lawn, lack of landscaping
Value-add opportunities
- Resale new siding — Enhances curb appeal and property value
- Resale new roof — Improves structural integrity and longevity
- Resale new flooring — Enhances interior aesthetics and comfort
- Resale new interior paint — Freshens up the interior and improves curb appeal
- Resale new windows — Enhances natural light and energy efficiency
- Resale new HVAC system — Improves comfort and energy efficiency
- Resale landscaping — Enhances curb appeal and property value
Renovation cost estimate screening
| Repair item | Severity | Est. cost |
|---|---|---|
| siding · Significant wear and tear | Major | $15,000–50,000 |
| roof · Siding condition suggests underlying issues | Major | $15,000–50,000 |
| flooring · No visible flooring, but overall condition suggests need for replacement | Major | $15,000–50,000 |
| interior walls/paint · No visible interior, but overall condition suggests need for repair | Major | $15,000–50,000 |
| windows · No visible windows, but overall condition suggests need for replacement | Major | $15,000–50,000 |
| HVAC/mechanicals · No visible systems, but overall condition suggests need for replacement | Major | $15,000–50,000 |
| landscaping · Overgrown lawn, lack of landscaping | Major | $15,000–50,000 |
| Total estimated repair cost · 7 items | $105,000–350,000 |
Value-add ROI direction
- Resale new siding — Enhances curb appeal and property value ↑
- Resale new roof — Improves structural integrity and longevity ↑
- Resale new flooring — Enhances interior aesthetics and comfort ↑
- Resale new interior paint — Freshens up the interior and improves curb appeal ↑
- Resale new windows — Enhances natural light and energy efficiency ↑
- Resale new HVAC system — Improves comfort and energy efficiency ↑
- Resale landscaping — Enhances curb appeal and property value ↑
ⓘ Cost ranges are severity-bucket heuristics (US national rule-of-thumb). Get contractor quotes + a written scope before underwriting a rehab budget.
Schools (NCES district)
- District
- Crestwood School District
- NCES district ID
- 2600016
- Math proficiency
- 32% ▼ -6.00%
- Reading proficiency
- 43% ▼ -4.00%
- Median HH income
- $47,101
- Composite
- 32.1/100
- National rank
- #5806
- State rank
- #242 of 540 in MI
Livability — Dearborn Heights
- Score
- 79/100
- State rank
- #82
- US rank
- #1885
Category grades
Schools grade is shown separately in the Schools card above.
Census & demographics
- Census place
- Dearborn Heights, MI
- County
- Wayne County · 1,562,939 people
- City population
- 61,771
- Metro
- Detroit-Warren-Dearborn, MI
- Population (ZIP)
- 39,646
- Household income
- $60,742
- Rent vs Own
- Severe rent burden
- 1196.0
Population outlook (Wayne County) Hauer SSP2
- Today (2025)
- 1,675,273 people
- By 2030
- 1,620,300 · -3.3%
- By 2040
- 1,502,341 · -10.3%
- By 2050
- 1,384,039 · -17.4%
- By 2075
- 1,124,592 · -32.9%
- By 2100
- 881,193 · -47.4%
Race, ethnicity, and origin ACS 2023
- Neighborhood character
- Predominantly White (85%)
- Race & ethnicity
- White 85% Black 8% Two or more races 3% Hispanic / Latino 3% Asian 2%
- Common ancestry
- Arab 8% Romanian 7% Lithuanian 2%
- Foreign-born
- 31% · Canada
- Languages at home
- 46% English-only · Arabic 45% Russian/Polish/Slavic 2% Other Indo-European 2%
Political lean MEDSL · Wayne
- 2024 margin
- Strong D (+29.0) · D 62.7% · R 33.7% · Other 3.6%
- 2008→2024 swing
- -20.5pp toward R · 2008: 49.5pp · 2024: 29.0pp
- All cycles
- 2024: D+29.0 2020: D+38.1 2016: D+37.3 2012: D+46.9 2008: D+49.5
Not yet ingested
- Civics
- —
Market trends
- HPI YoY
- ▼ -319.04%
- Current HPI
- 225.9407
- Rent YoY
- ▲ 0.41%
- Metro
- Detroit-Warren-Dearborn, MI
- State GDP YoY
- ▲ 1.37%
- F500 in state
- 28
Industry mix (Fortune 500 HQ in MI)
| Industry | F500 HQs | Revenue |
|---|---|---|
| Automotive Parts | 3 | $48B |
|
||
| Automotive | 2 | $372B |
|
||
| Chemicals | 1 | $45B |
|
||
| Automotive Retail | 1 | $29B |
|
||
| Healthcare / Medical Devices | 1 | $23B |
|
||
| Automotive Technology | 1 | $20B |
|
||
Price history
+14.1% since first listed2 events — show timeline
- 2025-10-18 Price Changed $64,900 Zillow
- 2025-05-17 Listed $56,900 Zillow
Cash-flow waterfall
monthlySold comps — $/sqft
last 12 mo · ≤1 miLoading sold comps…