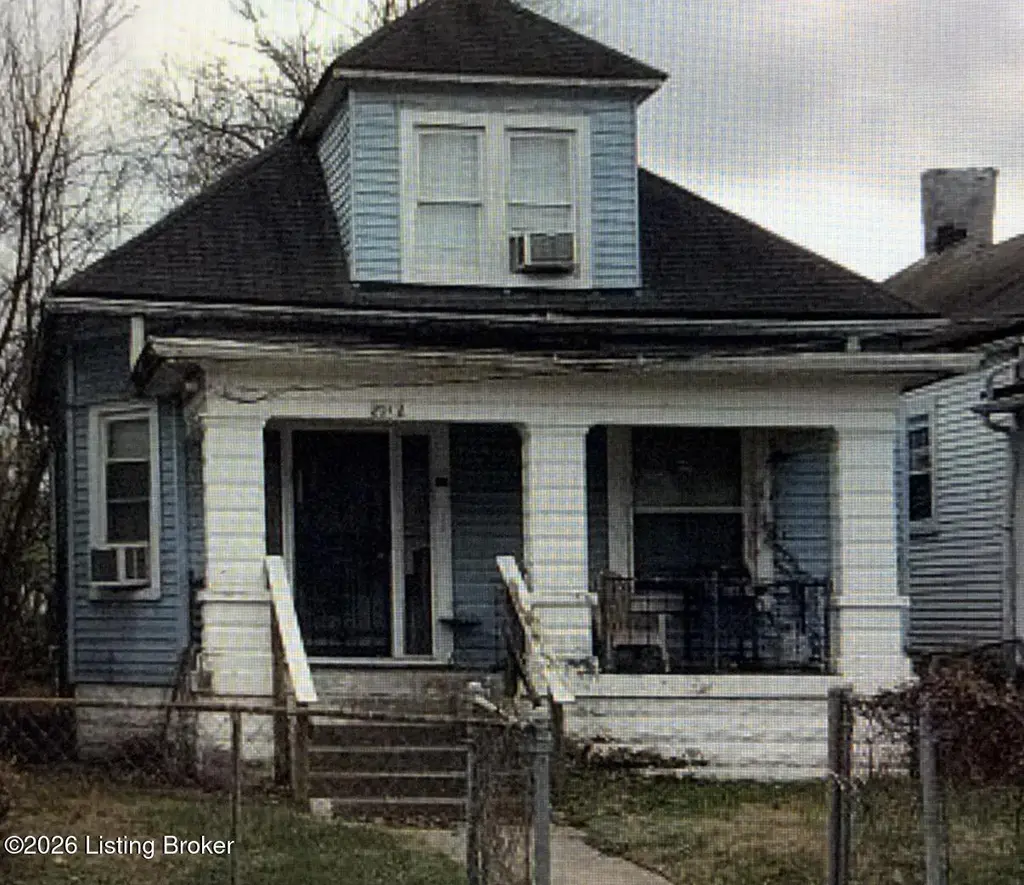
2112 W Kentucky St · Louisville, KY
Flood risk 1/10 · Minimal
- FEMA flood zone
- X (shaded)
- Chance of flooding over 30 yrs
- 0.0%
- Est. flood insurance / yr
- $473 – $860
Fire risk 1/10 · Minimal
- Est. fire insurance / yr
- $839 – $1,559
Heat risk 5/10 · Moderate
- Hot days now (above 105°F)
- 7 days/yr
- Hot days in 30 yrs
- 20 days/yr
Wind risk 2/10 · Minimal
- Chance of severe wind over 30 yrs
- 1.0%
Air-quality risk 2/10 · Minimal
- Unhealthy air days now
- 1 days/yr
- Unhealthy air days in 30 yrs
- 3 days/yr
Risk factors via First Street. Map © Google.
Why this score? — see what drove the A- grade
The composite is a weighted blend of 9 inputs, each scored 0–100. Each bar is that input's sub-score; the figure is the points it added to the 100-point composite (weight × sub-score).
- Cash flow +30.0/30.0
- 1% rule +10.0/10.0
- DSCR +10.0/10.0
- Appreciation +10.0/10.0
- ARV discount +7.5/15.0
- Rent growth +4.5/5.0
- Livability +3.2/5.0
- Condition / age +2.5/5.0
- Schools +2.3/10.0
$55,000
🖨 Deal sheet (PDF) 📄 Offer letter ✓ Due diligence
Listing remarks MLS
3 bedroom, 1 bath house with large front porch. This is a bank foreclosure and will be sold as is with no repairs done by the seller. All offers require proof of funds or a preapproval letter. There is a 3 month deed restriction on this property.
Key facts
- 4,050 sq ft lot
- Built 1920
- Listed 25 days
Property features AI
Finance
- HOA & community: No association fee
Exterior
- Utilities: Electricity connected; Natural gas available
- Home design: Single-family residence; Bungalow style; One story
- Construction: Built in 1920; Vinyl siding; Shingle roof; Concrete block foundation
- Exterior features: Chain link fencing; Sidewalk
Interior
- Kitchen: Kitchen on the first floor; Formal dining room on the first floor
- Bedrooms: 3 bedrooms total; 1 bedroom on the first floor; 2 bedrooms on the second floor
- Bathrooms: 1 full bathroom on the first floor
- Heating & cooling: Forced air heating
- Interior features: 5 total rooms; 4 closets; Basement (unfinished); Other room on first floor (unspecified)
- Laundry & utility: No first-floor laundry
Neighborhood map
What this means for you Summary
Snapshot
- This is a 3-bed/1.0-bath single-family listed at $55k.
Deal economics
- At list price, monthly cash flow is $754 ($9k/yr) — positive.
- The deal already cash-flows at list — no discount required.
- Meets the 1% rule at list price ($1k rent vs $55k).
- Recommended offer: $54k (1.5% below list) — sets the bar for market timing.
Location & tenants
- Location reads 63/100 on livability (#333 in KY) — a middle-class / working-renter tenant base. Strengths: cost of living A+, housing A+; Watch: employment C-, health & safety D+, crime F.
- Jefferson County (urban): math 19% / reading 35% proficiency, ranked #121 of 165 in KY (top 73%) — low school quality limits family demand, transient renter base, plan for 1-2y turnover.
- Zoned schools: Wheatley Elementary (math 2% / reading 8%, grade F, #670 of 676 statewide, top 100%, 318 students, 84% FRL); Western Middle School For The Arts (math 9% / reading 41%, grade F, #184 of 217 statewide, top 87%, 650 students, 60% FRL); Seneca High (math 8% / reading 17%, grade F, #228 of 254 statewide, top 91%, 1,309 students, 64% FRL).
- Zoned-school proficiency averages 14% at this address vs 27% district-wide (-13 pts) — the specific schools serving this property underperform the Jefferson County average; the district grade overstates school quality for this exact location.
- Market conditions: Rents rising fast (+8.1%/yr); 94 active listings in the ZIP; 14 comparable units currently listed for rent nearby; rentals at typical pace (median 19d on market — plan ~3-4 weeks tenant-placement turnaround); lower-income renter base — watch delinquency; 2,836 units permitted in Jefferson County in 2024 (1,558 in 5+ unit buildings).
Forward outlook
- In year one you build about $6k of equity ($380 loan paydown + $6k appreciation (10.0% local appreciation)).
- Jefferson County population projected at +13% by 2050 — modest demand growth; plan on rents tracking national, not racing it.
- At projected returns (10.0% appreciation + 8.0% rent growth), your $15k cash investment doubles in ~2 years — after that, you're playing with house money.
- By year 6, paydown + projected appreciation supports a ~$35k cash-out refi (75% LTV) — recoverable capital for the next deal without selling this one.
Negotiation context
- It's been on market 25 days — a 2% lower offer ($54k) is reasonable based on typical stale-listing flexibility.
- 4 sale attempts since 28y ago with the ask held roughly flat each time — persistent listings suggest the price (not the market) is what's stuck; bring a comps-based counter.
Risks & watch-outs
- Watch-outs: built in 1920 — expect roof / HVAC / electrical / plumbing capex.
- Climate carrying-cost: extreme-heat days projected 7→20/yr by 2055 (HVAC capex compounding) — expect insurance premiums to compound above CPI over the hold.
Questions for the listing agent
- Built in 1920 — when were the roof, HVAC, electrical panel, plumbing, and water heater last replaced?
- Is there a deadline driving the sale (1031 exchange, divorce, estate, relocation)? That informs how much negotiation room exists.
- Schools are D-rated, which usually means shorter tenancies and higher turnover. Who's the typical renter profile here, and what's been the actual vacancy rate?
- Crime grade is F in this area — have there been break-ins, vandalism, or insurance claims at this property in the last 3 years? What carrier currently insures it and at what premium?
- What's the average days-on-market for RENTAL listings here right now (not sales)? A rising rental-DOM trend means longer vacancies and softer asking-rent achievability than the comps imply.
- What's the recent tenant-quality profile in this submarket — average credit score on applications, eviction rate, late-payment / NSF rate, and stable-employment percentage? A property-management company in the area should have these aggregated.
- How much new for-sale + rental construction is in the pipeline within 1–3 miles? Heavy new supply typically softens prices + rents 12–24 months out; constrained supply supports both.
Investment metrics
- 1% rule
- 2.58% ✓
- Cap rate
- 22.75%
- Cash-on-cash
- 58.76%
- DSCR
- 3.61
- GRM
- 3.2
CMA / ARV
- ARV (on-the-fly)
- $157,234
- Comps found
- 12
Show comp detail 12 sales within ~0.75 mi
| Address | Dist | Beds/Ba | Sqft | Sold | Price | $/sf | Match |
|---|---|---|---|---|---|---|---|
| 2341 Grand Ave | 0.30mi | 3/1.5 | 2,002 (-2%) | 5mo | $129,900 | $65 | 77 |
| 1834 W Kentucky St | 0.09mi | 2/1.0 (-1) | 1,848 (-10%) | 4mo | $63,000 | $34 | 71 |
| 2530 W Kentucky St | 0.37mi | 3/2.0 | 1,900 (-7%) | 1mo | $145,900 | $77 | 66 |
| 2314 Garland Ave | 0.25mi | 4/2.0 (+1) | 2,122 (+4%) | 8mo | $181,000 | $85 | 66 |
| 2625 Garland Ave | 0.49mi | 3/2.0 | 2,022 (-1%) | 12mo | $142,000 | $70 | 62 |
| 2724 Hale Ave | 0.60mi | 3/1.5 | 1,891 (-7%) | 3mo | $55,000 | $29 | 56 |
| 1703 Wilson Ave | 0.63mi | 3/1.5 | 1,896 (-7%) | 7mo | $32,000 | $17 | 50 |
| 2633 Grand Ave | 0.48mi | 4/2.0 (+1) | 1,902 (-7%) | 10mo | $165,000 | $87 | 49 |
| 2001 Wilson Ave | 0.48mi | 3/2.0 | 1,764 (-14%) | 8mo | $85,000 | $48 | 45 |
| 1365 Cypress St | 0.73mi | 3/1.5 | 1,764 (-14%) | 4mo | $165,000 | $94 | 38 |
| 2832 Greenwood Ave | 0.69mi | 3/1.0 | 1,760 (-14%) | 13mo | $205,000 | $116 | 34 |
| 1624 Hale Ave | 0.47mi | 4/3.0 (+1) | 2,300 (+13%) | 15mo | $231,000 | $100 | 32 |
Match score weights: distance 35% · size 25% · config 20% · recency 20%. Top-matched comps best support the ARV.
Projected returns pro-forma
10.0% appreciation · 8.0% rent growth · sell at horizon
- IRR
- 75.1%
- Equity multiple
- 6.55×
- Total profit
- $85,505
- Equity at exit
- $49,548
- IRR
- 70.9%
- Equity multiple
- 16.11×
- Total profit
- $232,654
- Equity at exit
- $106,853
Cash invested: $15,400 (down + closing). Projections, not guarantees.
Landlord ↔ Tenant lean methodology
- Overall (STATE)
- 83 Strongly Landlord-Friendly
- State Kentucky
- 83 Strongly Landlord-Friendly · R+16
- County
- — inherits STATE
- City
- — inherits STATE
ZIP-level market 40210
- Home prices YoY
- 12.1%
- Rents YoY
- 8.1%
- Active inventory
- 94
- Price-to-rent
- 3.2×
Monthly cashflow live
- Estimated rent
- $1,421 high interval (Pro) →
- Mortgage (P&I)
- −$288
- Tax from tax record
- −$57 /mo · $681/yr
- Insurance
- −$23
- HOA
- −$0
- Lot rent
- −$0
- Vacancy / Maint / Mgmt
- −$298
- Net cashflow
- $754
Break-even live
Sensitivity live
| Price | -10% $785 | -5% $770 | +0% $754 | +5% $739 | +10% $723 |
|---|---|---|---|---|---|
| Rent | -10% $642 | -5% $698 | +0% $754 | +5% $810 | +10% $866 |
| Rate | -1.0pp $782 | -0.5pp $768 | base $754 | +0.5pp $740 | +1.0pp $725 |
UW: 25.0% down · 7.5% · 30yr · 1.5% tax · 5.0% vac · 8.0% maint · 8.0% mgmt
Financing live
Cash to close
- Down payment
- $13,750
- Closing costs
- $1,650
- Reserves months
- —
- Total cash needed
- —
Loan-product check · same deal, 3 products live
Conventional
25% down · 7.5% · 30yr
- Down + closing
- —
- Monthly P&I
- —
- Monthly cashflow
- —
- DSCR
- —
- Eligible?
- —
Personal DTI + credit; lowest rate.
DSCR
20% down · 8.5% · 30yr
- Down + closing
- —
- Monthly P&I
- —
- Monthly cashflow
- —
- DSCR
- —
- Eligible?
- —
No personal income docs; deal must DSCR.
Hard money
10% down · 12.0% · 12mo
- Down + closing
- —
- Monthly P&I
- —
- Monthly cashflow
- —
- DSCR
- —
- Eligible?
- —
Short-term bridge; refi at stabilization.
Rent comps 14 comps
| Address | Beds | Baths | Sqft | Rent | $/sqft | DOM | Units | Dist |
|---|---|---|---|---|---|---|---|---|
| 2117 Osage Ave Louisville, KY | 3.0 | 1.0 | 1924 | $1,460 | $0.76 | 0d | 1 | 0.18mi |
| 2825 Greenwood Ave #4 Louisville, KY | 3.0 | 1.0 | 1440 | $1,250 | $0.87 | 26d | 1 | 0.64mi |
| 2319 W Muhammad Ali Blvd Louisville, KY | 4.0 | 1.0 | 1644 | $1,300 | $0.79 | 18d | 1 | 0.90mi |
| 1774 Bolling Ave Louisville, KY | 3.0 | 2.0 | 1611 | $1,300 | $0.81 | 13d | 1 | 0.90mi |
| 1774 Bolling Ave Louisville, KY | 3.0 | 2.0 | 1611 | $1,300 | $0.81 | 0d | 1 | 0.90mi |
| 820 Hazel St Louisville, KY | 4.0 | 2.0 | 1872 | $1,395 | $0.75 | 5d | 1 | 0.92mi |
| 1545 Catalpa St Louisville, KY | 4.0 | 1.5 | 1760 | $1,545 | $0.88 | 6d | 1 | 1.11mi |
| 1456 Beech St Louisville, KY | 3.0 | 2.0 | 1498 | $1,650 | $1.10 | 0d | 1 | 1.12mi |
| 803 S 35th St Louisville, KY | 3.0 | 1.0 | 1486 | $1,350 | $0.91 | 26d | 1 | 1.19mi |
| 3514 Grand Ave Louisville, KY | 3.0 | 1.5 | 1450 | $1,295 | $0.89 | 24d | 1 | 1.26mi |
| 1618 S 30th St Louisville, KY | 3.0 | 1.0 | 1896 | $1,235 | $0.65 | 18d | 1 | 1.31mi |
| 2529 W Main St #2 Louisville, KY | 3.0 | 1.0 | 1404 | $1,200 | $0.85 | 26d | 1 | 1.32mi |
| 205 N 26th St Louisville, KY | 3.0 | 2.0 | 1538 | $1,350 | $0.88 | 0d | 1 | 1.42mi |
| 980 W Liberty St Louisville, KY | 1.0–3.0 | 1.0–1.5 | 1026 | $1,535 | $1.50 | 26d | 133 | 1.44mi |
Listing history 23 events
-
2026-06-22days on market $55,000 Active 25 DOM
-
2026-06-21days on market $55,000 Active 24 DOM
-
2026-06-18days on market $55,000 Active 21 DOM
-
2026-06-17days on market $55,000 Active 20 DOM
-
2026-06-16days on market $55,000 Active 19 DOM
-
2026-06-15days on market $55,000 Active 18 DOM
-
2026-06-13days on market $55,000 Active 16 DOM
-
2026-06-10days on market $55,000 Active 13 DOM
-
2026-06-09days on market $55,000 Active 12 DOM
-
2026-06-08days on market $55,000 Active 11 DOM
-
2026-06-07days on market $55,000 Active 10 DOM
-
2026-06-03days on market $55,000 Active 6 DOM
-
2026-06-02days on market $55,000 Active 5 DOM
-
2026-06-01days on market $55,000 Active 4 DOM
-
2026-05-31days on market $55,000 Active 3 DOM
-
2026-05-28$55,000 Active
-
2024-12-09soldstatus $129,900
-
2008-09-24soldstatus $15,000 246-char remark
Show marketing remark (246 chars)
3 bedroom, 1 bath house with large front porch. This is a bank foreclosure and will be sold as is with no repairs done by the seller. All offers require proof of funds or a preapproval letter. There is a 3 month deed restriction on this property.
-
2008-08-28$19,900 246-char remark
Show marketing remark (246 chars)
3 bedroom, 1 bath house with large front porch. This is a bank foreclosure and will be sold as is with no repairs done by the seller. All offers require proof of funds or a preapproval letter. There is a 3 month deed restriction on this property.
-
2004-07-21soldstatus $32,000 88-char remark
Show marketing remark (88 chars)
Square feet not warranted PVA. Hot! A great investment property and priced right. Hurry!
-
2004-06-27$37,500 88-char remark
Show marketing remark (88 chars)
Square feet not warranted PVA. Hot! A great investment property and priced right. Hurry!
-
1998-09-29soldstatus $27,900
-
1998-05-19$32,000
ⓘ Source: listings_history table (triggers on properties + properties_extension) + one-shot
backfill from property_details.listing_events for pre-trigger history.
Tax reassessment forecast KY · Resets to sale price
- Current annual tax
- $681 · $57/mo
- Projected year-2 tax
- $681 · $57/mo
- Expected delta
- $0/yr ($0/mo · 0.0%)
ⓘ Screening estimate from a state-policy table — verify with the county assessor before closing.
Climate risk First Street
- Flood 1/10 Low FEMA zone X (shaded) · 0% chance over 30 yrs
- Wildfire 1/10 Low
- Heat 5/10 Major 7 d/yr ≥105°F today · 20 d/yr by 30 yrs out
- Wind 2/10 Low 100% chance of damaging wind over 30 yrs
- Air quality 2/10 Low 1 unhealthy d/yr today · 3 by 30 yrs out
Nearby sold comps map
Loading sold comps map…
Walkable amenities ~0.75 mi
Loading nearby amenities…
Taxation est. · year 1
- Rental income
- $17,046
- − Mortgage interest
- −$3,081
- − Property taxes
- −$681
- − Insurance
- −$275
- − Repairs & maintenance
- −$1,364
- − Management
- −$1,364
- − Depreciation
- −$1,600
- Taxable income
- $8,682
- Est. tax owed @ 24.0%
- −$2,084
- After-tax cash flow
- $6,966/yr
For passive investors: Depreciation is non-cash, so a rental often shows a tax loss while cash-flowing — sheltering income. Rental losses are passive: they offset passive income freely, and up to $25,000/yr can offset ordinary (W-2) income if you actively participate and your MAGI is under $100k (phasing out to $0 by $150k); unused losses carry forward. On sale, claimed depreciation is recaptured at up to 25%, and gains may owe capital-gains tax (a 1031 exchange can defer both). Figures are a year-1 estimate at your 24.0% rate — not tax advice; consult a CPA.
Schools (NCES district)
- District
- Jefferson County
- NCES district ID
- 2102990
- Math proficiency
- 19% ▼ -17.00%
- Reading proficiency
- 35% ▼ -11.00%
- Median HH income
- $47,885
- Composite
- 23.45/100
- National rank
- #7884
- State rank
- #121 of 165 in KY
Livability — Louisville
- Score
- 63/100
- State rank
- #333
- US rank
- #15887
Category grades
Schools grade is shown separately in the Schools card above.
Census & demographics
- Census place
- Louisville, KY
- County
- Jefferson County · 790,184 people
- City population
- 769,292
- Metro
- Louisville/Jefferson County, KY-IN
- Population (ZIP)
- 13,518
- Household income
- $35,347
- Rent vs Own
- Severe rent burden
- 815.0
Population outlook (Jefferson County) Hauer SSP2
- Today (2025)
- 823,112 people
- By 2030
- 849,343 · +3.2%
- By 2040
- 895,696 · +8.8%
- By 2050
- 933,630 · +13.4%
- By 2075
- 1,028,262 · +24.9%
- By 2100
- 1,072,675 · +30.3%
Race, ethnicity, and origin ACS 2023
- Neighborhood character
- Predominantly Black (84%)
- Race & ethnicity
- Black 84% White 8% Two or more races 5% Hispanic / Latino 3%
- Common ancestry
- Iranian 1%
- Foreign-born
- 4% · Canada
- Languages at home
- 93% English-only · Spanish 3%
Political lean MEDSL · Jefferson
- 2024 margin
- D (+16.6) · D 57.4% · R 40.9% · Other 1.7%
- 2008→2024 swing
- +4.5pp toward D · 2008: 12.0pp · 2024: 16.6pp
- All cycles
- 2024: D+16.6 2020: D+20.1 2016: D+13.3 2012: D+11.1 2008: D+12.0
Not yet ingested
- Civics
- —
Market trends
- HPI YoY
- ▲ 28.45%
- Current HPI
- 264.0146
- Rent YoY
- ▲ 8.05%
- Metro
- Louisville/Jefferson County, KY-IN
- State GDP YoY
- ▲ 1.81%
- F500 in state
- 4
Industry mix (Fortune 500 HQ in KY)
| Industry | F500 HQs | Revenue |
|---|---|---|
| Healthcare | 1 | $118B |
|
||
| Food / Beverage | 1 | $7B |
|
||
Price history
+71.9% since first listed8 events — show timeline
- 2026-05-28 Listed $55,000 Metro Search MLS
- 2024-12-09 Sold (Public Records) $129,900 Public Records
- 2008-09-24 Sold (MLS) $15,000 Metro Search MLS
- 2008-08-28 Listed $19,900 Metro Search MLS
- 2004-07-21 Sold (MLS) $32,000 Metro Search MLS
- 2004-06-27 Listed $37,500 Metro Search MLS
- 1998-09-29 Sold (MLS) $27,900 Metro Search MLS
- 1998-05-19 Listed $32,000 Metro Search MLS
Property tax history
+4.8%/yrLatest (2025): $681 · -1.9% YoY. Source: county tax records.
Cash-flow waterfall
monthlySold comps — $/sqft
last 12 mo · ≤1 miLoading sold comps…