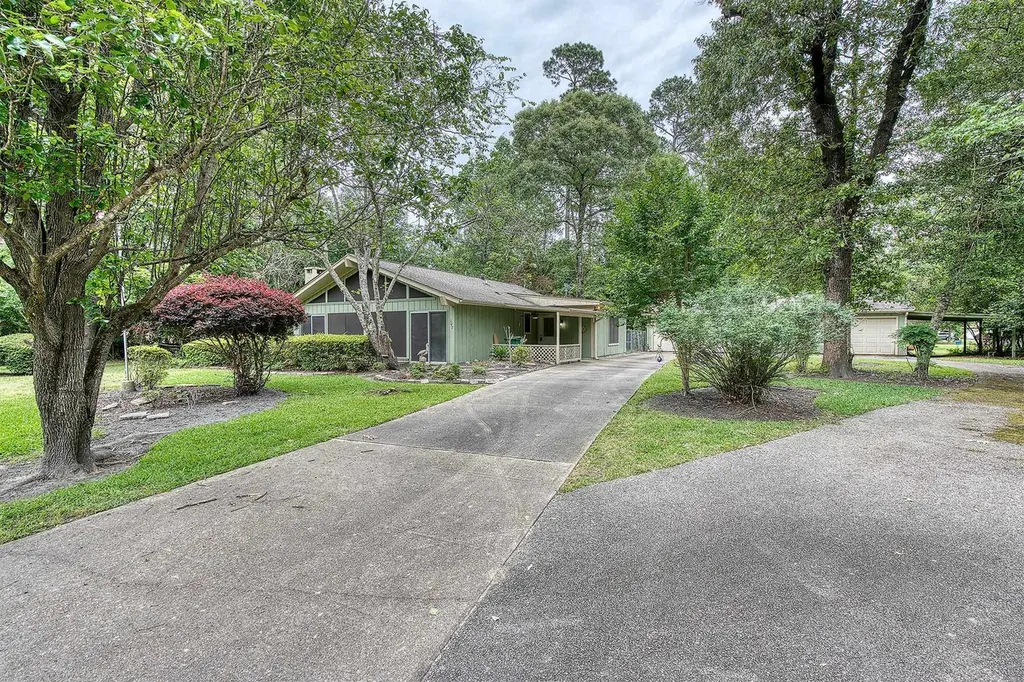
107 Idylwood · Wildwood, TX
Flood risk 1/10 · Minimal
- FEMA flood zone
- X (unshaded)
- Chance of flooding over 30 yrs
- 0.0%
- Est. flood insurance / yr
- $507 – $1,088
Fire risk 4/10 · Minor
- Est. fire insurance / yr
- $1,222 – $2,270
Heat risk 9/10 · Severe
- Hot days now (above 112°F)
- 7 days/yr
- Hot days in 30 yrs
- 24 days/yr
Wind risk 9/10 · Severe
- Chance of severe wind over 30 yrs
- 99.0%
Air-quality risk 1/10 · Minimal
- Unhealthy air days now
- 0 days/yr
- Unhealthy air days in 30 yrs
- 0 days/yr
Risk factors via First Street. Map © Google.
Why this score? — see what drove the C+ grade
The composite is a weighted blend of 9 inputs, each scored 0–100. Each bar is that input's sub-score; the figure is the points it added to the 100-point composite (weight × sub-score).
- Cash flow +20.6/30.0
- ARV discount +15.0/15.0
- DSCR +6.5/10.0
- Appreciation +5.5/10.0
- 1% rule +5.4/10.0
- Schools +3.5/10.0
- Livability +3.2/5.0
- Condition / age +2.8/5.0
- Rent growth +2.5/5.0
$159,900
🖨 Deal sheet (PDF) 📄 Offer letter ✓ Due diligence
Listing remarks MLS
Located in Wildwood Resort, this welcoming 3-bedroom, 2-bath home offers 1,730 sq ft on . 79 of an acre with a 3-car garage. The living room features vaulted ceilings with wood beams and a wall of windows that brings in beautiful natural light. Full of character, the kitchen includes original green appliances that add a fun vintage touch. A whole-home generator offers added peace of mind. Enjoy access to a 365-acre lake, 18-hole golf course, tennis courts, basketball court, sand volleyball court, and gated 24/7 security. Whether you’re looking for a full-time home or weekend getaway, this property offers space, charm, and the Wildwood lifestyle.
Key facts
- Access to lake
- Gated security
- Whole-home generator
Tags
Neighborhood map
What this means for you Summary
Snapshot
- This is a 3-bed/2.0-bath single-family listed at $160k. Condition is rated average.
Deal economics
- At list price, monthly cash flow is $212 ($3k/yr) — positive.
- The deal already cash-flows at list — no discount required.
- Meets the 1% rule at list price ($2k rent vs $160k).
- Recommended offer: $158k (1.5% below list) — sets the bar for market timing.
- Cap rate 7.9% vs local median 4.0% in Wildwood — top-decile yield for the area; either an underpriced asset or a hidden risk that comps aren't pricing in. Stress-test before assuming the spread holds.
Location & tenants
- Location reads 63/100 on livability (#855 in TX) — a middle-class / working-renter tenant base. Strengths: cost of living A+, housing A+, employment B+; Watch: crime C-, schools D-, amenities F.
- Warren ISD (rural): math 37% / reading 45% proficiency, ranked #378 of 826 in TX (top 46%) — families likely to look elsewhere, expect single-tenant / working-renter base with shorter leases.
- Market conditions: 45 active listings in the ZIP; 2 comparable units currently listed for rent nearby; 5 units permitted in Tyler County in 2024 (0 in 5+ unit buildings).
Forward outlook
- In year one you build about $3k of equity ($1k loan paydown + $2k appreciation (1.1% local appreciation)).
- Tyler County population projected at -12% by 2050 — secular population decline; favor cash flow + early exit over multi-decade hold.
- At projected returns (1.1% appreciation + 3.0% rent growth), your $45k cash investment doubles in ~7 years — after that, you're playing with house money.
Negotiation context
- It's been on market 27 days — a 2% lower offer ($158k) is reasonable based on typical stale-listing flexibility.
Risks & watch-outs
- Climate carrying-cost: severe wind risk, 99% chance of damaging wind over 30y; extreme-heat days projected 7→24/yr by 2055 (HVAC capex compounding) — expect insurance premiums to compound above CPI over the hold.
Questions for the listing agent
- Is there a deadline driving the sale (1031 exchange, divorce, estate, relocation)? That informs how much negotiation room exists.
- Schools are D-rated, which usually means shorter tenancies and higher turnover. Who's the typical renter profile here, and what's been the actual vacancy rate?
- What's the average days-on-market for RENTAL listings here right now (not sales)? A rising rental-DOM trend means longer vacancies and softer asking-rent achievability than the comps imply.
- What's the recent tenant-quality profile in this submarket — average credit score on applications, eviction rate, late-payment / NSF rate, and stable-employment percentage? A property-management company in the area should have these aggregated.
- How much new for-sale + rental construction is in the pipeline within 1–3 miles? Heavy new supply typically softens prices + rents 12–24 months out; constrained supply supports both.
Investment metrics
- 1% rule
- 1.04% ✓
- Cap rate
- 7.89%
- Cash-on-cash
- 5.69%
- DSCR
- 1.25
- GRM
- 8.0
CMA / ARV
- ARV (median comp)
- $192,587
- List price
- $159,900
- Delta
- -16.97%
- Verdict
- UNDERPRICED
- Comps
- 20 within 1.0 mi
Show comp detail 9 sales within ~0.75 mi
| Address | Dist | Beds/Ba | Sqft | Sold | Price | $/sf | Match |
|---|---|---|---|---|---|---|---|
| 706 E Wildwood | 0.35mi | 4/2.0 (+1) | 1,784 (+3%) | 9mo | $175,000 | $98 | 66 |
| 804 Camphor Cir | 0.17mi | 3/2.0 | 1,952 (+13%) | 8mo | $194,000 | $99 | 64 |
| 527 Cypress Bend Dr | 0.23mi | 3/2.0 | 1,543 (-11%) | 12mo | $195,000 | $126 | 61 |
| 303 Cypress Bnd | 0.42mi | 3/2.0 | 1,828 (+6%) | 16mo | $215,000 | $118 | 58 |
| 139 Lakewood Dr | 0.53mi | 3/2.0 | 1,742 (+1%) | 22mo | $333,000 | $191 | 56 |
| 204 Dogwood Ln | 0.40mi | 3/2.0 | 1,544 (-11%) | 11mo | $49,990 | $32 | 54 |
| 201 Spruce St | 0.69mi | 3/2.0 | 1,664 (-4%) | 10mo | $75,000 | $45 | 53 |
| 202 Cypress Bend Dr | 0.66mi | 3/1.0 | 1,644 (-5%) | 12mo | $125,000 | $76 | 47 |
| 105 Spruce St | 0.66mi | 2/2.0 (-1) | 1,502 (-13%) | 1mo | $199,000 | $132 | 42 |
Match score weights: distance 35% · size 25% · config 20% · recency 20%. Top-matched comps best support the ARV.
Projected returns pro-forma
1.05% appreciation · 3.0% rent growth · sell at horizon
- IRR
- 7.4%
- Equity multiple
- 1.38×
- Total profit
- $16,898
- Equity at exit
- $54,964
- IRR
- 11.5%
- Equity multiple
- 2.40×
- Total profit
- $62,701
- Equity at exit
- $73,334
Cash invested: $44,772 (down + closing). Projections, not guarantees.
Landlord ↔ Tenant lean methodology
- Overall (STATE)
- 87 Strongly Landlord-Friendly
- State Texas
- 87 Strongly Landlord-Friendly · R+5
- County
- — inherits STATE
- City
- — inherits STATE
ZIP-level market 77663
- Home prices YoY
- 1.0%
- Active inventory
- 45
- Price-to-rent
- 8.0×
Monthly cashflow live
- Estimated rent
- $1,668 medium interval (Pro) →
- Mortgage (P&I)
- −$839
- Tax est. 1.5%
- −$200 /mo · $2,398/yr
- Insurance
- −$67
- HOA
- −$0
- Vacancy / Maint / Mgmt
- −$350
- Net cashflow
- $212
Break-even live
Sensitivity live
| Price | -10% $323 | -5% $268 | +0% $212 | +5% $157 | +10% $102 |
|---|---|---|---|---|---|
| Rent | -10% $81 | -5% $147 | +0% $212 | +5% $278 | +10% $344 |
| Rate | -1.0pp $293 | -0.5pp $253 | base $212 | +0.5pp $171 | +1.0pp $129 |
UW: 25.0% down · 7.5% · 30yr · 1.5% tax · 5.0% vac · 8.0% maint · 8.0% mgmt
Financing live
Cash to close
- Down payment
- $39,975
- Closing costs
- $4,797
- Reserves months
- —
- Total cash needed
- —
Loan-product check · same deal, 3 products live
Conventional
25% down · 7.5% · 30yr
- Down + closing
- —
- Monthly P&I
- —
- Monthly cashflow
- —
- DSCR
- —
- Eligible?
- —
Personal DTI + credit; lowest rate.
DSCR
20% down · 8.5% · 30yr
- Down + closing
- —
- Monthly P&I
- —
- Monthly cashflow
- —
- DSCR
- —
- Eligible?
- —
No personal income docs; deal must DSCR.
Hard money
10% down · 12.0% · 12mo
- Down + closing
- —
- Monthly P&I
- —
- Monthly cashflow
- —
- DSCR
- —
- Eligible?
- —
Short-term bridge; refi at stabilization.
Rent comps 2 comps
| Address | Beds | Baths | Sqft | Rent | $/sqft | DOM | Units | Dist |
|---|---|---|---|---|---|---|---|---|
| 917 W Wildwood Dr Kountze, TX | 3.0 | 1.5 | 1125 | $1,615 | $1.44 | 13d | 1 | 0.20mi |
| 111 Spruce Ln Wildwood, TX | 3.0 | 2.0 | 2064 | $1,795 | $0.87 | 25d | 1 | 0.63mi |
Listing history 1 events
-
2026-04-23$159,900 Active 659-char remark
Show marketing remark (659 chars)
Located in Wildwood Resort, this welcoming 3-bedroom, 2-bath home offers 1,730 sq ft on . 79 of an acre with a 3-car garage. The living room features vaulted ceilings with wood beams and a wall of windows that brings in beautiful natural light. Full of character, the kitchen includes original green appliances that add a fun vintage touch. A whole-home generator offers added peace of mind. Enjoy access to a 365-acre lake, 18-hole golf course, tennis courts, basketball court, sand volleyball court, and gated 24/7 security. Whether you’re looking for a full-time home or weekend getaway, this property offers space, charm, and the Wildwood lifestyle.
ⓘ Source: listings_history table (triggers on properties + properties_extension) + one-shot
backfill from property_details.listing_events for pre-trigger history.
Climate risk First Street
- Flood 1/10 Low FEMA zone X (unshaded) · 0% chance over 30 yrs
- Wildfire 4/10 Moderate
- Heat 9/10 Extreme 7 d/yr ≥112°F today · 24 d/yr by 30 yrs out
- Wind 9/10 Extreme 99% chance of damaging wind over 30 yrs
- Air quality 1/10 Low 0 unhealthy d/yr today · 0 by 30 yrs out
Nearby sold comps map
Loading sold comps map…
Walkable amenities ~0.75 mi
Loading nearby amenities…
Taxation est. · year 1
- Rental income
- $20,012
- − Mortgage interest
- −$8,957
- − Property taxes
- −$2,398
- − Insurance
- −$800
- − Repairs & maintenance
- −$1,601
- − Management
- −$1,601
- − Depreciation
- −$4,652
- Taxable income
- $3
- Est. tax owed @ 24.0%
- −$1
- After-tax cash flow
- $2,548/yr
For passive investors: Depreciation is non-cash, so a rental often shows a tax loss while cash-flowing — sheltering income. Rental losses are passive: they offset passive income freely, and up to $25,000/yr can offset ordinary (W-2) income if you actively participate and your MAGI is under $100k (phasing out to $0 by $150k); unused losses carry forward. On sale, claimed depreciation is recaptured at up to 25%, and gains may owe capital-gains tax (a 1031 exchange can defer both). Figures are a year-1 estimate at your 24.0% rate — not tax advice; consult a CPA.
Condition & rehab AI · 12 photos
This 3-bedroom, 2-bath home in Wildwood Resort requires moderate renovations, including painting the exterior and replacing the carpet and kitchen appliances, to increase its resale and rental value.
Repairs flagged
- Minor Kitchen cabinets — Worn
- Minor Kitchen appliances — Original green appliances
Value-add opportunities
- Both Paint exterior — Enhances curb appeal and value
- Both Replace carpet — Improves comfort and value
- Both Replace kitchen cabinets and appliances — Modernizes and increases value
Renovation cost estimate screening
| Repair item | Severity | Est. cost |
|---|---|---|
| Kitchen cabinets · Worn | Minor | $500–3,000 |
| Kitchen appliances · Original green appliances | Minor | $500–3,000 |
| Total estimated repair cost · 2 items | $1,000–6,000 |
Value-add ROI direction
- Both Paint exterior — Enhances curb appeal and value ↑
- Both Replace carpet — Improves comfort and value ↑
- Both Replace kitchen cabinets and appliances — Modernizes and increases value ↑
ⓘ Cost ranges are severity-bucket heuristics (US national rule-of-thumb). Get contractor quotes + a written scope before underwriting a rehab budget.
Schools (NCES district)
- District
- Warren ISD
- NCES district ID
- 4844580
- Math proficiency
- 37% ▼ -7.00%
- Reading proficiency
- 45% ▲ 2.00%
- Median HH income
- $46,575
- Composite
- 34.97/100
- National rank
- #5059
- State rank
- #378 of 826 in TX
Livability — Wildwood
- Score
- 63/100
- State rank
- #855
- US rank
- #15381
Category grades
Schools grade is shown separately in the Schools card above.
Census & demographics
- Census place
- Wildwood, TX
- Population (ZIP)
- 309
Population outlook (Tyler County) Hauer SSP2
- Today (2025)
- 20,375 people
- By 2030
- 20,036 · -1.7%
- By 2040
- 19,150 · -6.0%
- By 2050
- 18,017 · -11.6%
- By 2075
- 15,300 · -24.9%
- By 2100
- 11,702 · -42.6%
Race, ethnicity, and origin ACS 2023
- Neighborhood character
- Predominantly White (96%)
- Race & ethnicity
- White 96% Hispanic / Latino 4% Two or more races 4%
- Common ancestry
- Lithuanian 9% Polish 9%
Political lean MEDSL · Tyler
- 2024 margin
- Solid R (+73.5) · D 13.0% · R 86.5%
- 2008→2024 swing
- -29.5pp toward R · 2008: -44.0pp · 2024: -73.5pp
- All cycles
- 2024: R+73.5 2020: R+70.3 2016: R+67.2 2012: R+55.5 2008: R+44.0
Not yet ingested
- Civics
- —
Market trends
- HPI YoY
- ▲ 1.05%
- Current HPI
- 103.9751
- Rent YoY
- —
- Metro
- —
- State GDP YoY
- ▲ 3.95%
- F500 in state
- 110
Industry mix (Fortune 500 HQ in TX)
| Industry | F500 HQs | Revenue |
|---|---|---|
| Energy | 16 | $1,198B |
|
||
| Technology | 5 | $198B |
|
||
| Engineering / Construction | 4 | $72B |
|
||
| Energy Services | 3 | $60B |
|
||
| Utilities | 3 | $41B |
|
||
| Healthcare | 2 | $330B |
|
||
Price history
1 event — show timeline
- 2026-04-23 Listed $159,900 BBOR
Cash-flow waterfall
monthlySold comps — $/sqft
last 12 mo · ≤1 miLoading sold comps…