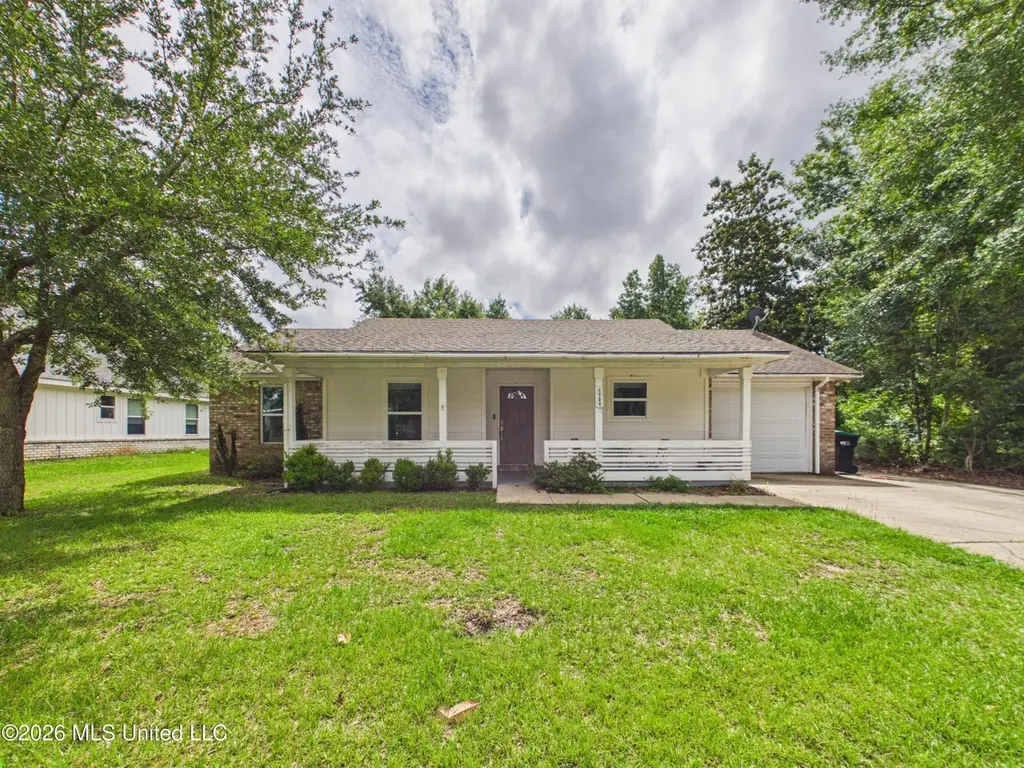
1704 S 1st St · Gulf Park Estates, MS
Flood risk 6/10 · Moderate
- FEMA flood zone
- X (shaded)
- Chance of flooding over 30 yrs
- 0.56%
- Est. flood insurance / yr
- $507 – $1,088
Fire risk 3/10 · Minor
- Est. fire insurance / yr
- $1,241 – $2,305
Heat risk 10/10 · Severe
- Hot days now (above 106°F)
- 7 days/yr
- Hot days in 30 yrs
- 23 days/yr
Wind risk 9/10 · Severe
- Chance of severe wind over 30 yrs
- 99.0%
Air-quality risk 2/10 · Minimal
- Unhealthy air days now
- 1 days/yr
- Unhealthy air days in 30 yrs
- 2 days/yr
Risk factors via First Street. Map © Google.
Why this score? — see what drove the C- grade
The composite is a weighted blend of 9 inputs, each scored 0–100. Each bar is that input's sub-score; the figure is the points it added to the 100-point composite (weight × sub-score).
- Cash flow +18.7/30.0
- ARV discount +8.5/15.0
- DSCR +5.9/10.0
- Schools +5.3/10.0
- 1% rule +4.5/10.0
- Livability +3.5/5.0
- Rent growth +2.8/5.0
- Condition / age +2.5/5.0
- Appreciation +0.0/10.0
$199,900
🖨 Deal sheet 📄 Offer letter ✓ Due diligence
Listing remarks MLS
Ready to move in! 3 bedrooms and 2 bathrooms. Fenced in back yard with screened in back porch!
Key facts
- Screened in porch
- Front porch
- Private yard
Tags
Property features AI
Finance
- HOA & community: Community offers boating, fishing, and nearby entertainment
Exterior
- Parking: Attached garage (1-car); Driveway; Paved parking; Garage faces front; RV access/parking; Total parking for 3 vehicles
- Utilities: Public sewer; Public/community water; Electricity available and connected; Sewer connected; Water connected
- Home design: Single-family house; One level; Brick veneer and siding construction; Slab foundation; Architectural shingle roof
- Construction: Brick veneer and siding; Slab foundation; Architectural shingle roof; Built in public-records year
- Exterior features: Porch (screened); Fenced backyard (wood); Few trees
Interior
- Kitchen: Built-in electric range; Dishwasher; Microwave
- Flooring: Carpet; Laminate
- Bathrooms: 2 full bathrooms
- Heating & cooling: Central electric heating; Central electric air conditioning
- Interior features: French doors; Screened porch; Private yard; Shed
- Laundry & utility: Laundry located inside and in garage
Neighborhood map
What this means for you Summary
Snapshot
- This is a 3-bed/2.0-bath single-family listed at $200k.
Deal economics
- At list price, monthly cash flow is $199 ($2k/yr) — positive.
- The deal already cash-flows at list — no discount required.
- To meet the 1% rule (rent ≥ 1% of price), the offer needs to be $190k (5.1% below list).
- Recommended offer: $190k (5.1% below list) — sets the bar for 1% rule.
- Cap rate 7.5% vs local median 5.2% in Gulf Park Estates — top-decile yield for the area; either an underpriced asset or a hidden risk that comps aren't pricing in. Stress-test before assuming the spread holds.
Location & tenants
- Location reads 70/100 on livability (#43 in MS) — a middle-class / working-renter tenant base. Strengths: crime A+, cost of living A+, housing A+; Watch: health & safety D+, amenities F, commute F.
- Ocean Springs School District (suburban): math 64% / reading 59% proficiency, ranked #1 of 130 in MS (top 1%) — acceptable for families but not a draw, mixed tenant base, ~2y average lease.
- Zoned schools: Ocean Springs Middle School (math 66% / reading 61%, grade B+, #3 of 179 statewide, top 2%, 967 students, 100% FRL); Ocean Springs High School (math 77% / reading 64%, grade B+, #1 of 197 statewide, top 0%, 1,899 students, 100% FRL) — zoned schools average 100% FRL vs 33% district-wide (67 pts higher); higher-poverty schools than district average — tighter screening recommended.
- Market conditions: Rents rising (+1.3%/yr); 714 active listings in the ZIP; 10 comparable units currently listed for rent nearby; rentals at typical pace (median 21d on market — plan ~3-4 weeks tenant-placement turnaround); 40% of comp listings sitting > 30 days — soft ceiling on asking rent; solid renter incomes; 516 units permitted in Jackson County in 2024 (6 in 5+ unit buildings).
Forward outlook
- Local home prices are declining (-3.0%/yr); year-one equity from $1k of loan paydown is wiped out by about $6k of value loss. Plan a longer hold.
Negotiation context
- It's been on market 45 days — a 3% lower offer ($194k) is reasonable based on typical stale-listing flexibility.
- 4 sale attempts since 12y ago with the ask held roughly flat each time — persistent listings suggest the price (not the market) is what's stuck; bring a comps-based counter.
Risks & watch-outs
- Climate carrying-cost: major flood risk; severe wind risk, 99% chance of damaging wind over 30y; extreme-heat days projected 7→23/yr by 2055 (HVAC capex compounding) — expect insurance premiums to compound above CPI over the hold.
Questions for the listing agent
- It's been on market 45 days. Have you received any prior offers? Is the seller open to a 5% concession, seller financing, or rate buy-down credit?
- Is there a deadline driving the sale (1031 exchange, divorce, estate, relocation)? That informs how much negotiation room exists.
- Schools are D-rated, which usually means shorter tenancies and higher turnover. Who's the typical renter profile here, and what's been the actual vacancy rate?
- What's the average days-on-market for RENTAL listings here right now (not sales)? A rising rental-DOM trend means longer vacancies and softer asking-rent achievability than the comps imply.
- What's the recent tenant-quality profile in this submarket — average credit score on applications, eviction rate, late-payment / NSF rate, and stable-employment percentage? A property-management company in the area should have these aggregated.
- How much new for-sale + rental construction is in the pipeline within 1–3 miles? Heavy new supply typically softens prices + rents 12–24 months out; constrained supply supports both.
Investment metrics
- 1% rule
- 0.95% ✗
- Cap rate
- 7.49%
- Cash-on-cash
- 4.27%
- DSCR
- 1.19
- GRM
- 8.8
CMA / ARV
- ARV (median comp)
- $204,555
- List price
- $199,900
- Delta
- -2.28%
- Verdict
- FAIR
- Comps
- 20 within 1.0 mi
Show comp detail 12 sales within ~0.75 mi
| Address | Dist | Beds/Ba | Sqft | Sold | Price | $/sf | Match |
|---|---|---|---|---|---|---|---|
| 9404 Meadowlark Ave | 0.21mi | 3/2.0 | 1,254 (+4%) | 10mo | $199,999 | $159 | 76 |
| 1801 Sandpiper Ave | 0.15mi | 3/2.0 | 1,218 (+0%) | 20mo | $194,900 | $160 | 76 |
| 9223 Warbler Ave | 0.12mi | 3/1.5 | 1,200 (-1%) | 22mo | $174,500 | $145 | 73 |
| 9109 Warbler Ave | 0.24mi | 3/2.0 | 1,120 (-8%) | 15mo | $175,500 | $157 | 64 |
| 9009 Point Aux Chenes Rd | 0.41mi | 2/2.0 (-1) | 1,240 (+2%) | 15mo | $237,900 | $192 | 59 |
| 2000 Deer St | 0.55mi | 3/2.0 | 1,336 (+10%) | 2mo | $210,000 | $157 | 56 |
| 1517 S 10th St | 0.69mi | 2/2.0 (-1) | 1,250 (+3%) | 8mo | $169,900 | $136 | 51 |
| 1425 S 9th St | 0.65mi | 3/2.0 | 1,261 (+4%) | 18mo | $199,000 | $158 | 48 |
| 1528 S 10th St | 0.71mi | 3/1.0 | 1,130 (-7%) | 10mo | $158,000 | $140 | 43 |
| 1633 S 9th St | 0.63mi | 2/2.0 (-1) | 1,036 (-14%) | 0mo | $170,000 | $164 | 41 |
| 1497 S 10th St | 0.72mi | 3/2.0 | 1,320 (+9%) | 15mo | $189,900 | $144 | 39 |
| 1501 S 10th St | 0.72mi | 3/2.0 | 1,320 (+9%) | 15mo | $189,900 | $144 | 39 |
Match score weights: distance 35% · size 25% · config 20% · recency 20%. Top-matched comps best support the ARV.
Projected returns pro-forma
-3.0% appreciation · 1.31% rent growth · sell at horizon
- IRR
- -11.5%
- Equity multiple
- 0.59×
- Total profit
- $-22,896
- Equity at exit
- $29,806
- IRR
- -4.8%
- Equity multiple
- 0.71×
- Total profit
- $-16,265
- Equity at exit
- $17,284
Cash invested: $55,972 (down + closing). Projections, not guarantees.
Landlord ↔ Tenant lean methodology
- Overall (STATE)
- 90 Strongly Landlord-Friendly
- State Mississippi
- 90 Strongly Landlord-Friendly · R+11
- County
- — inherits STATE
- City
- — inherits STATE
ZIP-level market 39564
- Home prices YoY
- -26.8%
- Rents YoY
- 1.3%
- Active inventory
- 714
- Price-to-rent
- 8.8×
Monthly cashflow live
- Estimated rent
- $1,896 high interval (Pro) →
- Mortgage (P&I)
- −$1,048
- Tax from tax record
- −$167 /mo · $2,005/yr
- Insurance
- −$83
- HOA
- −$0
- Vacancy / Maint / Mgmt
- −$398
- Net cashflow
- $199
Break-even live
UW: 25.0% down · 7.5% · 30yr · 1.5% tax · 5.0% vac · 8.0% maint · 8.0% mgmt
Financing live
Cash to close
- Down payment
- $49,975
- Closing costs
- $5,997
- Reserves months
- —
- Total cash needed
- —
Loan-product check · same deal, 3 products live
Conventional
25% down · 7.5% · 30yr
- Down + closing
- —
- Monthly P&I
- —
- Monthly cashflow
- —
- DSCR
- —
- Eligible?
- —
Personal DTI + credit; lowest rate.
DSCR
20% down · 8.5% · 30yr
- Down + closing
- —
- Monthly P&I
- —
- Monthly cashflow
- —
- DSCR
- —
- Eligible?
- —
No personal income docs; deal must DSCR.
Hard money
10% down · 12.0% · 12mo
- Down + closing
- —
- Monthly P&I
- —
- Monthly cashflow
- —
- DSCR
- —
- Eligible?
- —
Short-term bridge; refi at stabilization.
Rent comps 10 comps
| Address | Beds | Baths | Sqft | Rent | $/sqft | DOM | Units | Dist |
|---|---|---|---|---|---|---|---|---|
| 9200 Pointe Aux Chenes Rd Unit 1365709P Ocean Springs, MS | 3.0 | 2.0 | 1420 | $5,979 | $4.21 | 13d | 1 | 0.36mi |
| 1508 Beachview Dr Ocean Springs, MS | 3.0 | 2.0 | 1428 | $1,650 | $1.16 | 13d | 1 | 0.41mi |
| 1517 Porpoise Dr Ocean Springs, MS | 3.0 | 2.0 | 1494 | $2,250 | $1.51 | 13d | 1 | 0.59mi |
| 8712 W Simmons Bayou Dr Ocean Springs, MS | 2.0 | 2.0 | 1100 | $1,900 | $1.73 | 43d | 1 | 0.90mi |
| 2421 Beachview Dr Unit F16 Ocean Springs, MS | 2.0 | 2.0 | 875 | $2,200 | $2.51 | 21d | 1 | 0.94mi |
| 2421 Beachview Dr Ocean Springs, MS | 2.0 | 2.0 | 875 | $2,000 | $2.29 | 21d | 1 | 0.94mi |
| 2421 Beachview Dr Ocean Springs, MS | 2.0 | 2.0 | 874 | $2,150 | $2.46 | 43d | 2 | 0.96mi |
| 8700 Spring Ave Ocean Springs, MS | 3.0 | 2.0 | 1087 | $1,050 | $0.97 | 21d | 1 | 1.32mi |
| 8700 Spring Ave Ocean Springs, MS | 3.0 | 2.0 | 1087 | $1,050 | $0.97 | 44d | 1 | 1.32mi |
| 2616 N 15th St Ocean Springs, MS | 2.0 | 1.0 | 720 | $1,200 | $1.67 | 43d | 1 | 1.33mi |
Listing history 21 events
-
2026-06-18days on market $199,900 Active 45 DOM
-
2026-06-17days on market $199,900 Active 44 DOM
-
2026-06-16days on market $199,900 Active 43 DOM
-
2026-06-15days on market $199,900 Active 42 DOM
-
2026-06-14days on market $199,900 Active 40 DOM
-
2026-06-13days on market $199,900 Active 39 DOM
-
2026-06-10days on market $199,900 Active 37 DOM
-
2026-06-09days on market $199,900 Active 36 DOM
-
2026-06-08days on market $199,900 Active 35 DOM
-
2026-06-07days on market $199,900 Active 34 DOM
-
2026-06-02days on market $199,900 Active 29 DOM
-
2026-06-01days on market $199,900 Active 28 DOM
-
2026-05-31days on market $199,900 Active 27 DOM
-
2026-05-30days on market $199,900 Active 26 DOM
-
2026-05-04$207,500 Active 942-char remark
-
2021-09-15historical
-
2020-01-24soldstatus
Show marketing remark (94 chars)
Ready to move in! 3 bedrooms and 2 bathrooms. Fenced in back yard with screened in back porch!
-
2019-12-04$107,000
Show marketing remark (94 chars)
Ready to move in! 3 bedrooms and 2 bathrooms. Fenced in back yard with screened in back porch!
-
2016-10-14soldstatus
-
2016-08-22$49,900
-
2014-10-27$99,900
ⓘ Source: listings_history table (triggers on properties + properties_extension) + one-shot
backfill from property_details.listing_events for pre-trigger history.
Tax reassessment forecast MS · Resets to sale price
- Current annual tax
- $2,005 · $167/mo
- Projected year-2 tax
- $2,005 · $167/mo
- Expected delta
- $0/yr ($0/mo · 0.0%)
ⓘ Screening estimate from a state-policy table — verify with the county assessor before closing.
Climate risk First Street
- Flood 6/10 Major FEMA zone X (shaded) · 56% chance over 30 yrs
- Wildfire 3/10 Moderate
- Heat 10/10 Extreme 7 d/yr ≥106°F today · 23 d/yr by 30 yrs out
- Wind 9/10 Extreme 99% chance of damaging wind over 30 yrs
- Air quality 2/10 Low 1 unhealthy d/yr today · 2 by 30 yrs out
Nearby sold comps map
Loading sold comps map…
Walkable amenities ~0.75 mi
Loading nearby amenities…
Taxation est. · year 1
- Rental income
- $22,753
- − Mortgage interest
- −$11,198
- − Property taxes
- −$2,005
- − Insurance
- −$1,000
- − Repairs & maintenance
- −$1,820
- − Management
- −$1,820
- − Depreciation
- −$5,815
- Taxable loss
- −$905
- Est. tax savings @ 24.0%
- +$217
- After-tax cash flow
- $2,608/yr
For passive investors: Depreciation is non-cash, so a rental often shows a tax loss while cash-flowing — sheltering income. Rental losses are passive: they offset passive income freely, and up to $25,000/yr can offset ordinary (W-2) income if you actively participate and your MAGI is under $100k (phasing out to $0 by $150k); unused losses carry forward. On sale, claimed depreciation is recaptured at up to 25%, and gains may owe capital-gains tax (a 1031 exchange can defer both). Figures are a year-1 estimate at your 24.0% rate — not tax advice; consult a CPA.
Schools (NCES district)
- District
- Ocean Springs School District
- NCES district ID
- 2803360
- Math proficiency
- 64% ▼ -3.00%
- Reading proficiency
- 59% ▲ 1.00%
- Median HH income
- $60,485
- Composite
- 53.35/100
- National rank
- #1477
- State rank
- #1 of 130 in MS
Livability — Gulf Park Estates
- Score
- 70/100
- State rank
- #43
- US rank
- #7955
Category grades
Schools grade is shown separately in the Schools card above.
Census & demographics
- Census place
- Gulf Park Estates, MS
- County
- Jackson County · 82,196 people
- Metro
- Gulfport-Biloxi, MS
- Population (ZIP)
- 43,240
- Household income
- $78,596
- Rent vs Own
- Severe rent burden
- 734.0
Population outlook (Jackson County) Hauer SSP2
- Today (2025)
- 146,926 people
- By 2030
- 148,442 · +1.0%
- By 2040
- 149,631 · +1.8%
- By 2050
- 148,723 · +1.2%
- By 2075
- 147,845 · +0.6%
- By 2100
- 144,510 · -1.6%
Race, ethnicity, and origin ACS 2023
- Neighborhood character
- Predominantly White (74%)
- Race & ethnicity
- White 74% Black 10% Hispanic / Latino 8% Two or more races 7% Asian 4%
- Hispanic origin (detail)
- Mexican 3% Puerto Rican 2%
- Common ancestry
- Lithuanian 5% Slovak 4% Romanian 2%
- Foreign-born
- 5% · Canada, South Korea, Vietnam
- Languages at home
- 93% English-only · Spanish 3% Vietnamese 2% Tagalog/Filipino 1%
Political lean MEDSL · Jackson
- 2024 margin
- Solid R (+39.9) · D 29.5% · R 69.4% · Other 1.1%
- 2008→2024 swing
- -6.4pp toward R · 2008: -33.5pp · 2024: -39.9pp
- All cycles
- 2024: R+39.9 2020: R+34.6 2016: R+39.9 2012: R+36.1 2008: R+33.5
Not yet ingested
- Civics
- —
Market trends
- HPI YoY
- ▼ -74.77%
- Current HPI
- 204.2244
- Rent YoY
- ▲ 1.31%
- Metro
- Gulfport-Biloxi, MS
- State GDP YoY
- —
- F500 in state
- 0
Price history
+100.1% since first listed8 events — show timeline
- 2026-05-28 Price Changed $199,900 MLSU
- 2026-05-04 Listed $207,500 MLSU
- 2021-09-15 Listing Removed — MLSU
- 2020-01-24 Sold (MLS) — MLSU
- 2019-12-04 Listed $107,000 MLSU
- 2016-10-14 Sold (MLS) — MLSU
- 2016-08-22 Listed $49,900 MLSU
- 2014-10-27 Listed $99,900 MLSU
Property tax history
+12.6%/yrLatest (2025): $2,005 · +8.6% YoY. Source: county tax records.
Cash-flow waterfall
monthlySold comps — $/sqft
last 12 mo · ≤1 miLoading sold comps…