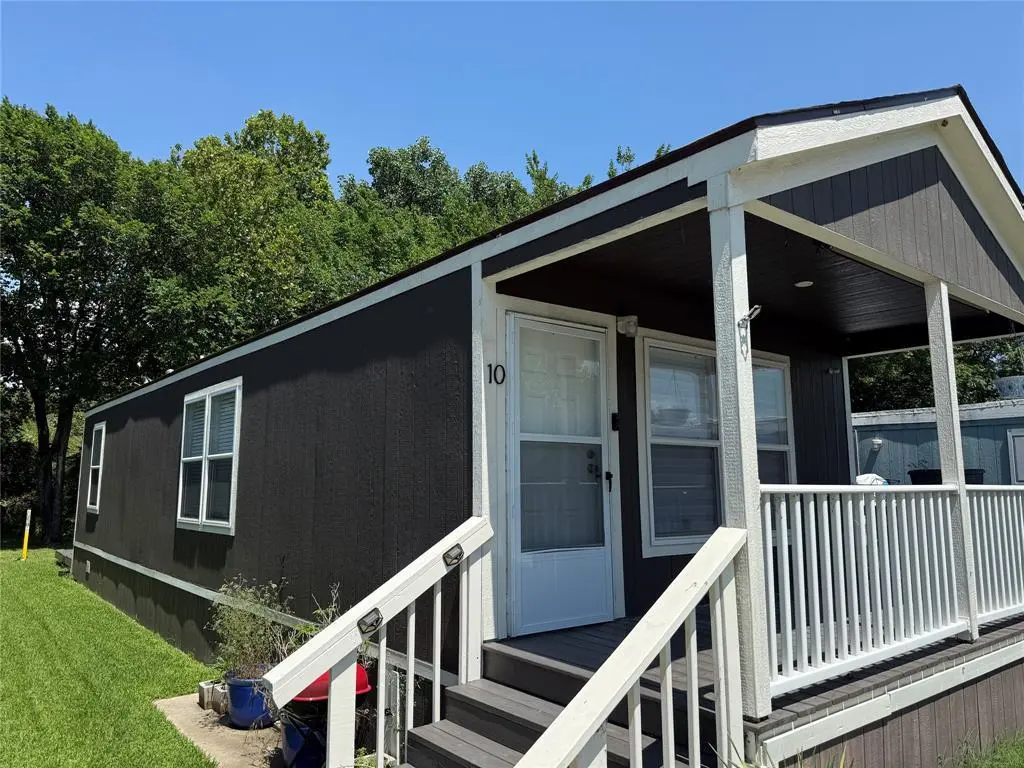
3728 Marina Dr #10 · Lake Worth, TX
Flood risk 6/10 · Moderate
- FEMA flood zone
- X (unshaded)
- Chance of flooding over 30 yrs
- 0.5%
- Est. flood insurance / yr
- $507 – $1,088
Fire risk 2/10 · Minimal
- Est. fire insurance / yr
- $1,222 – $2,270
Heat risk 7/10 · Major
- Hot days now (above 109°F)
- 7 days/yr
- Hot days in 30 yrs
- 23 days/yr
Wind risk 4/10 · Minor
- Chance of severe wind over 30 yrs
- 21.0%
Air-quality risk 3/10 · Minor
- Unhealthy air days now
- 3 days/yr
- Unhealthy air days in 30 yrs
- 4 days/yr
Risk factors via First Street. Map © Google.
Why this score? — see what drove the B- grade
The composite is a weighted blend of 9 inputs, each scored 0–100. Each bar is that input's sub-score; the figure is the points it added to the 100-point composite (weight × sub-score).
- Cash flow +30.0/30.0
- 1% rule +10.0/10.0
- DSCR +10.0/10.0
- ARV discount +7.5/15.0
- Condition / age +4.0/5.0
- Livability +3.6/5.0
- Rent growth +2.6/5.0
- Schools +1.4/10.0
- Appreciation +0.0/10.0
$49,999
🖨 Deal sheet 📄 Offer letter ✓ Due diligence
Listing remarks
Built in 2020 and offered fully furnished, this move in ready 644 sq. ft. home offers modern, low maintenance living in a desirable 55+ Lake Worth community. The open concept layout features a spacious living and kitchen area, high efficiency insulation, double pane windows, and central HVAC. All furniture and appliances, including the refrigerator, stove, microwave, washer, and dryer, convey with the sale. Enjoy a covered front porch, professional skirting, and a dedicated storage shed. Statement of Ownership and Tax Clearance are in hand for a smooth transfer process. Sale is for the home only; lot is leased and buyer must be approved by park management prior to closing.
Key facts
- Covered front porch
- Central hvac
- Double pane windows
Tags
Property features AI
Finance
- Other: Senior community
- Financial info: Treat as clear loan type; No second mortgage; Listing terms: Cash
- HOA & community: No association (Association type: None); Association covers maintenance of grounds
Exterior
- Parking: Off-street parking; No garage or covered/carport spaces
- Security: Smoke detector(s); Other security features
- Utilities: City sewer; Municipal utility district not present
- Home design: Manufactured home; One level; Residential property; Not attached; Accessory unit not present
- Construction: Built in 2020; New construction - complete
- Exterior features: Located on Lake Worth; Zero lot; Property is on a one way road (park in front of home)
Interior
- Kitchen: Dishwasher; Disposal; Electric oven; Microwave; Refrigerator; Pantry
- Bedrooms: 1 bedroom (Primary bedroom on level 1)
- Bathrooms: 1 full bathroom
- Interior features: Open floorplan; Pantry; Primary bedroom on level 1; Living room on level 1; Kitchen on level 1; Bathroom on level 1; 4 total rooms; 1 living area; 1 dining area
- Laundry & utility: Washer hookup; Washer; Dryer; Other laundry/utility features
Neighborhood map
What this means for you Summary
Snapshot
- This is a 1-bed/1.0-bath manufactured listed at $50k. Condition is rated good.
Deal economics
- At list price, monthly cash flow is $620 ($7k/yr) — positive.
- The deal already cash-flows at list — no discount required.
- Meets the 1% rule at list price ($1k rent vs $50k).
- Cap rate 21.2% vs local median 5.3% in Lake Worth — top-decile yield for the area; either an underpriced asset or a hidden risk that comps aren't pricing in. Stress-test before assuming the spread holds.
Location & tenants
- Location reads 72/100 on livability (#269 in TX) — a middle-class / working-renter tenant base. Strengths: cost of living A+, housing A+, health & safety A+; Watch: schools F, crime F, commute F.
- Lake Worth ISD (suburban): math 12% / reading 22% proficiency, ranked #801 of 826 in TX (top 97%) — low school quality limits family demand, transient renter base, plan for 1-2y turnover; 73% free/reduced lunch — lower-income household profile, screen leases tightly.
- Market conditions: Rents flat; 157 active listings in the ZIP; 1 comparable units currently listed for rent nearby; 18,938 units permitted in Tarrant County in 2024 (8,336 in 5+ unit buildings).
Forward outlook
- Local home prices are declining (-3.0%/yr); year-one equity from $345 of loan paydown is wiped out by about $2k of value loss. Plan a longer hold.
- Tarrant County population projected at +41% by 2050 — long-run rental-demand tailwind backs the buy-and-hold thesis.
- At projected returns (-3.0% appreciation + 0.5% rent growth), your $14k cash investment doubles in ~3 years — after that, you're playing with house money.
Negotiation context
- Only 9 days on market — expect competitive offers; lowballing is unlikely to land.
Risks & watch-outs
- Climate carrying-cost: major flood risk; extreme-heat days projected 7→23/yr by 2055 (HVAC capex compounding) — expect insurance premiums to compound above CPI over the hold.
Questions for the listing agent
- Is there a deadline driving the sale (1031 exchange, divorce, estate, relocation)? That informs how much negotiation room exists.
- Schools are F-rated, which usually means shorter tenancies and higher turnover. Who's the typical renter profile here, and what's been the actual vacancy rate?
- Crime grade is F in this area — have there been break-ins, vandalism, or insurance claims at this property in the last 3 years? What carrier currently insures it and at what premium?
- What's the average days-on-market for RENTAL listings here right now (not sales)? A rising rental-DOM trend means longer vacancies and softer asking-rent achievability than the comps imply.
- What's the recent tenant-quality profile in this submarket — average credit score on applications, eviction rate, late-payment / NSF rate, and stable-employment percentage? A property-management company in the area should have these aggregated.
- How much new for-sale + rental construction is in the pipeline within 1–3 miles? Heavy new supply typically softens prices + rents 12–24 months out; constrained supply supports both.
Investment metrics
- 1% rule
- 2.45% ✓
- Cap rate
- 21.18%
- Cash-on-cash
- 53.17%
- DSCR
- 3.37
- GRM
- 3.4
CMA / ARV
No comps found within radius.
Projected returns pro-forma
-3.0% appreciation · 0.48% rent growth · sell at horizon
- IRR
- 48.4%
- Equity multiple
- 3.03×
- Total profit
- $28,403
- Equity at exit
- $7,455
- IRR
- 52.9%
- Equity multiple
- 5.56×
- Total profit
- $63,886
- Equity at exit
- $4,323
Cash invested: $14,000 (down + closing). Projections, not guarantees.
Landlord ↔ Tenant lean methodology
- Overall (STATE)
- 87 Strongly Landlord-Friendly
- State Texas
- 87 Strongly Landlord-Friendly · R+5
- County
- — inherits STATE
- City
- — inherits STATE
ZIP-level market 76135
- Home prices YoY
- -17.3%
- Rents YoY
- 0.5%
- Active inventory
- 157
- Price-to-rent
- 3.4×
Monthly cashflow live
- Estimated rent
- $1,223 medium interval (Pro) →
- Mortgage (P&I)
- −$262
- Tax est. 1.5%
- −$62 /mo · $750/yr
- Insurance
- −$21
- HOA
- −$0
- Vacancy / Maint / Mgmt
- −$257
- Net cashflow
- $620
Break-even live
UW: 25.0% down · 7.5% · 30yr · 1.5% tax · 5.0% vac · 8.0% maint · 8.0% mgmt
Financing live
Cash to close
- Down payment
- $12,500
- Closing costs
- $1,500
- Reserves months
- —
- Total cash needed
- —
Loan-product check · same deal, 3 products live
Conventional
25% down · 7.5% · 30yr
- Down + closing
- —
- Monthly P&I
- —
- Monthly cashflow
- —
- DSCR
- —
- Eligible?
- —
Personal DTI + credit; lowest rate.
DSCR
20% down · 8.5% · 30yr
- Down + closing
- —
- Monthly P&I
- —
- Monthly cashflow
- —
- DSCR
- —
- Eligible?
- —
No personal income docs; deal must DSCR.
Hard money
10% down · 12.0% · 12mo
- Down + closing
- —
- Monthly P&I
- —
- Monthly cashflow
- —
- DSCR
- —
- Eligible?
- —
Short-term bridge; refi at stabilization.
Rent comps 1 comps
| Address | Beds | Baths | Sqft | Rent | $/sqft | DOM | Units | Dist |
|---|---|---|---|---|---|---|---|---|
| 6555 Shady Oaks Manor Dr Fort Worth, TX | 1.0–2.0 | 1.0–2.0 | 689 | $992 | $1.44 | 3d | 18 | 1.43mi |
Listing history 8 events
-
2026-06-18days on market $49,999 Active 9 DOM
-
2026-06-17days on market $49,999 Active 8 DOM
-
2026-06-16days on market $49,999 Active 7 DOM
-
2026-06-15days on market $49,999 Active 6 DOM
-
2026-06-13days on market $49,999 Active 4 DOM
-
2026-06-13days on market $49,999 Active 3 DOM
-
2026-06-10remarks 681-char remark
-
2026-06-10$49,999 Active 1 DOM
ⓘ Source: listings_history table (triggers on properties + properties_extension) + one-shot
backfill from property_details.listing_events for pre-trigger history.
Climate risk First Street
- Flood 6/10 Major FEMA zone X (unshaded) · 50% chance over 30 yrs
- Wildfire 2/10 Low
- Heat 7/10 Severe 7 d/yr ≥109°F today · 23 d/yr by 30 yrs out
- Wind 4/10 Moderate 21% chance of damaging wind over 30 yrs
- Air quality 3/10 Moderate 3 unhealthy d/yr today · 4 by 30 yrs out
Nearby sold comps map
Loading sold comps map…
Walkable amenities ~0.75 mi
Loading nearby amenities…
Taxation est. · year 1
- Rental income
- $14,672
- − Mortgage interest
- −$2,801
- − Property taxes
- −$750
- − Insurance
- −$250
- − Repairs & maintenance
- −$1,174
- − Management
- −$1,174
- − Depreciation
- −$1,455
- Taxable income
- $7,069
- Est. tax owed @ 24.0%
- −$1,697
- After-tax cash flow
- $5,748/yr
For passive investors: Depreciation is non-cash, so a rental often shows a tax loss while cash-flowing — sheltering income. Rental losses are passive: they offset passive income freely, and up to $25,000/yr can offset ordinary (W-2) income if you actively participate and your MAGI is under $100k (phasing out to $0 by $150k); unused losses carry forward. On sale, claimed depreciation is recaptured at up to 25%, and gains may owe capital-gains tax (a 1031 exchange can defer both). Figures are a year-1 estimate at your 24.0% rate — not tax advice; consult a CPA.
Condition & rehab AI · 6 photos
This move-in ready 2020 manufactured home offers a modern, low-maintenance living experience in a desirable 55+ community. The home is fully furnished and ready for immediate occupancy.
Value-add opportunities
- Both Paint exterior siding — Enhances curb appeal and value
- Both Replace carpet with hardwood flooring — Improves aesthetics and is easier to maintain
- Both Install smart home devices — Enhances convenience and adds modern appeal
Renovation cost estimate screening
Value-add ROI direction
- Both Paint exterior siding — Enhances curb appeal and value ↑
- Both Replace carpet with hardwood flooring — Improves aesthetics and is easier to maintain ↑
- Both Install smart home devices — Enhances convenience and adds modern appeal ↑
ⓘ Cost ranges are severity-bucket heuristics (US national rule-of-thumb). Get contractor quotes + a written scope before underwriting a rehab budget.
Schools (NCES district)
- District
- Lake Worth ISD
- NCES district ID
- 4826490
- Math proficiency
- 12% ▼ -13.00%
- Reading proficiency
- 22% ▼ -5.00%
- Median HH income
- $39,451
- Composite
- 14.38/100
- National rank
- #9436
- State rank
- #801 of 826 in TX
Livability — Lake Worth
- Score
- 72/100
- State rank
- #269
- US rank
- #6300
Category grades
Schools grade is shown separately in the Schools card above.
Census & demographics
- Census place
- Lake Worth, TX
- County
- Tarrant County · 2,033,669 people
- Metro
- Dallas-Fort Worth-Arlington, TX
- Population (ZIP)
- 19,445
- Household income
- $74,621
- Rent vs Own
- Severe rent burden
- 798.0
Population outlook (Tarrant County) Hauer SSP2
- Today (2025)
- 2,380,417 people
- By 2030
- 2,578,900 · +8.3%
- By 2040
- 2,974,995 · +25.0%
- By 2050
- 3,350,489 · +40.8%
- By 2075
- 4,216,909 · +77.2%
- By 2100
- 4,741,527 · +99.2%
Race, ethnicity, and origin ACS 2023
- Neighborhood character
- Majority White (63%)
- Race & ethnicity
- White 63% Hispanic / Latino 26% Two or more races 11% Black 8%
- Hispanic origin (detail)
- Mexican 22%
- Common ancestry
- Italian 2% Romanian 2% Russian 2%
- Foreign-born
- 7% · Canada, Jamaica
- Languages at home
- 80% English-only · Spanish 19% Russian/Polish/Slavic 1%
Political lean MEDSL · Tarrant
- 2024 margin
- Lean R (+5.1) · D 46.7% · R 51.9% · Other 1.4%
- 2008→2024 swing
- +6.6pp toward D · 2008: -11.7pp · 2024: -5.1pp
- All cycles
- 2024: R+5.1 2020: D+0.2 2016: R+8.7 2012: R+15.7 2008: R+11.7
Not yet ingested
- Civics
- —
Market trends
- HPI YoY
- ▼ -63.93%
- Current HPI
- 305.0929
- Rent YoY
- ▲ 0.48%
- Metro
- Dallas-Fort Worth-Arlington, TX
- State GDP YoY
- ▲ 3.95%
- F500 in state
- 110
Industry mix (Fortune 500 HQ in TX)
| Industry | F500 HQs | Revenue |
|---|---|---|
| Energy | 16 | $1,198B |
|
||
| Technology | 5 | $198B |
|
||
| Engineering / Construction | 4 | $72B |
|
||
| Energy Services | 3 | $60B |
|
||
| Utilities | 3 | $41B |
|
||
| Healthcare | 2 | $330B |
|
||
Price history
1 event — show timeline
- 2026-06-04 Listed $49,999 NTREIS
Cash-flow waterfall
monthlySold comps — $/sqft
last 12 mo · ≤1 miLoading sold comps…