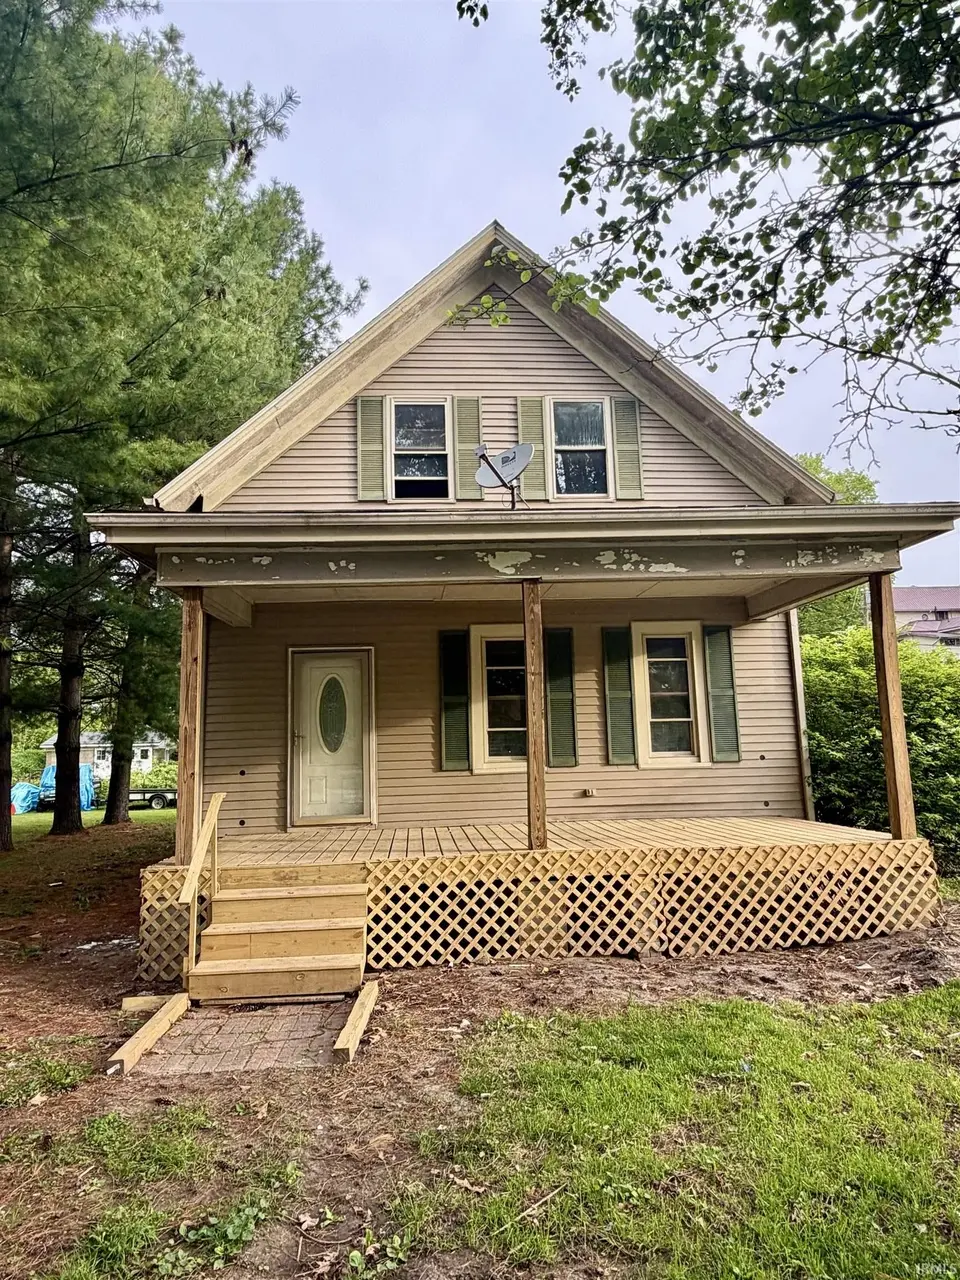
407 Water St · Delphi, IN
Flood risk 9/10 · Severe
- FEMA flood zone
- A
- Chance of flooding over 30 yrs
- 0.99%
- Est. flood insurance / yr
- $1,009 – $1,996
Fire risk 1/10 · Minimal
- Est. fire insurance / yr
- $717 – $1,331
Heat risk 3/10 · Minor
- Hot days now (above 102°F)
- 7 days/yr
- Hot days in 30 yrs
- 17 days/yr
Wind risk 2/10 · Minimal
- Chance of severe wind over 30 yrs
- —
Air-quality risk 2/10 · Minimal
- Unhealthy air days now
- 1 days/yr
- Unhealthy air days in 30 yrs
- 2 days/yr
Risk factors via First Street. Map © Google.
Why this score? — see what drove the B- grade
The composite is a weighted blend of 9 inputs, each scored 0–100. Each bar is that input's sub-score; the figure is the points it added to the 100-point composite (weight × sub-score).
- Cash flow +28.0/30.0
- DSCR +10.0/10.0
- ARV discount +7.8/15.0
- 1% rule +7.7/10.0
- Livability +3.6/5.0
- Schools +3.3/10.0
- Rent growth +2.5/5.0
- Condition / age +2.5/5.0
- Appreciation +0.0/10.0
$155,900
🖨 Deal sheet (PDF) 📄 Offer letter ✓ Due diligence
Listing remarks MLS
Nicely remodeled home for a great price! The downstairs offers all newer floors and a newer kitchen. This 3 bed 1.5 bath home has a great layout. Don't miss this Great buy!!
Key facts
- Covered porch
- Open layout
- Back deck
Tags
Property features AI
Finance
- Other: Directions: Please use GPS
- HOA & community: No association amenities
Exterior
- Parking: Driveway
- Security: Smoke detectors
- Utilities: Public water; Public sewer
- Home design: Single-family site-built home; One story
- Construction: Vinyl and wood siding; Shingle roof; Block foundation; Built as site-built construction
- Exterior features: Deck; Covered porch; Porch; Level lot
Interior
- Kitchen: Dishwasher; Microwave; Refrigerator; Electric oven; Electric range
- Bedrooms: Total rooms: 7
- Flooring: Laminate flooring
- Bathrooms: 1 full bathroom; 1 half bathroom; Main level bathroom present
- Heating & cooling: Natural gas forced-air heating; Central air conditioning; Ceiling fans
- Interior features: Eat-in kitchen; Open floorplan; Laminate counters; One fireplace (no special features listed)
- Laundry & utility: Washer and dryer included; Laundry on main level
Neighborhood map
What this means for you Summary
Snapshot
- This is a 3-bed/1.5-bath single-family listed at $156k.
Deal economics
- At list price, monthly cash flow is $362 ($4k/yr) — positive.
- The deal already cash-flows at list — no discount required.
- Meets the 1% rule at list price ($2k rent vs $156k).
- Recommended offer: $151k (3.0% below list) — sets the bar for market timing.
- Cap rate 10.0% vs local median 5.0% in Delphi — top-decile yield for the area; either an underpriced asset or a hidden risk that comps aren't pricing in. Stress-test before assuming the spread holds.
Location & tenants
- Location reads 72/100 on livability (#112 in IN) — a middle-class / working-renter tenant base. Strengths: crime A+, cost of living A+, housing A+; Watch: employment D+, amenities F, commute F.
- Delphi Community School Corporation (town): math 36% / reading 41% proficiency, ranked #160 of 301 in IN (top 53%) — families likely to look elsewhere, expect single-tenant / working-renter base with shorter leases.
- Zoned schools: Delphi Community Elementary School (math 37% / reading 31%, grade F, #627 of 994 statewide, top 63%, 623 students, 54% FRL); Delphi Community Middle School (math 31% / reading 43%, grade F, #152 of 330 statewide, top 47%, 333 students, 49% FRL); Delphi Community High School (math 47% / reading 67%, grade C, #64 of 369 statewide, top 18%, 405 students, 46% FRL).
- Market conditions: 46 active listings in the ZIP; 3 comparable units currently listed for rent nearby; rentals at typical pace (median 16d on market — plan ~3-4 weeks tenant-placement turnaround); 32 units permitted in Carroll County in 2024 (0 in 5+ unit buildings).
Forward outlook
- Local home prices are declining (-3.0%/yr); year-one equity from $1k of loan paydown is wiped out by about $5k of value loss. Plan a longer hold.
- Carroll County population projected at -14% by 2050 — secular population decline; favor cash flow + early exit over multi-decade hold.
Negotiation context
- It's been on market 54 days — a 3% lower offer ($151k) is reasonable based on typical stale-listing flexibility.
- 3 sale attempts since 9y ago with the ask held roughly flat each time — persistent listings suggest the price (not the market) is what's stuck; bring a comps-based counter.
- Current owner paid $40k; list at $156k implies a 290% gain — meaningful room to come down on a strong offer.
Risks & watch-outs
- Watch-outs: flood insurance adds $125/mo; built in 1948 — expect roof / HVAC / electrical / plumbing capex.
- Climate carrying-cost: in FEMA flood zone A (mandatory federal flood insurance) — expect insurance premiums to compound above CPI over the hold.
Questions for the listing agent
- It's been on market 54 days. Have you received any prior offers? Is the seller open to a 3% concession, seller financing, or rate buy-down credit?
- Built in 1948 — when were the roof, HVAC, electrical panel, plumbing, and water heater last replaced?
- What's the actual annual flood-insurance premium (NFIP or private), and is the property in a SFHA with mandatory coverage?
- Is there a deadline driving the sale (1031 exchange, divorce, estate, relocation)? That informs how much negotiation room exists.
- Schools are D-rated, which usually means shorter tenancies and higher turnover. Who's the typical renter profile here, and what's been the actual vacancy rate?
- What's the average days-on-market for RENTAL listings here right now (not sales)? A rising rental-DOM trend means longer vacancies and softer asking-rent achievability than the comps imply.
- What's the recent tenant-quality profile in this submarket — average credit score on applications, eviction rate, late-payment / NSF rate, and stable-employment percentage? A property-management company in the area should have these aggregated.
- How much new for-sale + rental construction is in the pipeline within 1–3 miles? Heavy new supply typically softens prices + rents 12–24 months out; constrained supply supports both.
Investment metrics
- 1% rule
- 1.27% ✓
- Cap rate
- 10.04%
- Cash-on-cash
- 13.40%
- DSCR
- 1.60
- GRM
- 6.6
CMA / ARV
- ARV (median comp)
- $157,031
- List price
- $155,900
- Delta
- -0.72%
- Verdict
- FAIR
- Comps
- 20 within 1.0 mi
Show comp detail 12 sales within ~0.75 mi
| Address | Dist | Beds/Ba | Sqft | Sold | Price | $/sf | Match |
|---|---|---|---|---|---|---|---|
| 424 W Summit St | 0.37mi | 4/2.0 (+1) | 1,741 (+5%) | 3mo | $140,000 | $80 | 65 |
| 127 E Vine St | 0.51mi | 3/2.0 | 1,634 (-1%) | 9mo | $320,000 | $196 | 64 |
| 413 W Summit St | 0.35mi | 3/2.0 | 1,508 (-9%) | 8mo | $257,000 | $170 | 60 |
| 128 W Summit St | 0.42mi | 2/1.0 (-1) | 1,554 (-6%) | 4mo | $120,000 | $77 | 60 |
| 215 N High St | 0.58mi | 4/1.5 (+1) | 1,606 (-3%) | 5mo | $60,000 | $37 | 59 |
| 416 N Union St | 0.50mi | 3/2.0 | 1,707 (+3%) | 14mo | $105,000 | $62 | 58 |
| 103 E Harrison St | 0.56mi | 3/2.0 | 1,812 (+10%) | 1mo | $220,000 | $121 | 55 |
| 208 W Vine St | 0.47mi | 3/1.5 | 1,593 (-4%) | 23mo | $135,000 | $85 | 52 |
| 209 E Franklin St | 0.39mi | 2/1.5 (-1) | 1,544 (-7%) | 19mo | $175,000 | $113 | 50 |
| 601 N Union St | 0.60mi | 4/2.0 (+1) | 1,736 (+5%) | 9mo | $183,000 | $105 | 50 |
| 425 N Union St | 0.53mi | 3/2.5 | 1,520 (-8%) | 13mo | $255,000 | $168 | 47 |
| 3 Cobblestone Ct | 0.72mi | 3/2.5 | 1,771 (+7%) | 11mo | $380,000 | $215 | 42 |
Match score weights: distance 35% · size 25% · config 20% · recency 20%. Top-matched comps best support the ARV.
Projected returns pro-forma
-3.0% appreciation · 3.0% rent growth · sell at horizon
- IRR
- -1.3%
- Equity multiple
- 0.95×
- Total profit
- $-2,085
- Equity at exit
- $23,245
- IRR
- 8.5%
- Equity multiple
- 1.65×
- Total profit
- $28,325
- Equity at exit
- $13,479
Cash invested: $43,652 (down + closing). Projections, not guarantees.
Landlord ↔ Tenant lean methodology
- Overall (STATE)
- 90 Strongly Landlord-Friendly
- State Indiana
- 90 Strongly Landlord-Friendly · R+11
- County
- — inherits STATE
- City
- — inherits STATE
ZIP-level market 46923
- Home prices YoY
- -10.5%
- Active inventory
- 46
- Price-to-rent
- 6.6×
Monthly cashflow live
- Estimated rent
- $1,981 medium interval (Pro) →
- Mortgage (P&I)
- −$818
- Tax est. 1.5%
- −$195 /mo · $2,338/yr
- Insurance
- −$65
- Flood insurance flood zone
- −$125 /mo · $1,502/yr
- HOA
- −$0
- Lot rent
- −$0
- Vacancy / Maint / Mgmt
- −$416
- Net cashflow
- $362
Break-even live
Sensitivity live
| Price | -10% $470 | -5% $416 | +0% $362 | +5% $308 | +10% $254 |
|---|---|---|---|---|---|
| Rent | -10% $206 | -5% $284 | +0% $362 | +5% $440 | +10% $519 |
| Rate | -1.0pp $441 | -0.5pp $402 | base $362 | +0.5pp $322 | +1.0pp $281 |
UW: 25.0% down · 7.5% · 30yr · 1.5% tax · 5.0% vac · 8.0% maint · 8.0% mgmt
Financing live
Cash to close
- Down payment
- $38,975
- Closing costs
- $4,677
- Reserves months
- —
- Total cash needed
- —
Loan-product check · same deal, 3 products live
Conventional
25% down · 7.5% · 30yr
- Down + closing
- —
- Monthly P&I
- —
- Monthly cashflow
- —
- DSCR
- —
- Eligible?
- —
Personal DTI + credit; lowest rate.
DSCR
20% down · 8.5% · 30yr
- Down + closing
- —
- Monthly P&I
- —
- Monthly cashflow
- —
- DSCR
- —
- Eligible?
- —
No personal income docs; deal must DSCR.
Hard money
10% down · 12.0% · 12mo
- Down + closing
- —
- Monthly P&I
- —
- Monthly cashflow
- —
- DSCR
- —
- Eligible?
- —
Short-term bridge; refi at stabilization.
Rent comps 3 comps
| Address | Beds | Baths | Sqft | Rent | $/sqft | DOM | Units | Dist |
|---|---|---|---|---|---|---|---|---|
| 126 E North St Delphi, IN | 4.0 | 3.0 | 2100 | $2,250 | $1.07 | 16d | 1 | 0.40mi |
| 921 S Washington St Delphi, IN | 4.0 | 1.0 | 2244 | $1,650 | $0.74 | 46d | 1 | 0.47mi |
| 115 E Vine St Delphi, IN | 3.0 | 2.5 | 1590 | $1,975 | $1.24 | 16d | 1 | 0.50mi |
Listing history 25 events
-
2026-06-23days on market $155,900 Active 54 DOM
-
2026-06-22days on market $155,900 Active 53 DOM
-
2026-06-19days on market $155,900 Active 51 DOM
-
2026-06-18days on market $155,900 Active 50 DOM
-
2026-06-17days on market $155,900 Active 49 DOM
-
2026-06-16days on market $155,900 Active 48 DOM
-
2026-06-15days on market $155,900 Active 47 DOM
-
2026-06-14days on market $155,900 Active 45 DOM
-
2026-06-13days on market $155,900 Active 44 DOM
-
2026-06-10days on market $155,900 Active 42 DOM
-
2026-06-09days on market $155,900 Active 41 DOM
-
2026-06-08days on market $155,900 Active 40 DOM
-
2026-06-07days on market $155,900 Active 39 DOM
-
2026-06-05days on market $155,900 Active 36 DOM
-
2026-06-03days on market $155,900 Active 35 DOM
-
2026-06-02days on market $155,900 Active 34 DOM
-
2026-06-01days on market $155,900 Active 33 DOM
-
2026-05-31days on market $155,900 Active 32 DOM
-
2026-05-30days on market $155,900 Active 31 DOM
-
2026-05-18status Active 551-char remark
-
2026-05-03historical Active Under Contract 551-char remark
-
2026-04-28$155,900 Active 551-char remark
-
2017-12-08soldstatus $40,000 173-char remark
Show marketing remark (173 chars)
Nicely remodeled home for a great price! The downstairs offers all newer floors and a newer kitchen. This 3 bed 1.5 bath home has a great layout. Don't miss this Great buy!!
-
2017-09-07$41,600 173-char remark
Show marketing remark (173 chars)
Nicely remodeled home for a great price! The downstairs offers all newer floors and a newer kitchen. This 3 bed 1.5 bath home has a great layout. Don't miss this Great buy!!
-
2017-08-07soldstatus $33,370
ⓘ Source: listings_history table (triggers on properties + properties_extension) + one-shot
backfill from property_details.listing_events for pre-trigger history.
Climate risk First Street
- Flood 9/10 Extreme FEMA zone A · 99% chance over 30 yrs
- Wildfire 1/10 Low
- Heat 3/10 Moderate 7 d/yr ≥102°F today · 17 d/yr by 30 yrs out
- Wind 2/10 Low
- Air quality 2/10 Low 1 unhealthy d/yr today · 2 by 30 yrs out
Nearby sold comps map
Loading sold comps map…
Walkable amenities ~0.75 mi
Loading nearby amenities…
Taxation est. · year 1
- Rental income
- $23,769
- − Mortgage interest
- −$8,733
- − Property taxes
- −$2,338
- − Insurance
- −$2,282
- − Repairs & maintenance
- −$1,902
- − Management
- −$1,902
- − Depreciation
- −$4,535
- Taxable income
- $2,078
- Est. tax owed @ 24.0%
- −$499
- After-tax cash flow
- $3,848/yr
For passive investors: Depreciation is non-cash, so a rental often shows a tax loss while cash-flowing — sheltering income. Rental losses are passive: they offset passive income freely, and up to $25,000/yr can offset ordinary (W-2) income if you actively participate and your MAGI is under $100k (phasing out to $0 by $150k); unused losses carry forward. On sale, claimed depreciation is recaptured at up to 25%, and gains may owe capital-gains tax (a 1031 exchange can defer both). Figures are a year-1 estimate at your 24.0% rate — not tax advice; consult a CPA.
Schools (NCES district)
- District
- Delphi Community School Corporation
- NCES district ID
- 1802700
- Math proficiency
- 36% ▼ -11.00%
- Reading proficiency
- 41% ▼ -8.00%
- Median HH income
- $47,044
- Composite
- 32.95/100
- National rank
- #5589
- State rank
- #160 of 301 in IN
Livability — Delphi
- Score
- 72/100
- State rank
- #112
- US rank
- #5934
Category grades
Schools grade is shown separately in the Schools card above.
Census & demographics
- Census place
- Delphi, IN
- Population (ZIP)
- 8,036
Population outlook (Carroll County) Hauer SSP2
- Today (2025)
- 19,409 people
- By 2030
- 18,970 · -2.3%
- By 2040
- 17,934 · -7.6%
- By 2050
- 16,753 · -13.7%
- By 2075
- 14,084 · -27.4%
- By 2100
- 11,350 · -41.5%
Race, ethnicity, and origin ACS 2023
- Neighborhood character
- Predominantly White (90%)
- Race & ethnicity
- White 90% Hispanic / Latino 7% Two or more races 4%
- Hispanic origin (detail)
- Mexican 6%
- Common ancestry
- Lithuanian 2% Slovak 2% Italian 2%
- Foreign-born
- 3% · Canada, Jamaica
- Languages at home
- 95% English-only · Spanish 5%
Political lean MEDSL · Carroll
- 2024 margin
- Solid R (+52.1) · D 23.1% · R 75.2% · Other 1.7%
- 2008→2024 swing
- -39.3pp toward R · 2008: -12.8pp · 2024: -52.1pp
- All cycles
- 2024: R+52.1 2020: R+51.2 2016: R+50.9 2012: R+30.3 2008: R+12.8
Not yet ingested
- Civics
- —
Market trends
- HPI YoY
- ▼ -30.54%
- Current HPI
- 261.2451
- Rent YoY
- —
- Metro
- —
- State GDP YoY
- ▲ 2.90%
- F500 in state
- 18
Industry mix (Fortune 500 HQ in IN)
| Industry | F500 HQs | Revenue |
|---|---|---|
| Industrial Machinery | 2 | $37B |
|
||
| Healthcare | 1 | $177B |
|
||
| Pharmaceuticals | 1 | $45B |
|
||
| Metals / Steel | 1 | $18B |
|
||
| Agriculture | 1 | $17B |
|
||
| Packaging | 1 | $12B |
|
||
Price history
+367.2% since first listed6 events — show timeline
- 2026-05-18 Relisted — IRMLS
- 2026-05-03 Contingent — IRMLS
- 2026-04-28 Listed $155,900 IRMLS
- 2017-12-08 Sold (MLS) $40,000 IRMLS
- 2017-09-07 Listed $41,600 IRMLS
- 2017-08-07 Sold (Public Records) $33,370 Public Records
Property tax history
+0.9%/yrLatest (2025): $278 · -27.9% YoY. Source: county tax records.
Cash-flow waterfall
monthlySold comps — $/sqft
last 12 mo · ≤1 miLoading sold comps…