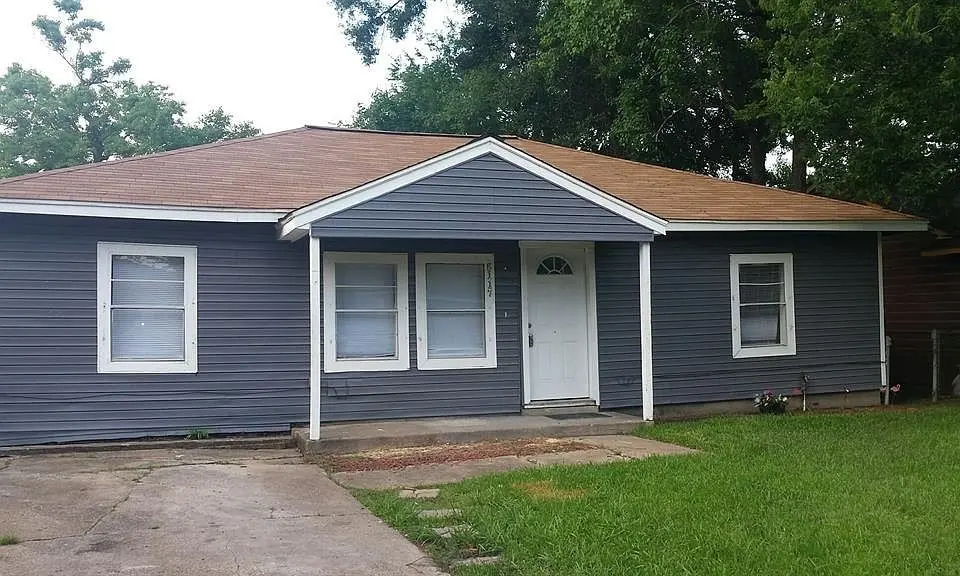
5117 Rapido Rd · Houston, TX
Flood risk 5/10 · Moderate
- FEMA flood zone
- X (unshaded)
- Chance of flooding over 30 yrs
- 0.65%
- Est. flood insurance / yr
- $507 – $1,088
Fire risk 1/10 · Minimal
- Est. fire insurance / yr
- $1,222 – $2,270
Heat risk 9/10 · Severe
- Hot days now (above 109°F)
- 7 days/yr
- Hot days in 30 yrs
- 24 days/yr
Wind risk 9/10 · Severe
- Chance of severe wind over 30 yrs
- 99.0%
Air-quality risk 2/10 · Minimal
- Unhealthy air days now
- 2 days/yr
- Unhealthy air days in 30 yrs
- 2 days/yr
Risk factors via First Street. Map © Google.
Why this score? — see what drove the D+ grade
The composite is a weighted blend of 9 inputs, each scored 0–100. Each bar is that input's sub-score; the figure is the points it added to the 100-point composite (weight × sub-score).
- Cash flow +14.2/30.0
- ARV discount +12.5/15.0
- DSCR +4.3/10.0
- 1% rule +4.1/10.0
- Rent growth +3.9/5.0
- Livability +3.7/5.0
- Schools +2.7/10.0
- Condition / age +2.5/5.0
- Appreciation +0.0/10.0
$149,000
🖨 Deal sheet 📄 Offer letter ✓ Due diligence
Listing remarks MLS
Stabilized 12-Home SFR Portfolio | Houston, TX | $142K NOI | 5.5% Cap | Rent Growth & Market Appreciation Potential *** OPPORTUNITY ZONE *** (Seller will not sell home individually) This property provides immediate flexibility for value creation as the tenant is on a month-to-month lease, allowing for a rent adjustment or new lease structure. Significant interior renovations were completed in 2013, including all interior plumbing, bathroom remodel, new HVAC, flooring, sheetrock, and electrical upgrades. In 2022, the kitchen was fully remodeled, further enhancing interior appeal. Condition & Value-Add: The primary opportunity lies in exterior improvements—siding and window replacement—which would align the property with interior quality and support a rent increase to $1,250 or more per month. Please review attachment will all other properties in portfolio sale.
Key facts
- New hvac
- Bathroom remodel
- Interior renovations
Tags
Neighborhood map
What this means for you Summary
Snapshot
- This is a 2-bed/1.0-bath single-family listed at $149k.
Deal economics
- At list price, monthly cash flow is $26 ($306/yr) — positive.
- The deal already cash-flows at list — no discount required.
- To meet the 1% rule (rent ≥ 1% of price), the offer needs to be $135k (9.4% below list).
- Recommended offer: $131k (12.0% below list) — sets the bar for market timing.
- Cap rate 6.5% vs local median 3.2% in Houston — top-decile yield for the area; either an underpriced asset or a hidden risk that comps aren't pricing in. Stress-test before assuming the spread holds.
Location & tenants
- Location reads 74/100 on livability (#184 in TX, #4,771 nationally) — a middle-class / working-renter tenant base. Strengths: amenities A+, cost of living A+, housing A+; Watch: schools D, crime F.
- Houston ISD (urban): math 27% / reading 35% proficiency, ranked #593 of 826 in TX (top 72%) — families likely to look elsewhere, expect single-tenant / working-renter base with shorter leases; 71% free/reduced lunch — lower-income household profile, screen leases tightly.
- Market conditions: Rents rising fast (+5.5%/yr); 338 active listings in the ZIP; 40 comparable units currently listed for rent nearby; rentals at typical pace (median 22d on market — plan ~3-4 weeks tenant-placement turnaround); 40% of comp listings sitting > 30 days — soft ceiling on asking rent; lower-income renter base — watch delinquency; 29,883 units permitted in Harris County in 2024 (8,621 in 5+ unit buildings).
- This rent runs 43% of the median local income ($38k/yr) — at the standard rent-burdened threshold; future hikes will face affordability resistance.
Forward outlook
- Local home prices are declining (-3.0%/yr); year-one equity from $1k of loan paydown is wiped out by about $4k of value loss. Plan a longer hold.
- Harris County population projected at +47% by 2050 — long-run rental-demand tailwind backs the buy-and-hold thesis.
Negotiation context
- It's been on market 328 days — a 12% lower offer ($131k) is reasonable based on typical stale-listing flexibility.
Risks & watch-outs
- Watch-outs: built in 1950 — expect roof / HVAC / electrical / plumbing capex.
- Climate carrying-cost: moderate flood risk; severe wind risk, 99% chance of damaging wind over 30y; extreme-heat days projected 7→24/yr by 2055 (HVAC capex compounding) — expect insurance premiums to compound above CPI over the hold.
Questions for the listing agent
- It's been on market 328 days. Have you received any prior offers? Is the seller open to a 12% concession, seller financing, or rate buy-down credit?
- Built in 1950 — when were the roof, HVAC, electrical panel, plumbing, and water heater last replaced?
- Why hasn't it sold? Are there any deal-killer items the seller is aware of (foundation, flood, title, zoning, code violations)?
- Is there a deadline driving the sale (1031 exchange, divorce, estate, relocation)? That informs how much negotiation room exists.
- Schools are D-rated, which usually means shorter tenancies and higher turnover. Who's the typical renter profile here, and what's been the actual vacancy rate?
- Crime grade is F in this area — have there been break-ins, vandalism, or insurance claims at this property in the last 3 years? What carrier currently insures it and at what premium?
- The area grade is low — what's the realistic commute time and amenity access for the typical tenant pool here? Any planned neighborhood developments (good or bad) we should know about?
- What's the average days-on-market for RENTAL listings here right now (not sales)? A rising rental-DOM trend means longer vacancies and softer asking-rent achievability than the comps imply.
- What's the recent tenant-quality profile in this submarket — average credit score on applications, eviction rate, late-payment / NSF rate, and stable-employment percentage? A property-management company in the area should have these aggregated.
- How much new for-sale + rental construction is in the pipeline within 1–3 miles? Heavy new supply typically softens prices + rents 12–24 months out; constrained supply supports both.
Investment metrics
- 1% rule
- 0.91% ✗
- Cap rate
- 6.50%
- Cash-on-cash
- 0.73%
- DSCR
- 1.03
- GRM
- 9.2
CMA / ARV
- ARV (median comp)
- $167,610
- List price
- $149,000
- Delta
- -11.10%
- Verdict
- UNDERPRICED
- Comps
- 20 within 1.0 mi
Show comp detail 12 sales within ~0.75 mi
| Address | Dist | Beds/Ba | Sqft | Sold | Price | $/sf | Match |
|---|---|---|---|---|---|---|---|
| 5106 Malmedy Rd | 0.16mi | 3/1.5 (+1) | 1,071 (+2%) | 9mo | $159,999 | $149 | 75 |
| 7314 Forrestal St | 0.35mi | 3/1.0 (+1) | 1,020 (-3%) | 0mo | $105,000 | $103 | 73 |
| 5306 Kenilwood Dr | 0.68mi | 2/1.0 | 1,038 (-1%) | 5mo | $80,000 | $77 | 62 |
| 5041 Southwind St | 0.43mi | 3/2.0 (+1) | 1,020 (-3%) | 7mo | $195,000 | $191 | 60 |
| 7330 Hurtgen Forest Rd | 0.31mi | 3/2.0 (+1) | 1,154 (+10%) | 3mo | $154,900 | $134 | 58 |
| 7710 Sharondale Dr | 0.72mi | 2/1.0 | 1,050 (-0%) | 10mo | $75,000 | $71 | 58 |
| 5010 Gren St | 0.53mi | 3/1.0 (+1) | 1,017 (-3%) | 9mo | $135,000 | $133 | 57 |
| 5018 Balkin St | 0.66mi | 3/2.0 (+1) | 1,048 (-0%) | 9mo | $189,000 | $180 | 52 |
| 5318 Longmeadow St | 0.58mi | 3/1.0 (+1) | 1,138 (+8%) | 3mo | $125,000 | $110 | 52 |
| 5035 Andrea St | 0.44mi | 3/2.0 (+1) | 1,156 (+10%) | 5mo | $195,000 | $169 | 50 |
| 5014 Yellowstone Blvd | 0.48mi | 3/2.0 (+1) | 1,190 (+13%) | 6mo | $189,900 | $160 | 42 |
| 7713 St Lo Rd | 0.73mi | 3/2.0 (+1) | 1,151 (+9%) | 4mo | $199,900 | $174 | 39 |
Match score weights: distance 35% · size 25% · config 20% · recency 20%. Top-matched comps best support the ARV.
Projected returns pro-forma
-3.0% appreciation · 5.45% rent growth · sell at horizon
- IRR
- -12.4%
- Equity multiple
- 0.54×
- Total profit
- $-19,082
- Equity at exit
- $22,216
- IRR
- 0.1%
- Equity multiple
- 1.01×
- Total profit
- $303
- Equity at exit
- $12,883
Cash invested: $41,720 (down + closing). Projections, not guarantees.
Landlord ↔ Tenant lean methodology
- Overall (STATE)
- 87 Strongly Landlord-Friendly
- State Texas
- 87 Strongly Landlord-Friendly · R+5
- County
- — inherits STATE
- City
- — inherits STATE
ZIP-level market 77033
- Home prices YoY
- -16.3%
- Rents YoY
- 5.5%
- Active inventory
- 338
- Price-to-rent
- 9.2×
Monthly cashflow live
- Estimated rent
- $1,351 high interval (Pro) →
- Mortgage (P&I)
- −$781
- Tax from tax record
- −$198 /mo · $2,376/yr
- Insurance
- −$62
- HOA
- −$0
- Vacancy / Maint / Mgmt
- −$284
- Net cashflow
- $26
Break-even live
UW: 25.0% down · 7.5% · 30yr · 1.5% tax · 5.0% vac · 8.0% maint · 8.0% mgmt
Financing live
Cash to close
- Down payment
- $37,250
- Closing costs
- $4,470
- Reserves months
- —
- Total cash needed
- —
Loan-product check · same deal, 3 products live
Conventional
25% down · 7.5% · 30yr
- Down + closing
- —
- Monthly P&I
- —
- Monthly cashflow
- —
- DSCR
- —
- Eligible?
- —
Personal DTI + credit; lowest rate.
DSCR
20% down · 8.5% · 30yr
- Down + closing
- —
- Monthly P&I
- —
- Monthly cashflow
- —
- DSCR
- —
- Eligible?
- —
No personal income docs; deal must DSCR.
Hard money
10% down · 12.0% · 12mo
- Down + closing
- —
- Monthly P&I
- —
- Monthly cashflow
- —
- DSCR
- —
- Eligible?
- —
Short-term bridge; refi at stabilization.
Rent comps 40 comps
| Address | Beds | Baths | Sqft | Rent | $/sqft | DOM | Units | Dist |
|---|---|---|---|---|---|---|---|---|
| 5537 Bataan Rd Houston, TX | 2.0 | 1.0 | 880 | $1,300 | $1.48 | 44d | 1 | 0.45mi |
| 6532 Weston St Unit A Houston, TX | 3.0 | 3.0 | 1484 | $2,200 | $1.48 | 18d | 1 | 0.69mi |
| 6528 Weston St Unit A Houston, TX | 3.0 | 3.0 | 1484 | $2,200 | $1.48 | 44d | 1 | 0.69mi |
| 5835 Southmont St Houston, TX | 3.0 | 2.0 | 1200 | $1,700 | $1.42 | 44d | 1 | 0.70mi |
| 5954 Doolittle Blvd Houston, TX | 3.0 | 2.0 | 1371 | $1,575 | $1.15 | 44d | 1 | 0.81mi |
| 5314 Northridge Dr Unit A Houston, TX | 3.0 | 2.0 | 872 | $1,185 | $1.36 | 44d | 1 | 0.85mi |
| 7918 Jutland Rd Houston, TX | 3.0 | 1.0 | 996 | $1,295 | $1.30 | 44d | 1 | 0.88mi |
| 6030 Schroeder Rd Houston, TX | 1.0 | 1.0 | 740 | $850 | $1.15 | 44d | 1 | 0.91mi |
| 7818 Calhoun Rd Unit 8 Houston, TX | 2.0 | 1.0 | 800 | $1,200 | $1.50 | 44d | 1 | 0.96mi |
| 4530 Mayflower St Houston, TX | 3.0 | 2.0 | 1302 | $1,800 | $1.38 | 44d | 1 | 0.99mi |
| 5514 Griggs Rd Unit 5565 Houston, TX | 1.0 | 1.0 | 1003 | $935 | $0.93 | 44d | 1 | 1.03mi |
| 5514 Griggs Rd Unit 5535 Houston, TX | 1.0 | 1.0 | 1003 | $940 | $0.94 | 14d | 1 | 1.03mi |
| 5514 Griggs Rd Unit 422 Houston, TX | 2.0 | 2.0 | 1322 | $1,190 | $0.90 | 8d | 1 | 1.03mi |
| 5514 Griggs Rd Unit 2187 Houston, TX | 2.0 | 2.0 | 1322 | $1,182 | $0.89 | 3d | 1 | 1.03mi |
| 5514 Griggs Rd Unit 5571 Houston, TX | 2.0 | 2.0 | 1322 | $1,214 | $0.92 | 11d | 1 | 1.03mi |
| 5514 Griggs Rd Unit 5535 Houston, TX | 1.0 | 1.0 | 1003 | $1,004 | $1.00 | 11d | 1 | 1.03mi |
| 5514 Griggs Rd Unit 2162 Houston, TX | 2.0 | 2.0 | 1322 | $1,190 | $0.90 | 5d | 1 | 1.03mi |
| 5514 Griggs Rd Unit 1165 Houston, TX | 1.0 | 1.0 | 1003 | $962 | $0.96 | 3d | 1 | 1.03mi |
| 5514 Griggs Rd Unit 324 Houston, TX | 1.0 | 1.0 | 1003 | $965 | $0.96 | 8d | 1 | 1.03mi |
| 5514 Griggs Rd Unit 1162 Houston, TX | 1.0 | 1.0 | 1003 | $965 | $0.96 | 5d | 1 | 1.03mi |
| 4615 Redbud St Unit b Houston, TX | 3.0 | 2.0 | 872 | $1,149 | $1.32 | 24d | 1 | 1.04mi |
| 5918 Schroeder Rd Houston, TX | 1.0–2.0 | 1.0 | 850 | $1,000 | $1.18 | 44d | 1 | 1.04mi |
| 5924 Schroeder Rd Houston, TX | 1.0 | 1.0 | 800 | $795 | $0.99 | 24d | 1 | 1.05mi |
| 5924 Schroeder Rd Houston, TX | 2.0 | 1.0 | 900 | $895 | $0.99 | 44d | 1 | 1.05mi |
| 5924 Schroeder Rd Houston, TX | 2.0 | 1.0 | 900 | $895 | $0.99 | 22d | 1 | 1.05mi |
| 8107 Calhoun Rd Houston, TX | 3.0 | 2.5 | 1304 | $2,250 | $1.73 | 24d | 1 | 1.05mi |
| 5514 Griggs Rd Houston, TX | 2.0 | 2.0 | 1322 | $1,210 | $0.92 | 44d | 1 | 1.05mi |
| 5514 Griggs Rd Houston, TX | 1.0 | 1.0 | 1003 | $935 | $0.93 | 14d | 1 | 1.05mi |
| 4609 Bricker St Unit ABC Houston, TX | 3.0 | 2.5 | 1375 | $3,500 | $2.55 | 11d | 1 | 1.08mi |
| 4609 Bricker St Unit C Houston, TX | 2.0 | 1.5 | 1100 | $3,200 | $2.91 | 13d | 1 | 1.08mi |
| 4609 Bricker St Unit B Houston, TX | 3.0 | 2.5 | 1300 | $3,500 | $2.69 | 13d | 1 | 1.08mi |
| 4515 Dewberry St Houston, TX | 1.0 | 1.0 | 1400 | $664 | $0.47 | 21d | 1 | 1.09mi |
| 5514 Griggs Rd Unit 2047 Houston, TX | 2.0 | 2.0 | 1322 | $1,214 | $0.92 | 3d | 1 | 1.10mi |
| 5514 Griggs Rd Unit 2047 Houston, TX | 2.0 | 2.0 | 1322 | $1,225 | $0.93 | 11d | 1 | 1.10mi |
| 5514 Griggs Rd Unit 1047 Houston, TX | 1.0 | 1.0 | 1003 | $1,005 | $1.00 | 11d | 1 | 1.10mi |
| 5116 Griggs Rd Houston, TX | 3.0 | 2.0 | 1131 | $1,316 | $1.16 | 44d | 1 | 1.12mi |
| 5154 Griggs Rd Unit CAVE Houston, TX | 2.0 | 2.0 | 1322 | $1,420 | $1.07 | 3d | 1 | 1.13mi |
| 7032 Conley St Houston, TX | 3.0 | 2.0 | 1220 | $2,850 | $2.34 | 44d | 1 | 1.14mi |
| 5520 Griggs Rd Houston, TX | 2.0 | 2.0 | 1322 | $1,241 | $0.94 | 22d | 1 | 1.16mi |
| 5520 Griggs Rd Houston, TX | 2.0 | 2.0 | 1322 | $1,241 | $0.94 | 44d | 1 | 1.16mi |
Listing history 20 events
-
2026-06-18days on market $149,000 Active 328 DOM
-
2026-06-17days on market $149,000 Active 327 DOM
-
2026-06-16days on market $149,000 Active 326 DOM
-
2026-06-15days on market $149,000 Active 325 DOM
-
2026-06-13days on market $149,000 Active 323 DOM
-
2026-06-10days on market $149,000 Active 319 DOM
-
2026-06-08days on market $149,000 Active 318 DOM
-
2026-06-07days on market $149,000 Active 317 DOM
-
2026-06-04days on market $149,000 Active 314 DOM
-
2026-06-01days on market $149,000 Active 311 DOM
-
2026-05-31days on market $149,000 Active 310 DOM
-
2025-11-04price $149,000 902-char remark
Show marketing remark (902 chars)
Stabilized 12-Home SFR Portfolio | Houston, TX | $142K NOI | 5.5% Cap | Rent Growth & Market Appreciation Potential *** OPPORTUNITY ZONE *** (Seller will not sell home individually) This property provides immediate flexibility for value creation as the tenant is on a month-to-month lease, allowing for a rent adjustment or new lease structure. Significant interior renovations were completed in 2013, including all interior plumbing, bathroom remodel, new HVAC, flooring, sheetrock, and electrical upgrades. In 2022, the kitchen was fully remodeled, further enhancing interior appeal. Condition & Value-Add: The primary opportunity lies in exterior improvements—siding and window replacement—which would align the property with interior quality and support a rent increase to $1,250 or more per month. Please review attachment will all other properties in portfolio sale.
-
2025-07-25$210,000 Active 902-char remark
Show marketing remark (902 chars)
Stabilized 12-Home SFR Portfolio | Houston, TX | $142K NOI | 5.5% Cap | Rent Growth & Market Appreciation Potential *** OPPORTUNITY ZONE *** (Seller will not sell home individually) This property provides immediate flexibility for value creation as the tenant is on a month-to-month lease, allowing for a rent adjustment or new lease structure. Significant interior renovations were completed in 2013, including all interior plumbing, bathroom remodel, new HVAC, flooring, sheetrock, and electrical upgrades. In 2022, the kitchen was fully remodeled, further enhancing interior appeal. Condition & Value-Add: The primary opportunity lies in exterior improvements—siding and window replacement—which would align the property with interior quality and support a rent increase to $1,250 or more per month. Please review attachment will all other properties in portfolio sale.
-
2015-04-22soldstatus
-
2013-02-12soldstatus
-
2004-02-18soldstatus
-
2003-05-15soldstatus
-
2003-05-15soldstatus
-
2003-05-15soldstatus
-
1988-10-16soldstatus
ⓘ Source: listings_history table (triggers on properties + properties_extension) + one-shot
backfill from property_details.listing_events for pre-trigger history.
Tax reassessment forecast TX · Resets to sale price
- Current annual tax
- $2,376 · $198/mo
- Projected year-2 tax
- $2,727 · $227/mo
- Expected delta
- +$351/yr (+$29/mo · 14.8%)
ⓘ Screening estimate from a state-policy table — verify with the county assessor before closing.
Climate risk First Street
- Flood 5/10 Major FEMA zone X (unshaded) · 65% chance over 30 yrs
- Wildfire 1/10 Low
- Heat 9/10 Extreme 7 d/yr ≥109°F today · 24 d/yr by 30 yrs out
- Wind 9/10 Extreme 99% chance of damaging wind over 30 yrs
- Air quality 2/10 Low 2 unhealthy d/yr today · 2 by 30 yrs out
Nearby sold comps map
Loading sold comps map…
Walkable amenities ~0.75 mi
Loading nearby amenities…
Taxation est. · year 1
- Rental income
- $16,206
- − Mortgage interest
- −$8,346
- − Property taxes
- −$2,376
- − Insurance
- −$745
- − Repairs & maintenance
- −$1,297
- − Management
- −$1,297
- − Depreciation
- −$4,335
- Taxable loss
- −$2,188
- Est. tax savings @ 24.0%
- +$525
- After-tax cash flow
- $831/yr
For passive investors: Depreciation is non-cash, so a rental often shows a tax loss while cash-flowing — sheltering income. Rental losses are passive: they offset passive income freely, and up to $25,000/yr can offset ordinary (W-2) income if you actively participate and your MAGI is under $100k (phasing out to $0 by $150k); unused losses carry forward. On sale, claimed depreciation is recaptured at up to 25%, and gains may owe capital-gains tax (a 1031 exchange can defer both). Figures are a year-1 estimate at your 24.0% rate — not tax advice; consult a CPA.
Schools (NCES district)
- District
- Houston ISD
- NCES district ID
- 4823640
- Math proficiency
- 27% ▼ -18.00%
- Reading proficiency
- 35% ▼ -6.00%
- Median HH income
- $46,054
- Composite
- 26.63/100
- National rank
- #7173
- State rank
- #593 of 826 in TX
Livability — Houston
- Score
- 74/100
- State rank
- #184
- US rank
- #4771
Category grades
Schools grade is shown separately in the Schools card above.
Census & demographics
- Census place
- Houston, TX
- County
- Harris County · 4,702,590 people
- City population
- 3,226,434
- Metro
- Houston-The Woodlands-Sugar Land, TX
- Population (ZIP)
- 29,154
- Household income
- $38,071
- Rent vs Own
- Severe rent burden
- 1728.0
Population outlook (Harris County) Hauer SSP2
- Today (2025)
- 5,571,493 people
- By 2030
- 6,089,821 · +9.3%
- By 2040
- 7,142,806 · +28.2%
- By 2050
- 8,185,864 · +46.9%
- By 2075
- 10,574,329 · +89.8%
- By 2100
- 12,109,958 · +117.4%
Race, ethnicity, and origin ACS 2023
- Neighborhood character
- Majority Black (55%)
- Race & ethnicity
- Black 55% Hispanic / Latino 43% Two or more races 17% Native American 1%
- Hispanic origin (detail)
- Mexican 35%
- Common ancestry
- Lithuanian 1%
- Foreign-born
- 18% · Canada
- Languages at home
- 61% English-only · Spanish 39%
Political lean MEDSL · Harris
- 2024 margin
- Lean D (+5.5) · D 52.0% · R 46.4% · Other 1.6%
- 2008→2024 swing
- +3.9pp toward D · 2008: 1.6pp · 2024: 5.5pp
- All cycles
- 2024: D+5.5 2020: D+13.3 2016: D+12.4 2012: D+0.1 2008: D+1.6
Not yet ingested
- Civics
- —
Market trends
- HPI YoY
- ▼ -41.49%
- Current HPI
- 212.6472
- Rent YoY
- ▲ 5.45%
- Metro
- Houston-The Woodlands-Sugar Land, TX
- State GDP YoY
- ▲ 3.95%
- F500 in state
- 110
Industry mix (Fortune 500 HQ in TX)
| Industry | F500 HQs | Revenue |
|---|---|---|
| Energy | 16 | $1,198B |
|
||
| Technology | 5 | $198B |
|
||
| Engineering / Construction | 4 | $72B |
|
||
| Energy Services | 3 | $60B |
|
||
| Utilities | 3 | $41B |
|
||
| Healthcare | 2 | $330B |
|
||
Price history
-29.0% since first listed9 events — show timeline
- 2025-11-04 Price Changed $149,000 HARMLS
- 2025-07-25 Listed $210,000 HARMLS
- 2015-04-22 Sold (Public Records) — Public Records
- 2013-02-12 Sold (Public Records) — Public Records
- 2004-02-18 Sold (Public Records) — Public Records
- 2003-05-15 Sold (Public Records) — Public Records
- 2003-05-15 Sold (Public Records) — Public Records
- 2003-05-15 Sold (Public Records) — Public Records
- 1988-10-16 Sold (Public Records) — Public Records
Property tax history
+5.2%/yrLatest (2025): $2,376 · +17.4% YoY. Source: county tax records.
Cash-flow waterfall
monthlySold comps — $/sqft
last 12 mo · ≤1 miLoading sold comps…