10 Laurel St · Clarence, NY
Flood risk 1/10 · Minimal
- FEMA flood zone
- X (unshaded)
- Chance of flooding over 30 yrs
- 0.0%
- Est. flood insurance / yr
- $507 – $1,088
Fire risk 1/10 · Minimal
- Est. fire insurance / yr
- $691 – $1,283
Heat risk 2/10 · Minimal
- Hot days now (above 93°F)
- 7 days/yr
- Hot days in 30 yrs
- 15 days/yr
Wind risk 1/10 · Minimal
- Chance of severe wind over 30 yrs
- —
Air-quality risk 2/10 · Minimal
- Unhealthy air days now
- 1 days/yr
- Unhealthy air days in 30 yrs
- 2 days/yr
Risk factors via First Street. Map © Google.
Why this score? — see what drove the D+ grade
The composite is a weighted blend of 9 inputs, each scored 0–100. Each bar is that input's sub-score; the figure is the points it added to the 100-point composite (weight × sub-score).
- Cash flow +15.0/30.0
- ARV discount +7.5/15.0
- Schools +6.5/10.0
- 1% rule +5.0/10.0
- DSCR +5.0/10.0
- Livability +3.2/5.0
- Rent growth +2.5/5.0
- Condition / age +2.2/5.0
- Appreciation +0.0/10.0
$25,000
🖨 Deal sheet 📄 Offer letter ✓ Due diligence
Listing remarks MLS
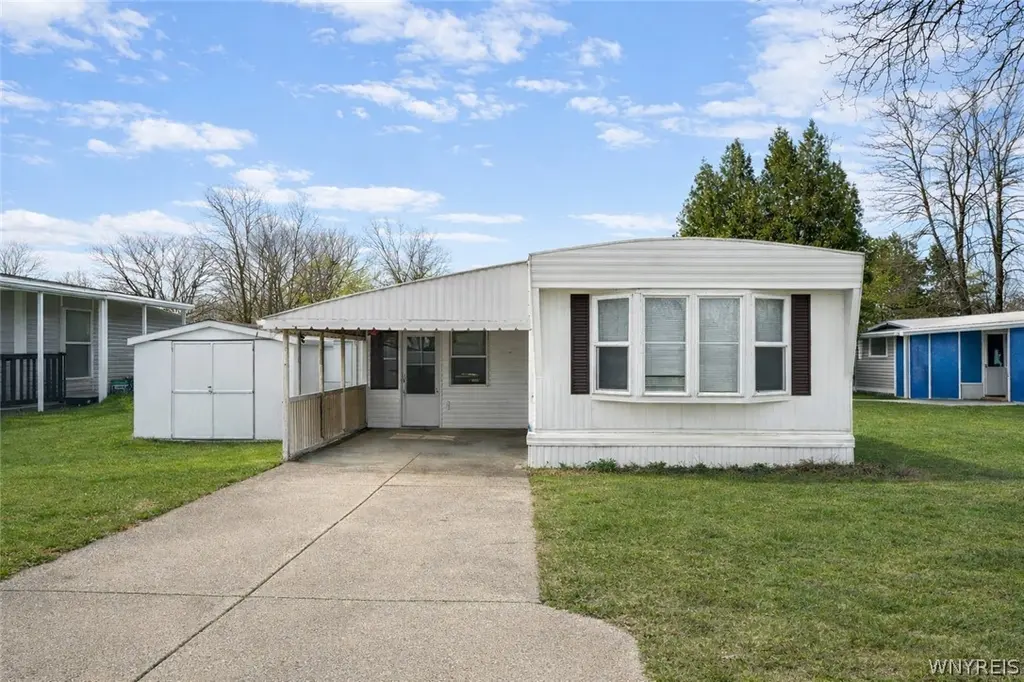
Motivated Seller! Great opportunity to own a property in Akron’s premier 55+ manufactured home community, Quarry Hill! 10 Laurel Street is an expanded singlewide with 3 bedrooms, two full bathrooms, living room, family room with gas fireplace, kitchen with dining area, and laundry. All appliances are about six years old and are included. Forced air heating and cooling. Roomy attached carport. Large storage shed. Quarry Hill includes a community clubhouse w/ kitchen, planned community activities, RV/Boat Storage, pond with walking trail, and on-site management. Current lot rent is $694 and includes snow removal and water (water is metered, so lot rent fluctuates based on usage). Cash only due to age. Sold in "as is" condition.
Key facts
- Expanded singlewide
- Walking trail
- Community clubhouse
Tags
Neighborhood map
What this means for you Summary
Snapshot
- This is a 3-bed/2.0-bath single-family listed at $25k. Condition is rated fair.
Deal economics
- At list price, monthly cash flow is $109 ($1k/yr) — positive.
- The deal already cash-flows at list — no discount required.
- Meets the 1% rule at list price ($1k rent vs $25k).
- Recommended offer: $22k (12.0% below list) — sets the bar for market timing.
- Cap rate 11.5% vs local median 1.3% in Clarence — top-decile yield for the area; either an underpriced asset or a hidden risk that comps aren't pricing in. Stress-test before assuming the spread holds.
Location & tenants
- Location reads 65/100 on livability (#707 in NY) — a middle-class / working-renter tenant base. Strengths: schools A+, crime A+, housing A+; Watch: cost of living D+, amenities F, commute F.
- Clarence Central School District (suburban): math 70% / reading 76% proficiency, ranked #94 of 590 in NY (top 16%) — strong family-tenant draw, lease renewals of 3-5y typical; only 7% free/reduced lunch — higher-income household profile.
- Market conditions: 85 active listings in the ZIP; 1,244 units permitted in Erie County in 2024 (563 in 5+ unit buildings).
Forward outlook
- Local home prices are declining (-3.0%/yr); year-one equity from $173 of loan paydown is wiped out by about $750 of value loss. Plan a longer hold.
- At projected returns (-3.0% appreciation + 3.0% rent growth), your $7k cash investment doubles in ~7 years — after that, you're playing with house money.
Negotiation context
- It's been on market 163 days — a 12% lower offer ($22k) is reasonable based on typical stale-listing flexibility.
Risks & watch-outs
- Watch-outs: HOA is 56% of rent.
Questions for the listing agent
- It's been on market 163 days. Have you received any prior offers? Is the seller open to a 12% concession, seller financing, or rate buy-down credit?
- Have any recent inspections been done? Can we get a copy of the seller's disclosures and any deferred-maintenance estimates?
- Built in 1975 — when were the roof, HVAC, electrical panel, plumbing, and water heater last replaced?
- What does the HOA fee cover, when was the last increase, and are there any pending special assessments or reserve-fund shortfalls?
- Why hasn't it sold? Are there any deal-killer items the seller is aware of (foundation, flood, title, zoning, code violations)?
- Is there a deadline driving the sale (1031 exchange, divorce, estate, relocation)? That informs how much negotiation room exists.
- Schools are A-rated — typically a magnet for longer-tenancy family renters. What's the average tenant stay here, and is there a school-zone premium baked into asking?
- The area grade is low — what's the realistic commute time and amenity access for the typical tenant pool here? Any planned neighborhood developments (good or bad) we should know about?
- What's the average days-on-market for RENTAL listings here right now (not sales)? A rising rental-DOM trend means longer vacancies and softer asking-rent achievability than the comps imply.
- What's the recent tenant-quality profile in this submarket — average credit score on applications, eviction rate, late-payment / NSF rate, and stable-employment percentage? A property-management company in the area should have these aggregated.
- How much new for-sale + rental construction is in the pipeline within 1–3 miles? Heavy new supply typically softens prices + rents 12–24 months out; constrained supply supports both.
Investment metrics
- 1% rule
- 4.94% ✓
- Cap rate
- 11.53%
- Cash-on-cash
- 18.69%
- DSCR
- 1.83
- GRM
- 1.7
CMA / ARV
- ARV (median comp)
- $55,368
- List price
- $25,000
- Delta
- -54.85%
- Verdict
- UNDERPRICED
- Comps
- 1 within 2.0 mi
Show comp detail 2 sales within ~0.75 mi
| Address | Dist | Beds/Ba | Sqft | Sold | Price | $/sf | Match |
|---|---|---|---|---|---|---|---|
| 11714 Main Rd | 0.17mi | 3/1.0 | 1,469 (-3%) | 6mo | $80,000 | $54 | 78 |
| 11552 Main Rd | 0.39mi | 3/2.0 | 1,704 (+12%) | 13mo | $235,000 | $138 | 51 |
Match score weights: distance 35% · size 25% · config 20% · recency 20%. Top-matched comps best support the ARV.
Projected returns pro-forma
-3.0% appreciation · 3.0% rent growth · sell at horizon
- IRR
- 11.8%
- Equity multiple
- 1.48×
- Total profit
- $3,338
- Equity at exit
- $3,728
- IRR
- 21.7%
- Equity multiple
- 2.95×
- Total profit
- $13,656
- Equity at exit
- $2,162
Cash invested: $7,000 (down + closing). Projections, not guarantees.
Landlord ↔ Tenant lean methodology
- Overall (STATE)
- 15 Strongly Tenant-Friendly
- State New York
- 15 Strongly Tenant-Friendly · D+10
- County
- — inherits STATE
- City
- — inherits STATE
ZIP-level market 14001
- Home prices YoY
- -7.1%
- Active inventory
- 85
- Price-to-rent
- 1.7×
Monthly cashflow live
- Estimated rent
- $1,235 medium interval (Pro) →
- Mortgage (P&I)
- −$131
- Tax est. 1.5%
- −$31 /mo · $375/yr
- Insurance
- −$10
- HOA
- −$694
- Vacancy / Maint / Mgmt
- −$259
- Net cashflow
- $109
Break-even live
UW: 25.0% down · 7.5% · 30yr · 1.5% tax · 5.0% vac · 8.0% maint · 8.0% mgmt
Financing live
Cash to close
- Down payment
- $6,250
- Closing costs
- $750
- Reserves months
- —
- Total cash needed
- —
Loan-product check · same deal, 3 products live
Conventional
25% down · 7.5% · 30yr
- Down + closing
- —
- Monthly P&I
- —
- Monthly cashflow
- —
- DSCR
- —
- Eligible?
- —
Personal DTI + credit; lowest rate.
DSCR
20% down · 8.5% · 30yr
- Down + closing
- —
- Monthly P&I
- —
- Monthly cashflow
- —
- DSCR
- —
- Eligible?
- —
No personal income docs; deal must DSCR.
Hard money
10% down · 12.0% · 12mo
- Down + closing
- —
- Monthly P&I
- —
- Monthly cashflow
- —
- DSCR
- —
- Eligible?
- —
Short-term bridge; refi at stabilization.
HOA detail
- Monthly dues
- $694 · $8,328/yr
- Likely covers
- watergassnow removal
Listing history 16 events
-
2026-06-18days on market $25,000 Active 163 DOM
-
2026-06-17days on market $25,000 Active 162 DOM
-
2026-06-16days on market $25,000 Active 161 DOM
-
2026-06-15days on market $25,000 Active 160 DOM
-
2026-06-13days on market $25,000 Active 158 DOM
-
2026-06-13days on market $25,000 Active 157 DOM
-
2026-06-10days on market $25,000 Active 155 DOM
-
2026-06-09days on market $25,000 Active 154 DOM
-
2026-06-08days on market $25,000 Active 153 DOM
-
2026-06-07days on market $25,000 Active 152 DOM
-
2026-06-03days on market $25,000 Active 148 DOM
-
2026-06-02days on market $25,000 Active 147 DOM
-
2026-06-01days on market $25,000 Active 146 DOM
-
2026-05-31days on market $25,000 Active 145 DOM
-
2026-02-18price $25,000 751-char remark
Show marketing remark (751 chars)
Motivated Seller! Great opportunity to own a property in Akron’s premier 55+ manufactured home community, Quarry Hill! 10 Laurel Street is an expanded singlewide with 3 bedrooms, two full bathrooms, living room, family room with gas fireplace, kitchen with dining area, and laundry. All appliances are about six years old and are included. Forced air heating and cooling. Roomy attached carport. Large storage shed. Quarry Hill includes a community clubhouse w/ kitchen, planned community activities, RV/Boat Storage, pond with walking trail, and on-site management. Current lot rent is $694 and includes snow removal and water (water is metered, so lot rent fluctuates based on usage). Cash only due to age. Sold in "as is" condition.
-
2026-01-05$35,000 Active 751-char remark
Show marketing remark (751 chars)
Motivated Seller! Great opportunity to own a property in Akron’s premier 55+ manufactured home community, Quarry Hill! 10 Laurel Street is an expanded singlewide with 3 bedrooms, two full bathrooms, living room, family room with gas fireplace, kitchen with dining area, and laundry. All appliances are about six years old and are included. Forced air heating and cooling. Roomy attached carport. Large storage shed. Quarry Hill includes a community clubhouse w/ kitchen, planned community activities, RV/Boat Storage, pond with walking trail, and on-site management. Current lot rent is $694 and includes snow removal and water (water is metered, so lot rent fluctuates based on usage). Cash only due to age. Sold in "as is" condition.
ⓘ Source: listings_history table (triggers on properties + properties_extension) + one-shot
backfill from property_details.listing_events for pre-trigger history.
Climate risk First Street
- Flood 1/10 Low FEMA zone X (unshaded) · 0% chance over 30 yrs
- Wildfire 1/10 Low
- Heat 2/10 Low 7 d/yr ≥93°F today · 15 d/yr by 30 yrs out
- Wind 1/10 Low
- Air quality 2/10 Low 1 unhealthy d/yr today · 2 by 30 yrs out
Nearby sold comps map
Loading sold comps map…
Walkable amenities ~0.75 mi
Loading nearby amenities…
Taxation est. · year 1
- Rental income
- $14,822
- − Mortgage interest
- −$1,400
- − Property taxes
- −$375
- − Insurance
- −$125
- − Repairs & maintenance
- −$1,186
- − Management
- −$1,186
- − HOA
- −$8,328
- − Depreciation
- −$727
- Taxable income
- $1,495
- Est. tax owed @ 24.0%
- −$359
- After-tax cash flow
- $949/yr
For passive investors: Depreciation is non-cash, so a rental often shows a tax loss while cash-flowing — sheltering income. Rental losses are passive: they offset passive income freely, and up to $25,000/yr can offset ordinary (W-2) income if you actively participate and your MAGI is under $100k (phasing out to $0 by $150k); unused losses carry forward. On sale, claimed depreciation is recaptured at up to 25%, and gains may owe capital-gains tax (a 1031 exchange can defer both). Figures are a year-1 estimate at your 24.0% rate — not tax advice; consult a CPA.
Condition & rehab AI · 2 photos
This home requires significant exterior repairs and maintenance, including roof and siding work, to improve its condition and value.
Repairs flagged
- Major roof — Siding condition suggests potential water damage
- Major exterior siding — Weathered and worn
- Major landscaping — Unkempt and overgrown
Value-add opportunities
- Both paint exterior — Fresh paint would improve curb appeal and home value
- Both repair roof — Fixing the roof would prevent further water damage and improve home value
- Both landscaping — A well-maintained yard would enhance curb appeal and attract potential buyers
Renovation cost estimate screening
| Repair item | Severity | Est. cost |
|---|---|---|
| roof · Siding condition suggests potential water damage | Major | $15,000–50,000 |
| exterior siding · Weathered and worn | Major | $15,000–50,000 |
| landscaping · Unkempt and overgrown | Major | $15,000–50,000 |
| Total estimated repair cost · 3 items | $45,000–150,000 |
Value-add ROI direction
- Both paint exterior — Fresh paint would improve curb appeal and home value ↑
- Both repair roof — Fixing the roof would prevent further water damage and improve home value ↑
- Both landscaping — A well-maintained yard would enhance curb appeal and attract potential buyers ↑
ⓘ Cost ranges are severity-bucket heuristics (US national rule-of-thumb). Get contractor quotes + a written scope before underwriting a rehab budget.
Schools (NCES district)
- District
- Clarence Central School District
- NCES district ID
- 3607590
- Math proficiency
- 70% ▼ -9.00%
- Reading proficiency
- 76% ▲ 2.00%
- Median HH income
- $81,568
- Composite
- 64.85/100
- National rank
- #514
- State rank
- #94 of 590 in NY
Livability — Clarence
- Score
- 65/100
- State rank
- #707
- US rank
- #13415
Category grades
Schools grade is shown separately in the Schools card above.
Census & demographics
- Population (ZIP)
- 9,122
Population outlook (Erie County) Hauer SSP2
- Today (2025)
- 933,037 people
- By 2030
- 935,181 · +0.2%
- By 2040
- 928,531 · -0.5%
- By 2050
- 905,725 · -2.9%
- By 2075
- 834,037 · -10.6%
- By 2100
- 708,033 · -24.1%
Race, ethnicity, and origin ACS 2023
- Neighborhood character
- Predominantly White (91%)
- Race & ethnicity
- White 91% Hispanic / Latino 5% Two or more races 4%
- Hispanic origin (detail)
- Mexican 1% Puerto Rican 2% Dominican 2%
- Common ancestry
- Romanian 21% Slovak 3% Lithuanian 2%
- Foreign-born
- 2% · Canada
- Languages at home
- 97% English-only · Spanish 2%
Political lean MEDSL · Erie
- 2024 margin
- Lean D (+9.7) · D 54.8% · R 45.2%
- 2008→2024 swing
- -7.9pp toward R · 2008: 17.5pp · 2024: 9.7pp
- All cycles
- 2024: D+9.7 2020: D+14.7 2016: D+4.8 2012: D+15.6 2008: D+17.5
Not yet ingested
- Civics
- —
Market trends
- HPI YoY
- ▼ -24.68%
- Current HPI
- 322.1897
- Rent YoY
- —
- Metro
- —
- State GDP YoY
- ▲ 2.60%
- F500 in state
- 92
Industry mix (Fortune 500 HQ in NY)
| Industry | F500 HQs | Revenue |
|---|---|---|
| Financial Services | 10 | $950B |
|
||
| Consumer Goods | 9 | $162B |
|
||
| Insurance | 4 | $225B |
|
||
| Telecommunications | 2 | $144B |
|
||
| Pharmaceuticals | 2 | $112B |
|
||
| Media / Entertainment | 2 | $69B |
|
||
Price history
-28.6% since first listed2 events — show timeline
- 2026-02-18 Price Changed $25,000 WNYREIS
- 2026-01-05 Listed $35,000 WNYREIS
Cash-flow waterfall
monthlySold comps — $/sqft
last 12 mo · ≤1 miLoading sold comps…