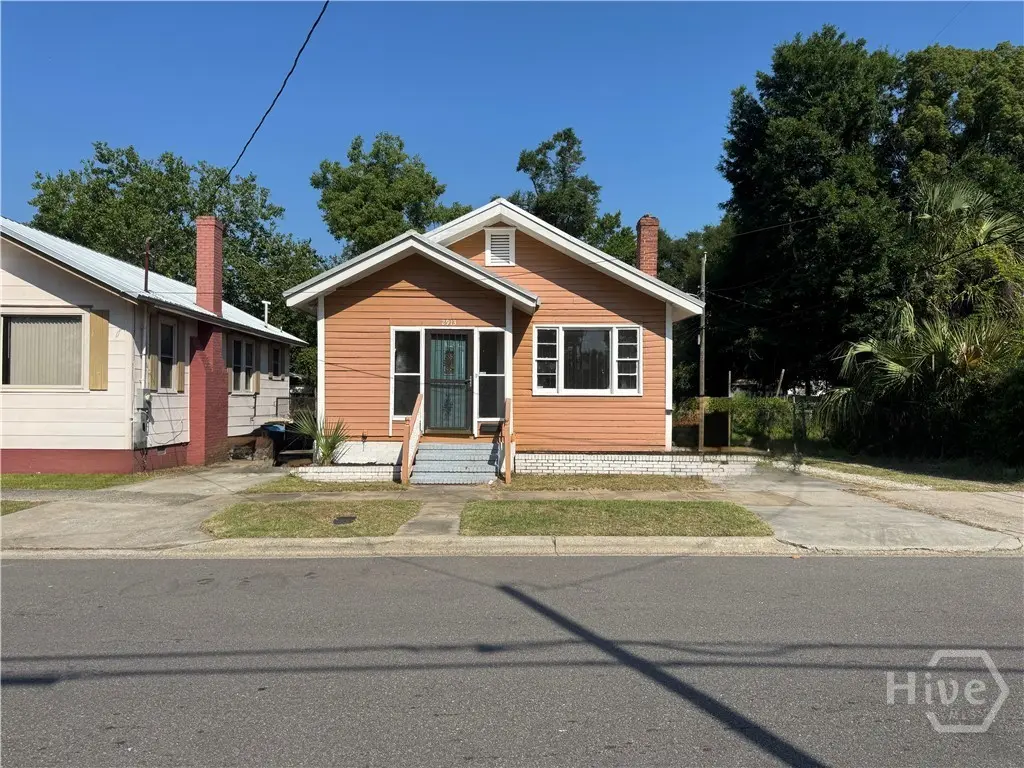
2913 Burroughs St · Savannah, GA
Flood risk 1/10 · Minimal
- FEMA flood zone
- X (unshaded)
- Chance of flooding over 30 yrs
- 0.0%
- Est. flood insurance / yr
- $507 – $1,088
Fire risk 1/10 · Minimal
- Est. fire insurance / yr
- $963 – $1,789
Heat risk 10/10 · Severe
- Hot days now (above 108°F)
- 7 days/yr
- Hot days in 30 yrs
- 18 days/yr
Wind risk 9/10 · Severe
- Chance of severe wind over 30 yrs
- 99.0%
Air-quality risk 5/10 · Moderate
- Unhealthy air days now
- 7 days/yr
- Unhealthy air days in 30 yrs
- 8 days/yr
Risk factors via First Street. Map © Google.
Why this score? — see what drove the B- grade
The composite is a weighted blend of 9 inputs, each scored 0–100. Each bar is that input's sub-score; the figure is the points it added to the 100-point composite (weight × sub-score).
- Cash flow +30.0/30.0
- 1% rule +10.0/10.0
- DSCR +10.0/10.0
- ARV discount +7.5/15.0
- Livability +4.3/5.0
- Condition / age +2.5/5.0
- Rent growth +2.3/5.0
- Schools +2.0/10.0
- Appreciation +0.0/10.0
$99,990
🖨 Deal sheet 📄 Offer letter ✓ Due diligence
Listing remarks
Best deal in Savannah! Located a quiet street within walking distance to SCAD and the Thomas Square Streetcar District. Come envision the possibilities for this 2 bedroom 2 bathroom bungalow with a large living room and an original non-working fireplace. The kitchen is spacious with cabinets and washer dryer hook-ups. Primary bedroom with attached bathroom and tile shower in the back of the home. Additional flex space behind the kitchen that leads to the backyard area. Parking pad to the right of the home. Metal roof offers peace of mind. Central HVAC installed but not functioning. Cash or construction loan only. Sold in AS-IS condition.
Key facts
- Quiet street
- Attached bathroom
- Spacious kitchen
Tags
Property features AI
Exterior
- Parking: Off-street parking; On-street parking
- Utilities: Public water; Public sewer; Cable available
- Home design: Single-family residence; Single-story
- Construction: Wood siding; Metal roof
- Exterior features: Front porch; Chain link fenced yard; Has a view; City lot; Publicly maintained road access
Interior
- Kitchen: Washer hookup in kitchen
- Bedrooms: 2 bedrooms on the main level
- Bathrooms: 2 full bathrooms (both on the main level)
- Heating & cooling: Central heating (natural gas); Central electric air conditioning
- Interior features: Gas water heater; Decorative living room fireplace (1)
- Laundry & utility: Washer hookup; Crawl space basement
Neighborhood map
What this means for you Summary
Snapshot
- This is a 3-bed/1.5-bath single-family listed at $100k.
Deal economics
- At list price, monthly cash flow is $896 ($11k/yr) — positive.
- The deal already cash-flows at list — no discount required.
- Meets the 1% rule at list price ($2k rent vs $100k).
- Cap rate 17.0% vs local median 4.0% in Savannah — top-decile yield for the area; either an underpriced asset or a hidden risk that comps aren't pricing in. Stress-test before assuming the spread holds.
Location & tenants
- Location reads 86/100 on livability (#1 in GA, #397 nationally) — a professional / high-income tenant draw. Strengths: crime A+, amenities A+, commute A+; Watch: employment D, schools F.
- Savannah-Chatham County (urban): math 20% / reading 26% proficiency, ranked #134 of 174 in GA (top 77%) — low school quality limits family demand, transient renter base, plan for 1-2y turnover.
- Market conditions: Rents soft (-0.7%/yr); 268 active listings in the ZIP; 40 comparable units currently listed for rent nearby; rentals at typical pace (median 24d on market — plan ~3-4 weeks tenant-placement turnaround); 45% of comp listings sitting > 30 days — soft ceiling on asking rent; 2,694 units permitted in Chatham County in 2024 (973 in 5+ unit buildings).
- This rent runs 34% of the median local income ($66k/yr) — at the standard rent-burdened threshold; future hikes will face affordability resistance.
Forward outlook
- Local home prices are declining (-3.0%/yr); year-one equity from $692 of loan paydown is wiped out by about $3k of value loss. Plan a longer hold.
- Chatham County population projected at +33% by 2050 — long-run rental-demand tailwind backs the buy-and-hold thesis.
- At projected returns (-3.0% appreciation + 0.0% rent growth), your $28k cash investment doubles in ~4 years — after that, you're playing with house money.
Negotiation context
- Only 6 days on market — expect competitive offers; lowballing is unlikely to land.
- Current owner paid $53k; list at $100k implies a 89% gain — meaningful room to come down on a strong offer.
Risks & watch-outs
- Watch-outs: built in 1950 — expect roof / HVAC / electrical / plumbing capex.
- Climate carrying-cost: severe wind risk, 99% chance of damaging wind over 30y; extreme-heat days projected 7→18/yr by 2055 (HVAC capex compounding) — expect insurance premiums to compound above CPI over the hold.
Questions for the listing agent
- Built in 1950 — when were the roof, HVAC, electrical panel, plumbing, and water heater last replaced?
- Is there a deadline driving the sale (1031 exchange, divorce, estate, relocation)? That informs how much negotiation room exists.
- Schools are F-rated, which usually means shorter tenancies and higher turnover. Who's the typical renter profile here, and what's been the actual vacancy rate?
- What's the average days-on-market for RENTAL listings here right now (not sales)? A rising rental-DOM trend means longer vacancies and softer asking-rent achievability than the comps imply.
- What's the recent tenant-quality profile in this submarket — average credit score on applications, eviction rate, late-payment / NSF rate, and stable-employment percentage? A property-management company in the area should have these aggregated.
- How much new for-sale + rental construction is in the pipeline within 1–3 miles? Heavy new supply typically softens prices + rents 12–24 months out; constrained supply supports both.
Investment metrics
- 1% rule
- 1.88% ✓
- Cap rate
- 17.04%
- Cash-on-cash
- 38.38%
- DSCR
- 2.71
- GRM
- 4.4
CMA / ARV
- ARV (on-the-fly)
- $217,200
- Comps found
- 12
Show comp detail 12 sales within ~0.75 mi
| Address | Dist | Beds/Ba | Sqft | Sold | Price | $/sf | Match |
|---|---|---|---|---|---|---|---|
| 705 W 44th St | 0.16mi | 3/1.0 | 1,144 (-5%) | 2mo | $95,000 | $83 | 81 |
| 601 W 45th St | 0.02mi | 3/2.0 | 1,323 (+10%) | 7mo | $344,900 | $261 | 74 |
| 905 W 41st St | 0.31mi | 3/1.0 | 1,264 (+5%) | 5mo | $125,000 | $99 | 71 |
| 808 W 53rd St | 0.45mi | 3/2.0 | 1,170 (-2%) | 6mo | $260,000 | $222 | 68 |
| 814 W 48th St | 0.28mi | 3/1.0 | 1,056 (-12%) | 2mo | $115,000 | $109 | 63 |
| 2411 Harden St | 0.31mi | 3/1.0 | 1,045 (-13%) | 1mo | $92,500 | $89 | 61 |
| 627 W 35th St | 0.58mi | 3/1.0 | 1,301 (+8%) | 7mo | $189,000 | $145 | 51 |
| 2114 Bulloch St | 0.47mi | 3/2.0 | 1,036 (-14%) | 4mo | $236,000 | $228 | 50 |
| 922 W 42nd St | 0.41mi | 3/2.0 | 1,380 (+15%) | 6mo | $250,000 | $181 | 49 |
| 1706 Ogeechee Rd | 0.69mi | 3/1.0 | 1,293 (+8%) | 7mo | $50,000 | $39 | 47 |
| 3903 Crane St | 0.60mi | 2/2.0 (-1) | 1,072 (-11%) | 2mo | $263,800 | $246 | 46 |
| 412 E 41st St | 0.75mi | 2/1.0 (-1) | 1,076 (-10%) | 1mo | $389,000 | $362 | 40 |
Match score weights: distance 35% · size 25% · config 20% · recency 20%. Top-matched comps best support the ARV.
Projected returns pro-forma
-3.0% appreciation · 0.0% rent growth · sell at horizon
- IRR
- 31.2%
- Equity multiple
- 2.26×
- Total profit
- $35,284
- Equity at exit
- $14,909
- IRR
- 36.8%
- Equity multiple
- 3.95×
- Total profit
- $82,712
- Equity at exit
- $8,645
Cash invested: $27,997 (down + closing). Projections, not guarantees.
Landlord ↔ Tenant lean methodology
- Overall (STATE)
- 90 Strongly Landlord-Friendly
- State Georgia
- 90 Strongly Landlord-Friendly · R+3
- County
- — inherits STATE
- City
- — inherits STATE
ZIP-level market 31405
- Home prices YoY
- -32.4%
- Rents YoY
- -0.7%
- Active inventory
- 268
- Price-to-rent
- 4.4×
Monthly cashflow live
- Estimated rent
- $1,883 high interval (Pro) →
- Mortgage (P&I)
- −$524
- Tax from tax record
- −$26 /mo · $312/yr
- Insurance
- −$42
- HOA
- −$0
- Vacancy / Maint / Mgmt
- −$395
- Net cashflow
- $896
Break-even live
UW: 25.0% down · 7.5% · 30yr · 1.5% tax · 5.0% vac · 8.0% maint · 8.0% mgmt
Financing live
Cash to close
- Down payment
- $24,998
- Closing costs
- $3,000
- Reserves months
- —
- Total cash needed
- —
Loan-product check · same deal, 3 products live
Conventional
25% down · 7.5% · 30yr
- Down + closing
- —
- Monthly P&I
- —
- Monthly cashflow
- —
- DSCR
- —
- Eligible?
- —
Personal DTI + credit; lowest rate.
DSCR
20% down · 8.5% · 30yr
- Down + closing
- —
- Monthly P&I
- —
- Monthly cashflow
- —
- DSCR
- —
- Eligible?
- —
No personal income docs; deal must DSCR.
Hard money
10% down · 12.0% · 12mo
- Down + closing
- —
- Monthly P&I
- —
- Monthly cashflow
- —
- DSCR
- —
- Eligible?
- —
Short-term bridge; refi at stabilization.
Rent comps 40 comps
| Address | Beds | Baths | Sqft | Rent | $/sqft | DOM | Units | Dist |
|---|---|---|---|---|---|---|---|---|
| 607 W 44th St Unit B Savannah, GA | 3.0 | 1.0 | 1050 | $1,650 | $1.57 | 43d | 1 | 0.09mi |
| 628 W 48th St Savannah, GA | 3.0 | 1.0 | 975 | $1,699 | $1.74 | 13d | 1 | 0.13mi |
| 3212 Burroughs St Savannah, GA | 3.0 | 1.0 | 814 | $1,400 | $1.72 | 23d | 1 | 0.15mi |
| 2613 Montgomery St Unit B303 Savannah, GA | 2.0 | 2.0 | 879 | $3,472 | $3.95 | 43d | 1 | 0.21mi |
| 310 W 42nd St Savannah, GA | 3.0 | 2.0 | 1300 | $1,800 | $1.38 | 43d | 1 | 0.27mi |
| 2604 Jefferson St Savannah, GA | 2.0 | 1.0 | 910 | $1,900 | $2.09 | 43d | 1 | 0.27mi |
| 3302 Bulloch St Savannah, GA | 2.0 | 1.0 | 744 | $995 | $1.34 | 23d | 1 | 0.29mi |
| 906 W Victory Dr Savannah, GA | 3.0 | 2.0 | 1176 | $2,400 | $2.04 | 23d | 1 | 0.29mi |
| 1003 W 46th St Savannah, GA | 3.0 | 1.0 | 1100 | $1,625 | $1.48 | 13d | 1 | 0.33mi |
| 2705 Stevens St Savannah, GA | 3.0 | 1.0 | 900 | $1,585 | $1.76 | 43d | 1 | 0.35mi |
| 1005 W Victory Dr Savannah, GA | 3.0 | 2.0 | 1056 | $1,950 | $1.85 | 23d | 1 | 0.36mi |
| 316 W 40th St Unit D Savannah, GA | 2.0 | 1.0 | 700 | $1,500 | $2.14 | 21d | 1 | 0.36mi |
| 316 W 40th St Unit E Savannah, GA | 2.0 | 1.5 | 700 | $1,500 | $2.14 | 21d | 1 | 0.36mi |
| 211 W 40th St Unit B Savannah, GA | 3.0 | 1.0 | 1400 | $3,200 | $2.29 | 23d | 1 | 0.38mi |
| 119 W 52nd St Savannah, GA | 2.0 | 1.0 | 1020 | $1,800 | $1.76 | 43d | 1 | 0.38mi |
| 3211 Bull St Unit A Savannah, GA | 2.0 | 1.0 | 1000 | $1,975 | $1.98 | 43d | 1 | 0.38mi |
| 2910 Bull St Savannah, GA | 3.0 | 2.0 | 1200 | $3,500 | $2.92 | 43d | 1 | 0.39mi |
| 3301 Bull St Unit 4 Savannah, GA | 2.0 | 1.0 | 1000 | $1,750 | $1.75 | 23d | 1 | 0.40mi |
| 12 W 51st St Savannah, GA | 2.0 | 1.0 | 932 | $2,500 | $2.68 | 23d | 1 | 0.41mi |
| 2221 Harden St Savannah, GA | 3.0 | 1.0 | 1000 | $1,550 | $1.55 | 43d | 1 | 0.42mi |
| 213 W 39th St Unit B Savannah, GA | 3.0 | 2.0 | 1000 | $2,250 | $2.25 | 23d | 1 | 0.42mi |
| 3708 Montgomery St Savannah, GA | 2.0 | 1.0 | 725 | $1,400 | $1.93 | 13d | 1 | 0.44mi |
| 2203 Harden St Unit A Savannah, GA | 3.0 | 1.0 | 900 | $2,100 | $2.33 | 13d | 1 | 0.44mi |
| 516 W 38th St Unit 1/2 Savannah, GA | 3.0 | 1.0 | 1176 | $1,600 | $1.36 | 23d | 1 | 0.44mi |
| 516 W 38th St Unit 1/2 Savannah, GA | 3.0 | 1.0 | 1176 | $1,500 | $1.28 | 13d | 1 | 0.44mi |
| 714 W 38th St Savannah, GA | 3.0 | 1.5 | 1200 | $1,650 | $1.38 | 23d | 1 | 0.44mi |
| 315 W 38th St Savannah, GA | 2.0 | 2.0 | 864 | $1,600 | $1.85 | 43d | 1 | 0.45mi |
| 620 W 38th St Unit B Savannah, GA | 2.0 | 1.0 | 1076 | $1,600 | $1.49 | 43d | 1 | 0.45mi |
| 2123 Harden St Savannah, GA | 2.0 | 1.0 | 1000 | $1,550 | $1.55 | 23d | 1 | 0.45mi |
| 1011 W 40th St Savannah, GA | 3.0 | 2.0 | 1125 | $1,995 | $1.77 | 13d | 1 | 0.46mi |
| 1026 W 41st St Savannah, GA | 3.0 | 1.0 | 1128 | $1,500 | $1.33 | 13d | 1 | 0.46mi |
| 2407 Bull St Unit B Savannah, GA | 2.0 | 1.5 | 1200 | $2,095 | $1.75 | 43d | 1 | 0.47mi |
| 601 W 37th St Unit B Savannah, GA | 2.0 | 2.0 | 1300 | $2,000 | $1.54 | 43d | 1 | 0.47mi |
| 4 W 53rd St Unit 4 Savannah, GA | 2.0 | 1.0 | 960 | $1,400 | $1.46 | 43d | 1 | 0.48mi |
| 1109 W 41st St Savannah, GA | 3.0 | 1.0 | 960 | $1,620 | $1.69 | 43d | 1 | 0.49mi |
| 3601 Bull St Unit 2 Savannah, GA | 3.0 | 2.0 | 1386 | $1,900 | $1.37 | 43d | 1 | 0.49mi |
| 3601 Bull St Apt 3 Savannah, GA | 3.0 | 2.0 | 1386 | $1,825 | $1.32 | 43d | 1 | 0.49mi |
| 2 W 53rd St #3 Savannah, GA | 2.0 | 1.0 | 1122 | $1,750 | $1.56 | 43d | 1 | 0.49mi |
| 1014 W 53rd St Savannah, GA | 3.0 | 2.0 | 1048 | $1,600 | $1.53 | 13d | 1 | 0.50mi |
| 3605 Bull St Unit 3 Savannah, GA | 3.0 | 2.0 | 1408 | $1,600 | $1.14 | 23d | 1 | 0.50mi |
Listing history 6 events
-
2026-06-18days on market $99,990 Active 6 DOM
-
2026-06-17days on market $99,990 Active 5 DOM
-
2026-06-16days on market $99,990 Active 4 DOM
-
2026-06-15days on market $99,990 Active 3 DOM
-
2026-06-13remarks 646-char remark
-
2026-06-13$99,990 Active 1 DOM
ⓘ Source: listings_history table (triggers on properties + properties_extension) + one-shot
backfill from property_details.listing_events for pre-trigger history.
Tax reassessment forecast GA · Resets to sale price
- Current annual tax
- $312 · $26/mo
- Projected year-2 tax
- $920 · $77/mo
- Expected delta
- +$608/yr (+$51/mo · 195.2%)
ⓘ Screening estimate from a state-policy table — verify with the county assessor before closing.
Climate risk First Street
- Flood 1/10 Low FEMA zone X (unshaded) · 0% chance over 30 yrs
- Wildfire 1/10 Low
- Heat 10/10 Extreme 7 d/yr ≥108°F today · 18 d/yr by 30 yrs out
- Wind 9/10 Extreme 99% chance of damaging wind over 30 yrs
- Air quality 5/10 Major 7 unhealthy d/yr today · 8 by 30 yrs out
Nearby sold comps map
Loading sold comps map…
Walkable amenities ~0.75 mi
Loading nearby amenities…
Taxation est. · year 1
- Rental income
- $22,595
- − Mortgage interest
- −$5,601
- − Property taxes
- −$312
- − Insurance
- −$500
- − Repairs & maintenance
- −$1,808
- − Management
- −$1,808
- − Depreciation
- −$2,909
- Taxable income
- $9,659
- Est. tax owed @ 24.0%
- −$2,318
- After-tax cash flow
- $8,428/yr
For passive investors: Depreciation is non-cash, so a rental often shows a tax loss while cash-flowing — sheltering income. Rental losses are passive: they offset passive income freely, and up to $25,000/yr can offset ordinary (W-2) income if you actively participate and your MAGI is under $100k (phasing out to $0 by $150k); unused losses carry forward. On sale, claimed depreciation is recaptured at up to 25%, and gains may owe capital-gains tax (a 1031 exchange can defer both). Figures are a year-1 estimate at your 24.0% rate — not tax advice; consult a CPA.
Schools (NCES district)
- District
- Savannah-Chatham County
- NCES district ID
- 1301020
- Math proficiency
- 20% ▼ -11.00%
- Reading proficiency
- 26% ▼ -5.00%
- Median HH income
- $47,443
- Composite
- 20.14/100
- National rank
- #8639
- State rank
- #134 of 174 in GA
Livability — Savannah
- Score
- 86/100
- State rank
- #1
- US rank
- #397
Category grades
Schools grade is shown separately in the Schools card above.
Census & demographics
- Census place
- Savannah, GA
- County
- Chatham County · 271,602 people
- City population
- 216,564
- Metro
- Savannah, GA
- Population (ZIP)
- 40,764
- Household income
- $65,710
- Rent vs Own
- Severe rent burden
- 1712.0
Population outlook (Chatham County) Hauer SSP2
- Today (2025)
- 332,584 people
- By 2030
- 355,508 · +6.9%
- By 2040
- 400,030 · +20.3%
- By 2050
- 443,019 · +33.2%
- By 2075
- 534,579 · +60.7%
- By 2100
- 583,863 · +75.6%
Race, ethnicity, and origin ACS 2023
- Neighborhood character
- Diverse neighborhood (Simpson 0.63)
- Race & ethnicity
- Black 47% White 38% Hispanic / Latino 8% Two or more races 6% Asian 3%
- Hispanic origin (detail)
- Mexican 3% Puerto Rican 1%
- Common ancestry
- Italian 1% Slovak 1% Romanian 1%
- Foreign-born
- 7% · Canada, China, Jamaica
- Languages at home
- 88% English-only · Spanish 6% Other Indo-European 2% Chinese 1%
Political lean MEDSL · Chatham
- 2024 margin
- D (+18.0) · D 58.6% · R 40.6%
- 2008→2024 swing
- +3.6pp toward D · 2008: 14.4pp · 2024: 18.0pp
- All cycles
- 2024: D+18.0 2020: D+18.8 2016: D+14.5 2012: D+12.0 2008: D+14.4
Not yet ingested
- Civics
- —
Market trends
- HPI YoY
- ▼ -147.33%
- Current HPI
- 307.4442
- Rent YoY
- ▼ -0.66%
- Metro
- Savannah, GA
- State GDP YoY
- ▲ 2.66%
- F500 in state
- 28
Industry mix (Fortune 500 HQ in GA)
| Industry | F500 HQs | Revenue |
|---|---|---|
| Paper / Packaging | 2 | $29B |
|
||
| Retail | 1 | $160B |
|
||
| Transportation / Logistics | 1 | $91B |
|
||
| Airlines | 1 | $62B |
|
||
| Consumer Goods | 1 | $47B |
|
||
| Utilities | 1 | $25B |
|
||
Price history
+88.7% since first listed2 events — show timeline
- 2026-06-12 Listed $99,990 Hive MLS
- 2015-07-17 Sold (Public Records) $53,000 Public Records
Property tax history
+52.3%/yrLatest (2025): $312 · +123.9% YoY. Source: county tax records.
Cash-flow waterfall
monthlySold comps — $/sqft
last 12 mo · ≤1 miLoading sold comps…