8128 Hwy 70b · New Woodville, OK
Flood risk 1/10 · Minimal
- FEMA flood zone
- X
- Chance of flooding over 30 yrs
- 0.0%
- Est. flood insurance / yr
- $507 – $1,088
Fire risk 5/10 · Moderate
- Est. fire insurance / yr
- $2,463 – $4,575
Heat risk 6/10 · Moderate
- Hot days now (above 109°F)
- 7 days/yr
- Hot days in 30 yrs
- 21 days/yr
Wind risk 4/10 · Minor
- Chance of severe wind over 30 yrs
- 19.0%
Air-quality risk 3/10 · Minor
- Unhealthy air days now
- 3 days/yr
- Unhealthy air days in 30 yrs
- 3 days/yr
Risk factors via First Street. Map © Google.
Why this score? — see what drove the D grade
The composite is a weighted blend of 9 inputs, each scored 0–100. Each bar is that input's sub-score; the figure is the points it added to the 100-point composite (weight × sub-score).
- Cash flow +10.0/30.0
- Appreciation +10.0/10.0
- ARV discount +7.5/15.0
- DSCR +2.8/10.0
- Rent growth +2.5/5.0
- Schools +2.5/10.0
- Livability +2.5/5.0
- Condition / age +2.5/5.0
- 1% rule +2.4/10.0
$379,000
🖨 Deal sheet (PDF) 📄 Offer letter ✓ Due diligence
Listing remarks
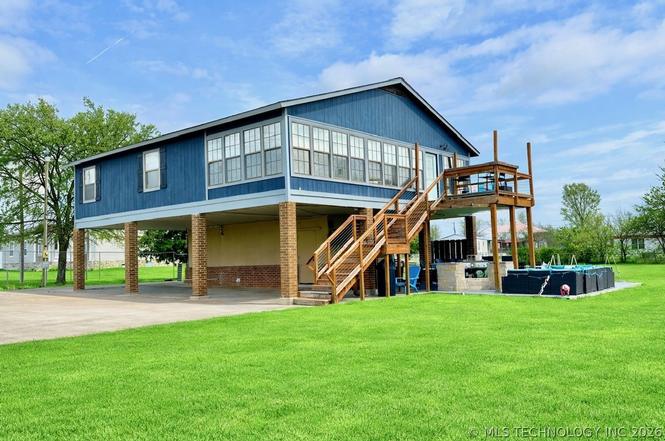
Soldier Creek Home with Distant Lake Views of Lake Texoma! Enjoy lake living in this spacious 3-bedroom, 2-full bath home located near Soldier Creek with distant views of beautiful Lake Texoma. The home features an open kitchen and living area, perfect for entertaining, along with a large bonus room offering flexible space for guests, a game room, or additional living. Recent updates include new fixtures, fresh paint, a new HVAC system, tankless hot water heater, and a new full bathroom on the first floor. Outdoor living is just as impressive with a custom fire pit and outdoor kitchen, ideal for relaxing evenings at the lake with family and friends. The property sits on an oversized 0.62-ac
Key facts
- Large bonus room
- Distant lake views
- New hvac system
Tags
Property features AI
Finance
- Other: Less than 1 mile to Texoma Lake
- HOA & community: Marina access nearby; Sidewalks
Exterior
- Parking: Attached garage (3 spaces); Carport
- Security: Exterior safe room
- Utilities: Electricity available; Water available (rural); Septic tank
- Home design: 2 stories; Faces south; Slab foundation
- Construction: HardiPlank type siding; Wood frame construction; Asphalt/fiberglass roof; Built per public records
- Exterior features: Fire pit; Lighting; Outdoor kitchen; Covered patio/deck; Deck; Patio; Storage structure; Chain link, decorative and privacy fencing; Safe room (exterior)
Interior
- Kitchen: Dishwasher; Oven; Range
- Flooring: Laminate flooring
- Bathrooms: 2 full bathrooms
- Heating & cooling: Central heating (electric); Central air conditioning
- Interior features: High ceilings; Laminate counters; Ceiling fan(s); Electric range connection; Vinyl windows
- Laundry & utility: Washer hookup; Electric dryer hookup; Electric water heater
Neighborhood map
What this means for you Summary
Snapshot
- This is a 3-bed/2.0-bath single-family listed at $379k.
Deal economics
- At list price, monthly cash flow is $-230 ($-3k/yr) — negative.
- To cash-flow at today's rent, offer at most $338k (10.7% below list).
- To meet the 1% rule (rent ≥ 1% of price), the offer needs to be $280k (26.1% below list).
- Recommended offer: $280k (26.1% below list) — sets the bar for 1% rule.
Location & tenants
- Location reads 49/100 on livability (#680 in OK) — a working-class tenant base; expect higher turnover. Strengths: cost of living A+, crime A, employment B+; Watch: amenities F, commute F, health & safety F.
- Kingston (rural): math 27% / reading 32% proficiency, ranked #70 of 270 in OK (top 26%) — low school quality limits family demand, transient renter base, plan for 1-2y turnover; 76% free/reduced lunch — lower-income household profile, screen leases tightly.
- Zoned schools: Kingston Es (math 33% / reading 32%, grade F, #210 of 845 statewide, top 25%, 620 students, 0% FRL); Kingston Ms (math 23% / reading 34%, grade F, #57 of 345 statewide, top 18%, 286 students, 0% FRL); Kingston Hs (math 22% / reading 27%, grade F, #150 of 447 statewide, top 48%, 362 students, 0% FRL) — zoned schools average 0% FRL vs 76% district-wide (76 pts lower); this property's tenant base skews higher-income than the district average.
- Market conditions: 436 active listings in the ZIP; 1 comparable units currently listed for rent nearby; 42 units permitted in Marshall County in 2024 (0 in 5+ unit buildings).
Forward outlook
- In year one you build about $41k of equity ($3k loan paydown + $38k appreciation (10.0% local appreciation)).
- Marshall County population projected at +22% by 2050 — long-run rental-demand tailwind backs the buy-and-hold thesis.
- By year 2, paydown + projected appreciation supports a ~$65k cash-out refi (75% LTV) — recoverable capital for the next deal without selling this one.
Negotiation context
- It's been on market 103 days — a 9% lower offer ($345k) is reasonable based on typical stale-listing flexibility.
Risks & watch-outs
- Climate carrying-cost: moderate wildfire risk; extreme-heat days projected 7→21/yr by 2055 (HVAC capex compounding) — expect insurance premiums to compound above CPI over the hold.
Questions for the listing agent
- What do current leases actually rent for vs. the listed asking? Can we see a recent rent roll and the last 12 months of T-12 income?
- It's been on market 103 days. Have you received any prior offers? Is the seller open to a 26% concession, seller financing, or rate buy-down credit?
- Why hasn't it sold? Are there any deal-killer items the seller is aware of (foundation, flood, title, zoning, code violations)?
- Is there a deadline driving the sale (1031 exchange, divorce, estate, relocation)? That informs how much negotiation room exists.
- Schools are F-rated, which usually means shorter tenancies and higher turnover. Who's the typical renter profile here, and what's been the actual vacancy rate?
- The area grade is low — what's the realistic commute time and amenity access for the typical tenant pool here? Any planned neighborhood developments (good or bad) we should know about?
- What's the average days-on-market for RENTAL listings here right now (not sales)? A rising rental-DOM trend means longer vacancies and softer asking-rent achievability than the comps imply.
- What's the recent tenant-quality profile in this submarket — average credit score on applications, eviction rate, late-payment / NSF rate, and stable-employment percentage? A property-management company in the area should have these aggregated.
- How much new for-sale + rental construction is in the pipeline within 1–3 miles? Heavy new supply typically softens prices + rents 12–24 months out; constrained supply supports both.
Investment metrics
- 1% rule
- 0.74% ✗
- Cap rate
- 5.56%
- Cash-on-cash
- -2.61%
- DSCR
- 0.88
- GRM
- 11.3
CMA / ARV
- ARV (on-the-fly)
- $198,912
- Comps found
- 1
Show comp detail 1 sale within ~0.75 mi
| Address | Dist | Beds/Ba | Sqft | Sold | Price | $/sf | Match |
|---|---|---|---|---|---|---|---|
| 7586 Highway 70b | 0.54mi | 2/2.0 (-1) | 1,658 (+7%) | 22mo | $212,500 | $128 | 40 |
Match score weights: distance 35% · size 25% · config 20% · recency 20%. Top-matched comps best support the ARV.
Projected returns pro-forma
10.0% appreciation · 3.0% rent growth · sell at horizon
- IRR
- 22.4%
- Equity multiple
- 2.81×
- Total profit
- $191,671
- Equity at exit
- $341,433
- IRR
- 20.1%
- Equity multiple
- 6.43×
- Total profit
- $575,848
- Equity at exit
- $736,314
Cash invested: $106,120 (down + closing). Projections, not guarantees.
Landlord ↔ Tenant lean methodology
- Overall (STATE)
- 83 Strongly Landlord-Friendly
- State Oklahoma
- 83 Strongly Landlord-Friendly · R+20
- County
- — inherits STATE
- City
- — inherits STATE
ZIP-level market 73439
- Home prices YoY
- 12.3%
- Active inventory
- 436
- Price-to-rent
- 11.3×
Monthly cashflow live
- Estimated rent
- $2,800 medium interval (Pro) →
- Mortgage (P&I)
- −$1,988
- Tax from tax record
- −$297 /mo · $3,564/yr
- Insurance
- −$158
- HOA
- −$0
- Vacancy / Maint / Mgmt
- −$588
- Net cashflow
- $-230
Break-even live
Sensitivity live
| Price | -10% $-16 | -5% $-123 | +0% $-230 | +5% $-338 | +10% $-445 |
|---|---|---|---|---|---|
| Rent | -10% $-452 | -5% $-341 | +0% $-230 | +5% $-120 | +10% $-9 |
| Rate | -1.0pp $-40 | -0.5pp $-134 | base $-230 | +0.5pp $-329 | +1.0pp $-429 |
UW: 25.0% down · 7.5% · 30yr · 1.5% tax · 5.0% vac · 8.0% maint · 8.0% mgmt
Financing live
Cash to close
- Down payment
- $94,750
- Closing costs
- $11,370
- Reserves months
- —
- Total cash needed
- —
Loan-product check · same deal, 3 products live
Conventional
25% down · 7.5% · 30yr
- Down + closing
- —
- Monthly P&I
- —
- Monthly cashflow
- —
- DSCR
- —
- Eligible?
- —
Personal DTI + credit; lowest rate.
DSCR
20% down · 8.5% · 30yr
- Down + closing
- —
- Monthly P&I
- —
- Monthly cashflow
- —
- DSCR
- —
- Eligible?
- —
No personal income docs; deal must DSCR.
Hard money
10% down · 12.0% · 12mo
- Down + closing
- —
- Monthly P&I
- —
- Monthly cashflow
- —
- DSCR
- —
- Eligible?
- —
Short-term bridge; refi at stabilization.
Rent comps 1 comps
| Address | Beds | Baths | Sqft | Rent | $/sqft | DOM | Units | Dist |
|---|---|---|---|---|---|---|---|---|
| 7542 Big Buck Ln Kingston, OK | 3.0 | 2.0 | 2081 | $2,800 | $1.35 | 23d | 1 | 0.62mi |
Listing history 20 events
-
2026-06-22days on market $379,000 Active 103 DOM
-
2026-06-19days on market $379,000 Active 101 DOM
-
2026-06-18days on market $379,000 Active 100 DOM
-
2026-06-17days on market $379,000 Active 99 DOM
-
2026-06-16days on market $379,000 Active 98 DOM
-
2026-06-15days on market $379,000 Active 97 DOM
-
2026-06-14days on market $379,000 Active 95 DOM
-
2026-06-13days on market $379,000 Active 94 DOM
-
2026-06-10days on market $379,000 Active 92 DOM
-
2026-06-09days on market $379,000 Active 91 DOM
-
2026-06-08days on market $379,000 Active 90 DOM
-
2026-06-07days on market $379,000 Active 89 DOM
-
2026-06-05days on market $379,000 Active 86 DOM
-
2026-06-02days on market $379,000 Active 84 DOM
-
2026-06-01days on market $379,000 Active 83 DOM
-
2026-05-31days on market $379,000 Active 82 DOM
-
2026-05-30days on market $379,000 Active 81 DOM
-
2026-03-10$387,900 Active
-
2022-04-29soldstatus $360,000
-
2009-08-27soldstatus $106,000
ⓘ Source: listings_history table (triggers on properties + properties_extension) + one-shot
backfill from property_details.listing_events for pre-trigger history.
Tax reassessment forecast OK · Resets to sale price
- Current annual tax
- $3,564 · $297/mo
- Projected year-2 tax
- $3,564 · $297/mo
- Expected delta
- $0/yr ($0/mo · -0.0%)
ⓘ Screening estimate from a state-policy table — verify with the county assessor before closing.
Climate risk First Street
- Flood 1/10 Low FEMA zone X · 0% chance over 30 yrs
- Wildfire 5/10 Major
- Heat 6/10 Major 7 d/yr ≥109°F today · 21 d/yr by 30 yrs out
- Wind 4/10 Moderate 19% chance of damaging wind over 30 yrs
- Air quality 3/10 Moderate 3 unhealthy d/yr today · 3 by 30 yrs out
Nearby sold comps map
Loading sold comps map…
Walkable amenities ~0.75 mi
Loading nearby amenities…
Taxation est. · year 1
- Rental income
- $33,600
- − Mortgage interest
- −$21,230
- − Property taxes
- −$3,564
- − Insurance
- −$1,895
- − Repairs & maintenance
- −$2,688
- − Management
- −$2,688
- − Depreciation
- −$11,025
- Taxable loss
- −$9,490
- Est. tax savings @ 24.0%
- +$2,278
- After-tax cash flow
- $-488/yr
For passive investors: Depreciation is non-cash, so a rental often shows a tax loss while cash-flowing — sheltering income. Rental losses are passive: they offset passive income freely, and up to $25,000/yr can offset ordinary (W-2) income if you actively participate and your MAGI is under $100k (phasing out to $0 by $150k); unused losses carry forward. On sale, claimed depreciation is recaptured at up to 25%, and gains may owe capital-gains tax (a 1031 exchange can defer both). Figures are a year-1 estimate at your 24.0% rate — not tax advice; consult a CPA.
Schools (NCES district)
- District
- Kingston
- NCES district ID
- 4016590
- Math proficiency
- 27% ▼ -7.00%
- Reading proficiency
- 32% ▼ -7.00%
- Median HH income
- $40,655
- Composite
- 24.88/100
- National rank
- #7585
- State rank
- #70 of 270 in OK
Livability — New Woodville
- Score
- 49/100
- State rank
- #680
- US rank
- #25850
Category grades
Schools grade is shown separately in the Schools card above.
Census & demographics
- Population (ZIP)
- 7,011
Population outlook (Marshall County) Hauer SSP2
- Today (2025)
- 17,405 people
- By 2030
- 18,038 · +3.6%
- By 2040
- 19,513 · +12.1%
- By 2050
- 21,283 · +22.3%
- By 2075
- 27,884 · +60.2%
- By 2100
- 35,435 · +103.6%
Race, ethnicity, and origin ACS 2023
- Neighborhood character
- Predominantly White (75%)
- Race & ethnicity
- White 75% Two or more races 16% Native American 5% Hispanic / Latino 4%
- Common ancestry
- Lithuanian 3% Italian 2% Serbian 1%
- Foreign-born
- 1% · Canada
- Languages at home
- 97% English-only · Spanish 3%
Political lean MEDSL · Marshall
- 2024 margin
- Solid R (+63.4) · D 17.7% · R 81.2% · Other 1.1%
- 2008→2024 swing
- -24.6pp toward R · 2008: -38.8pp · 2024: -63.4pp
- All cycles
- 2024: R+63.4 2020: R+62.5 2016: R+56.6 2012: R+45.7 2008: R+38.8
Not yet ingested
- Civics
- —
Market trends
- HPI YoY
- ▲ 26.96%
- Current HPI
- 246.2253
- Rent YoY
- —
- Metro
- —
- State GDP YoY
- ▲ 1.55%
- F500 in state
- 6
Industry mix (Fortune 500 HQ in OK)
| Industry | F500 HQs | Revenue |
|---|---|---|
| Energy | 3 | $48B |
|
||
Price history
+265.9% since first listed3 events — show timeline
- 2026-03-10 Listed $387,900 MLS Technology, Inc.
- 2022-04-29 Sold (Public Records) $360,000 Public Records
- 2009-08-27 Sold (Public Records) $106,000 Public Records
Property tax history
+12.7%/yrLatest (2025): $3,564 · +5.9% YoY. Source: county tax records.
Cash-flow waterfall
monthlySold comps — $/sqft
last 12 mo · ≤1 miLoading sold comps…