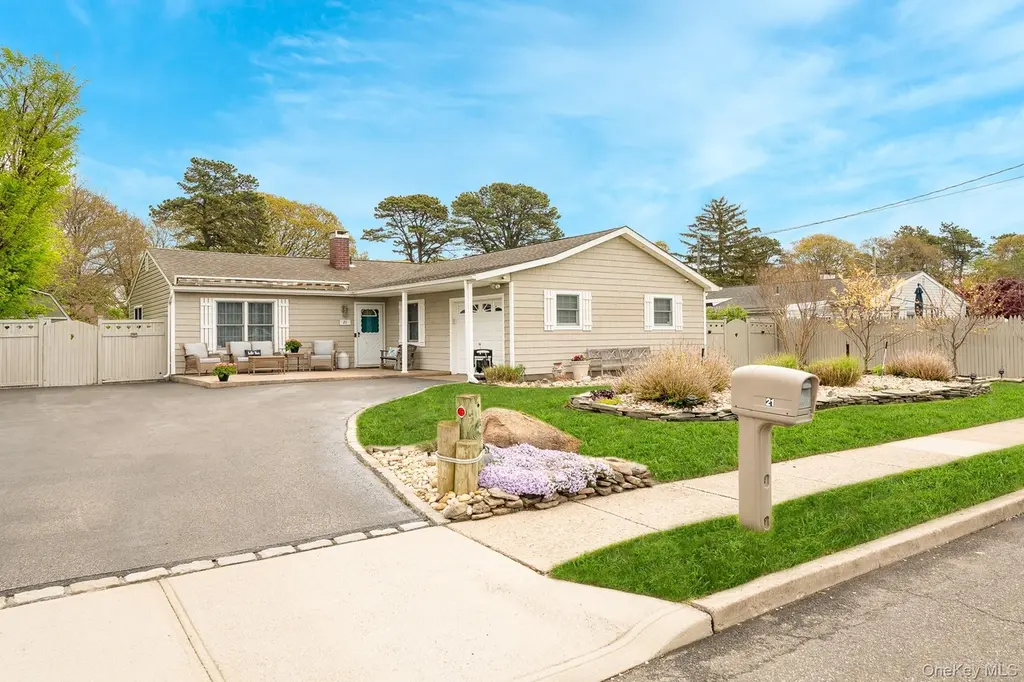
21 Eisenhower Rd · Centereach, NY
Flood risk 4/10 · Minor
- FEMA flood zone
- X (unshaded)
- Chance of flooding over 30 yrs
- 0.23%
- Est. flood insurance / yr
- $507 – $1,088
Fire risk 1/10 · Minimal
- Est. fire insurance / yr
- $691 – $1,283
Heat risk 5/10 · Moderate
- Hot days now (above 94°F)
- 7 days/yr
- Hot days in 30 yrs
- 17 days/yr
Wind risk 6/10 · Moderate
- Chance of severe wind over 30 yrs
- 72.0%
Air-quality risk 4/10 · Minor
- Unhealthy air days now
- 4 days/yr
- Unhealthy air days in 30 yrs
- 5 days/yr
Risk factors via First Street. Map © Google.
Why this score? — see what drove the D grade
The composite is a weighted blend of 9 inputs, each scored 0–100. Each bar is that input's sub-score; the figure is the points it added to the 100-point composite (weight × sub-score).
- ARV discount +15.0/15.0
- Cash flow +7.9/30.0
- Schools +5.3/10.0
- Livability +3.6/5.0
- 1% rule +2.8/10.0
- Rent growth +2.5/5.0
- Condition / age +2.5/5.0
- DSCR +1.9/10.0
- Appreciation +0.0/10.0
$569,900
🖨 Deal sheet 📄 Offer letter ✓ Due diligence
Listing remarks
Impeccably maintained & updated 3/4 bedroom Ranch near the end of a quiet dead-end street! This sun-drenched, open-concept home offers seamless one-level living with a warm, modern-rustic aesthetic. The spacious living & dining areas feature stylish wood-look flooring and a chic accent wall, flowing effortlessly into a large kitchen complete with oak cabinets, quartz countertops, and a double oven (as-is). Sliders open to a massive patio and a beautifully landscaped, fully fenced flat 1/4 acre—perfect for entertaining! Features a king-sized primary suite with a half bath & double closets, a large home office/den, and an updated main bath with a custom rain shower. Pa
Key facts
- Open-concept home
- Oak cabinets
- Large kitchen
Tags
Property features AI
Exterior
- Parking: Driveway parking; Off-street parking; Garage with garage door opener; Heated garage; Total parking for 5 vehicles; 1-car garage
- Security: Fire alarm; Smoke detectors; Security lights
- Utilities: PSEG electric; Cesspool sewer; Water available; Cable available; Public trash collection; Electricity available
- Home design: Single-family residence; Updated/remodeled condition; One level
- Construction: Vinyl siding; Slab foundation
- Exterior features: Covered patio and porch; Awnings; Garden and landscaped front and back yards; Exterior lighting; Mailbox; Rain gutters; Shed(s); Fenced yard with vinyl fencing; Sprinklers in front and rear; Level lot, near school
Interior
- Kitchen: Granite counters; Open kitchen; Dishwasher; Microwave; Electric range/oven; Refrigerator
- Bedrooms: First-floor bedroom
- Flooring: Carpet; Ceramic tile; Tile
- Bathrooms: One full bathroom; One half bathroom
- Heating & cooling: Baseboard heating (oil); Central air conditioning
- Interior features: First-floor bedroom and full bath included; Built-in features; Ceiling fans; Crown molding; Eat-in kitchen; Entrance foyer; Granite counters; High ceilings; Natural woodwork; Open floor plan with open kitchen; Primary bathroom; Recessed lighting; Smart thermostat; Storage
- Laundry & utility: Washer and dryer included; Washer hookup; Electric dryer hookup; Washer/dryer hookup in garage; Washer/Dryer hookup (in garage)
Neighborhood map
What this means for you Summary
Snapshot
- This is a 3-bed/1.5-bath single-family listed at $570k.
Deal economics
- At list price, monthly cash flow is $-619 ($-7k/yr) — negative.
- To cash-flow at today's rent, offer at most $461k (19.2% below list).
- To meet the 1% rule (rent ≥ 1% of price), the offer needs to be $447k (21.5% below list).
- Recommended offer: $447k (21.5% below list) — sets the bar for 1% rule.
- Cap rate 5.0% vs local median 3.8% in Centereach — meaningfully above typical; check what's discounted (condition, days-on-market, listing class) to confirm the premium yield is real.
Location & tenants
- Location reads 72/100 on livability (#362 in NY) — a middle-class / working-renter tenant base. Strengths: employment A+, housing A+, health & safety A+; Watch: amenities F, commute F, cost of living F.
- Middle Country Central School District (suburban): math 60% / reading 56% proficiency, ranked #217 of 590 in NY (top 37%) — acceptable for families but not a draw, mixed tenant base, ~2y average lease.
- Zoned schools: North Coleman Road School (math 50% / reading 50%, grade D, #1,085 of 2,108 statewide, top 56%, 344 students, 31% FRL); Dawnwood Middle School (math 37% / reading 46%, grade F, #394 of 729 statewide, top 55%, 1,074 students, 37% FRL); Centereach High School (math 84% / reading 77%, grade A, #506 of 1,100 statewide, top 46%, 1,475 students, 35% FRL).
- Market conditions: 147 active listings in the ZIP; 2 comparable units currently listed for rent nearby; high-income renter base; 1,366 units permitted in Suffolk County in 2024 (216 in 5+ unit buildings).
- This rent runs 40% of the median local income ($135k/yr) — at the standard rent-burdened threshold; future hikes will face affordability resistance.
Forward outlook
- Local home prices are declining (-3.0%/yr); year-one equity from $4k of loan paydown is wiped out by about $17k of value loss. Plan a longer hold.
- Suffolk County population projected to shrink 5% by 2050 — rents likely to lag national; underwrite the cash flow, not the appreciation.
Negotiation context
- It's been on market 36 days — a 3% lower offer ($553k) is reasonable based on typical stale-listing flexibility.
Risks & watch-outs
- Climate carrying-cost: major wind risk, 72% chance of damaging wind over 30y; extreme-heat days projected 7→17/yr by 2055 (HVAC capex compounding) — expect insurance premiums to compound above CPI over the hold.
Questions for the listing agent
- What do current leases actually rent for vs. the listed asking? Can we see a recent rent roll and the last 12 months of T-12 income?
- It's been on market 36 days. Have you received any prior offers? Is the seller open to a 22% concession, seller financing, or rate buy-down credit?
- Built in 1967 — when were the roof, HVAC, electrical panel, plumbing, and water heater last replaced?
- Is there a deadline driving the sale (1031 exchange, divorce, estate, relocation)? That informs how much negotiation room exists.
- Schools are B-rated — typically a magnet for longer-tenancy family renters. What's the average tenant stay here, and is there a school-zone premium baked into asking?
- The area grade is low — what's the realistic commute time and amenity access for the typical tenant pool here? Any planned neighborhood developments (good or bad) we should know about?
- What's the average days-on-market for RENTAL listings here right now (not sales)? A rising rental-DOM trend means longer vacancies and softer asking-rent achievability than the comps imply.
- What's the recent tenant-quality profile in this submarket — average credit score on applications, eviction rate, late-payment / NSF rate, and stable-employment percentage? A property-management company in the area should have these aggregated.
- How much new for-sale + rental construction is in the pipeline within 1–3 miles? Heavy new supply typically softens prices + rents 12–24 months out; constrained supply supports both.
Investment metrics
- 1% rule
- 0.78% ✗
- Cap rate
- 4.99%
- Cash-on-cash
- -4.65%
- DSCR
- 0.79
- GRM
- 10.6
CMA / ARV
- ARV (median comp)
- $685,552
- List price
- $569,900
- Delta
- -16.87%
- Verdict
- UNDERPRICED
- Comps
- 20 within 1.0 mi
Show comp detail 12 sales within ~0.75 mi
| Address | Dist | Beds/Ba | Sqft | Sold | Price | $/sf | Match |
|---|---|---|---|---|---|---|---|
| 8 Elwood Rd | 0.41mi | 3/2.0 | 1,368 (-1%) | 2mo | $680,000 | $497 | 76 |
| 1 Washington Ave | 0.34mi | 3/2.0 | 1,333 (-3%) | 6mo | $720,000 | $540 | 71 |
| 42 Holiday Park Dr | 0.61mi | 3/2.0 | 1,400 (+1%) | 4mo | $620,000 | $443 | 64 |
| 7 Winston Rd | 0.46mi | 3/1.0 | 1,280 (-7%) | 4mo | $610,000 | $477 | 61 |
| 23 Holiday Park Dr | 0.55mi | 4/1.5 (+1) | 1,443 (+5%) | 4mo | $525,000 | $364 | 58 |
| 358 Eastwood Blvd | 0.54mi | 4/2.0 (+1) | 1,451 (+5%) | 6mo | $640,000 | $441 | 54 |
| 21 Jackson Ave | 0.39mi | 4/1.0 (+1) | 1,200 (-13%) | 4mo | $585,000 | $488 | 50 |
| 11 Starfire Dr | 0.62mi | 3/2.0 | 1,488 (+8%) | 8mo | $486,000 | $327 | 49 |
| 32 Garden Ln | 0.67mi | 4/2.0 (+1) | 1,320 (-4%) | 8mo | $670,000 | $508 | 48 |
| 90 Selden Blvd | 0.67mi | 3/2.5 | 1,251 (-9%) | 2mo | $635,000 | $508 | 48 |
| 3 Bellrose Ave | 0.62mi | 4/2.0 (+1) | 1,545 (+12%) | 4mo | $675,000 | $437 | 41 |
| 343 Eastwood Blvd | 0.57mi | 4/2.0 (+1) | 1,200 (-13%) | 9mo | $645,000 | $538 | 37 |
Match score weights: distance 35% · size 25% · config 20% · recency 20%. Top-matched comps best support the ARV.
Projected returns pro-forma
-3.0% appreciation · 3.0% rent growth · sell at horizon
- IRR
- -24.1%
- Equity multiple
- 0.18×
- Total profit
- $-131,550
- Equity at exit
- $84,974
- IRR
- -19.3%
- Equity multiple
- -0.03×
- Total profit
- $-164,479
- Equity at exit
- $49,275
Cash invested: $159,572 (down + closing). Projections, not guarantees.
Landlord ↔ Tenant lean methodology
- Overall (STATE)
- 15 Strongly Tenant-Friendly
- State New York
- 15 Strongly Tenant-Friendly · D+10
- County
- — inherits STATE
- City
- — inherits STATE
ZIP-level market 11720
- Active inventory
- 147
- Price-to-rent
- 10.6×
Monthly cashflow live
- Estimated rent
- $4,473 medium interval (Pro) →
- Mortgage (P&I)
- −$2,989
- Tax from tax record
- −$926 /mo · $11,111/yr
- Insurance
- −$237
- HOA
- −$0
- Vacancy / Maint / Mgmt
- −$939
- Net cashflow
- $-619
Break-even live
UW: 25.0% down · 7.5% · 30yr · 1.5% tax · 5.0% vac · 8.0% maint · 8.0% mgmt
Financing live
Cash to close
- Down payment
- $142,475
- Closing costs
- $17,097
- Reserves months
- —
- Total cash needed
- —
Loan-product check · same deal, 3 products live
Conventional
25% down · 7.5% · 30yr
- Down + closing
- —
- Monthly P&I
- —
- Monthly cashflow
- —
- DSCR
- —
- Eligible?
- —
Personal DTI + credit; lowest rate.
DSCR
20% down · 8.5% · 30yr
- Down + closing
- —
- Monthly P&I
- —
- Monthly cashflow
- —
- DSCR
- —
- Eligible?
- —
No personal income docs; deal must DSCR.
Hard money
10% down · 12.0% · 12mo
- Down + closing
- —
- Monthly P&I
- —
- Monthly cashflow
- —
- DSCR
- —
- Eligible?
- —
Short-term bridge; refi at stabilization.
Rent comps 2 comps
| Address | Beds | Baths | Sqft | Rent | $/sqft | DOM | Units | Dist |
|---|---|---|---|---|---|---|---|---|
| 1275 Middle Country Rd Selden, NY | 2.0 | 2.0–2.5 | 1594 | $3,825 | $2.40 | 1d | 1 | 1.25mi |
| 64 Neal Path Centereach, NY | 1.0–3.0 | 2.0 | 1252 | $4,270 | $3.41 | 1d | 1 | 1.32mi |
Listing history 14 events
-
2026-06-18days on market $569,900 Active 36 DOM
-
2026-06-17days on market $569,900 Active 35 DOM
-
2026-06-16days on market $569,900 Active 34 DOM
-
2026-06-15days on market $569,900 Active 33 DOM
-
2026-06-13pricedays on market $569,900 Active 31 DOM
-
2026-06-09days on market $599,990 Active 27 DOM
-
2026-06-08days on market $599,990 Active 26 DOM
-
2026-06-07days on market $599,990 Active 25 DOM
-
2026-06-04days on market $599,990 Active 22 DOM
-
2026-06-03days on market $599,990 Active 21 DOM
-
2026-06-02days on market $599,990 Active 20 DOM
-
2026-06-01days on market $599,990 Active 19 DOM
-
2026-05-31days on market $599,990 Active 18 DOM
-
2026-05-13$599,990 Active 1232-char remark
ⓘ Source: listings_history table (triggers on properties + properties_extension) + one-shot
backfill from property_details.listing_events for pre-trigger history.
Tax reassessment forecast NY · Partial reset (capped growth)
- Current annual tax
- $11,111 · $926/mo
- Projected year-2 tax
- $11,111 · $926/mo
- Expected delta
- $0/yr ($0/mo · 0.0%)
ⓘ Screening estimate from a state-policy table — verify with the county assessor before closing.
Climate risk First Street
- Flood 4/10 Moderate FEMA zone X (unshaded) · 23% chance over 30 yrs
- Wildfire 1/10 Low
- Heat 5/10 Major 7 d/yr ≥94°F today · 17 d/yr by 30 yrs out
- Wind 6/10 Major 72% chance of damaging wind over 30 yrs
- Air quality 4/10 Moderate 4 unhealthy d/yr today · 5 by 30 yrs out
Nearby sold comps map
Loading sold comps map…
Walkable amenities ~0.75 mi
Loading nearby amenities…
Taxation est. · year 1
- Rental income
- $53,671
- − Mortgage interest
- −$31,923
- − Property taxes
- −$11,111
- − Insurance
- −$2,850
- − Repairs & maintenance
- −$4,294
- − Management
- −$4,294
- − Depreciation
- −$16,579
- Taxable loss
- −$17,379
- Est. tax savings @ 24.0%
- +$4,171
- After-tax cash flow
- $-3,253/yr
For passive investors: Depreciation is non-cash, so a rental often shows a tax loss while cash-flowing — sheltering income. Rental losses are passive: they offset passive income freely, and up to $25,000/yr can offset ordinary (W-2) income if you actively participate and your MAGI is under $100k (phasing out to $0 by $150k); unused losses carry forward. On sale, claimed depreciation is recaptured at up to 25%, and gains may owe capital-gains tax (a 1031 exchange can defer both). Figures are a year-1 estimate at your 24.0% rate — not tax advice; consult a CPA.
Schools (NCES district)
- District
- Middle Country Central School District
- NCES district ID
- 3619200
- Math proficiency
- 60% ▼ -1.00%
- Reading proficiency
- 56% ▼ -5.00%
- Median HH income
- $86,140
- Composite
- 52.89/100
- National rank
- #1532
- State rank
- #217 of 590 in NY
Livability — Centereach
- Score
- 72/100
- State rank
- #362
- US rank
- #6174
Category grades
Schools grade is shown separately in the Schools card above.
Census & demographics
- Census place
- Centereach, NY
- County
- Suffolk County · 679,920 people
- City population
- 29,292
- Metro
- New York-Newark-Jersey City, NY-NJ-PA
- Population (ZIP)
- 29,292
- Household income
- $134,898
- Rent vs Own
- Severe rent burden
- 436.0
Population outlook (Suffolk County) Hauer SSP2
- Today (2025)
- 1,505,262 people
- By 2030
- 1,498,318 · -0.5%
- By 2040
- 1,471,101 · -2.3%
- By 2050
- 1,424,848 · -5.3%
- By 2075
- 1,337,157 · -11.2%
- By 2100
- 1,217,720 · -19.1%
Race, ethnicity, and origin ACS 2023
- Neighborhood character
- Predominantly White (69%)
- Race & ethnicity
- White 69% Hispanic / Latino 15% Asian 7% Two or more races 7% Black 6%
- Hispanic origin (detail)
- Mexican 1% Puerto Rican 5%
- Common ancestry
- Romanian 4% Scotch-Irish 2% Lithuanian 2%
- Foreign-born
- 15% · Canada, China, Jamaica
- Languages at home
- 82% English-only · Spanish 8% Other Indo-European 3% Other Asian/Pacific 2%
Political lean MEDSL · Suffolk
- 2024 margin
- Lean R (+10.0) · D 45.0% · R 55.0%
- 2008→2024 swing
- -16.0pp toward R · 2008: 6.0pp · 2024: -10.0pp
- All cycles
- 2024: R+10.0 2020: R+0.0 2016: R+8.2 2012: D+2.9 2008: D+6.0
Not yet ingested
- Civics
- —
Market trends
- HPI YoY
- ▼ -633.07%
- Current HPI
- 347.7369
- Rent YoY
- —
- Metro
- New York-Newark-Jersey City, NY-NJ-PA
- State GDP YoY
- ▲ 2.60%
- F500 in state
- 92
Industry mix (Fortune 500 HQ in NY)
| Industry | F500 HQs | Revenue |
|---|---|---|
| Financial Services | 10 | $950B |
|
||
| Consumer Goods | 9 | $162B |
|
||
| Insurance | 4 | $225B |
|
||
| Telecommunications | 2 | $144B |
|
||
| Pharmaceuticals | 2 | $112B |
|
||
| Media / Entertainment | 2 | $69B |
|
||
Price history
-5.0% since first listed2 events — show timeline
- 2026-06-11 Price Changed $569,900 OneKey® MLS as Distributed by MLS Grid
- 2026-05-13 Listed $599,990 OneKey® MLS as Distributed by MLS Grid
Property tax history
+2.9%/yrLatest (2025): $11,111 · +0.0% YoY. Source: county tax records.
Cash-flow waterfall
monthlySold comps — $/sqft
last 12 mo · ≤1 miLoading sold comps…