10609 W Abram Ln · Boise City, ID
Flood risk 6/10 · Moderate
- FEMA flood zone
- X (unshaded)
- Chance of flooding over 30 yrs
- 0.73%
- Est. flood insurance / yr
- $507 – $1,088
Fire risk 1/10 · Minimal
- Est. fire insurance / yr
- $584 – $1,086
Heat risk 4/10 · Minor
- Hot days now (above 96°F)
- 7 days/yr
- Hot days in 30 yrs
- 16 days/yr
Wind risk 1/10 · Minimal
- Chance of severe wind over 30 yrs
- —
Air-quality risk 8/10 · Major
- Unhealthy air days now
- 14 days/yr
- Unhealthy air days in 30 yrs
- 19 days/yr
Risk factors via First Street. Map © Google.
Why this score? — see what drove the B grade
The composite is a weighted blend of 9 inputs, each scored 0–100. Each bar is that input's sub-score; the figure is the points it added to the 100-point composite (weight × sub-score).
- Cash flow +26.6/30.0
- ARV discount +15.0/15.0
- DSCR +9.1/10.0
- 1% rule +7.2/10.0
- Schools +5.2/10.0
- Rent growth +3.5/5.0
- Condition / age +2.8/5.0
- Livability +2.5/5.0
- Appreciation +0.0/10.0
$134,500
🖨 Deal sheet 📄 Offer letter ✓ Due diligence
Listing remarks
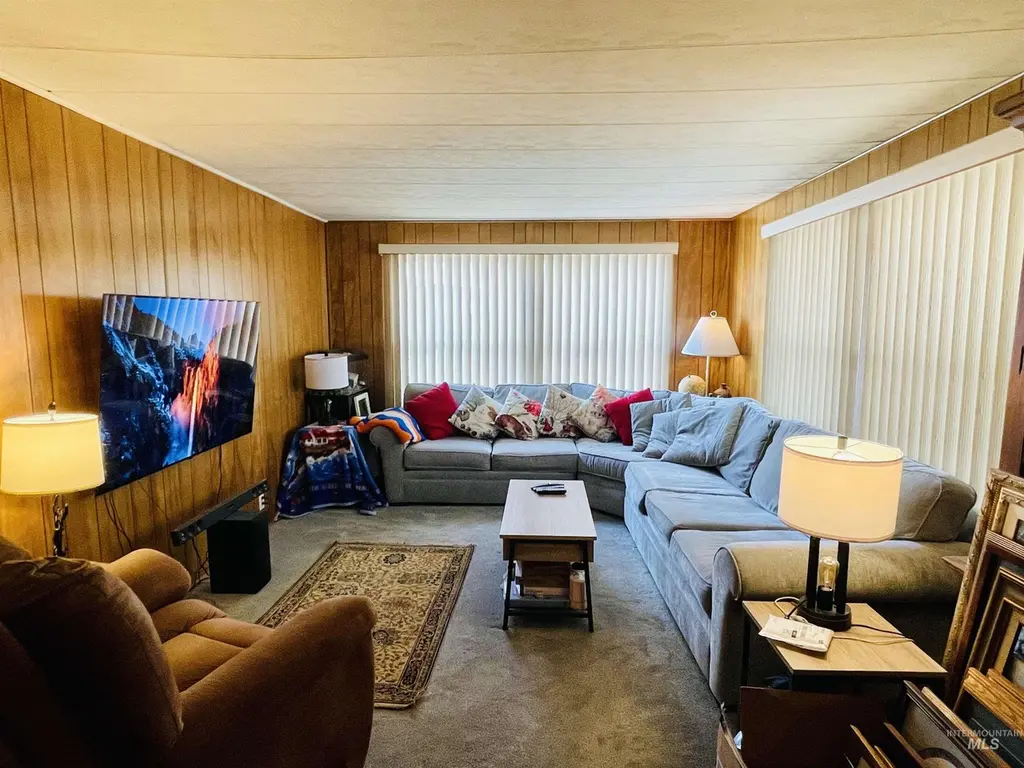
Welcome to this well-maintained and thoughtfully upgraded 2-bedroom, 2-bath manufactured home offering comfort, style, and convenience. The primary suite provides a private retreat with a generously sized bedroom and en-suite bathroom, while the second bedroom and additional full bath offer endless flexibility for guests, a home office, or hobbies. A long list of recent upgrades ensures peace of mind and true move-in-ready convenience. Enjoy outdoor living on the inviting porch—perfect for morning coffee or relaxing evenings. Located in a desirable community with easy access to shopping, dining, and local amenities, this home is ideal for those seeking affordability without sacrificin
Key facts
- Private retreat
- En-suite bathroom
- Local amenities
Tags
Property features AI
Finance
- Other: Located in a mobile home park; Private paved road frontage
Exterior
- Parking: Carport (1 covered space); Finished driveway; Total 1 parking space
- Utilities: City water service; Sewer connected; Broadband internet
- Home design: Mobile/manufactured home on a rented lot; Built in 1971
- Construction: Frame construction
- Exterior features: Covered patio/deck; Metal and wood fencing; Storage shed; Garden; Auto sprinkler system; Winter access
Interior
- Kitchen: Dishwasher; Built-in oven/range; Refrigerator; Disposal; Water softener (owned)
- Bedrooms: 2 bedrooms, both on the main level
- Flooring: Carpet
- Bathrooms: 2 bathrooms
- Heating & cooling: Forced air heating; Central air conditioning
- Interior features: Primary bedroom with private bath; Primary bedroom on the main level; Utility room on the main level
- Laundry & utility: Utility room on main level
Neighborhood map
What this means for you Summary
Snapshot
- This is a 2-bed/2.0-bath manufactured listed at $134k. Condition is rated average.
Deal economics
- At list price, monthly cash flow is $362 ($4k/yr) — positive.
- The deal already cash-flows at list — no discount required.
- Meets the 1% rule at list price ($2k rent vs $134k).
- Recommended offer: $126k (6.0% below list) — sets the bar for market timing.
- Cap rate 9.5% vs local median 2.6% in Boise City — top-decile yield for the area; either an underpriced asset or a hidden risk that comps aren't pricing in. Stress-test before assuming the spread holds.
Location & tenants
- Location reads: area grade B — affects rentability + tenant quality, not the cash-flow math above.
- Joint School District No. 2 (suburban): math 53% / reading 67% proficiency, ranked #11 of 92 in ID (top 12%) — acceptable for families but not a draw, mixed tenant base, ~2y average lease.
- Zoned schools: Ustick Elementary School (math 32% / reading 37%, grade F, #272 of 357 statewide, top 80%, 357 students, 60% FRL); Centennial High School (math 53% / reading 76%, grade B-, #10 of 169 statewide, top 7%, 1,931 students, 22% FRL) — zoned schools average 41% FRL vs 23% district-wide (18 pts higher); higher-poverty schools than district average — tighter screening recommended.
- Market conditions: Rents rising fast (+4.0%/yr); 135 active listings in the ZIP; 22 comparable units currently listed for rent nearby; rentals at typical pace (median 14d on market — plan ~3-4 weeks tenant-placement turnaround); solid renter incomes; 5,129 units permitted in Ada County in 2024 (414 in 5+ unit buildings).
Forward outlook
- Local home prices are declining (-3.0%/yr); year-one equity from $930 of loan paydown is wiped out by about $4k of value loss. Plan a longer hold.
- Ada County population projected at +45% by 2050 — long-run rental-demand tailwind backs the buy-and-hold thesis.
- At projected returns (-3.0% appreciation + 4.0% rent growth), your $38k cash investment doubles in ~9 years — after that, you're playing with house money.
Negotiation context
- It's been on market 61 days — a 6% lower offer ($126k) is reasonable based on typical stale-listing flexibility.
Risks & watch-outs
- Climate carrying-cost: major flood risk — expect insurance premiums to compound above CPI over the hold.
Questions for the listing agent
- It's been on market 61 days. Have you received any prior offers? Is the seller open to a 6% concession, seller financing, or rate buy-down credit?
- Built in 1971 — when were the roof, HVAC, electrical panel, plumbing, and water heater last replaced?
- Why hasn't it sold? Are there any deal-killer items the seller is aware of (foundation, flood, title, zoning, code violations)?
- Is there a deadline driving the sale (1031 exchange, divorce, estate, relocation)? That informs how much negotiation room exists.
- What's the average days-on-market for RENTAL listings here right now (not sales)? A rising rental-DOM trend means longer vacancies and softer asking-rent achievability than the comps imply.
- What's the recent tenant-quality profile in this submarket — average credit score on applications, eviction rate, late-payment / NSF rate, and stable-employment percentage? A property-management company in the area should have these aggregated.
- How much new for-sale + rental construction is in the pipeline within 1–3 miles? Heavy new supply typically softens prices + rents 12–24 months out; constrained supply supports both.
Investment metrics
- 1% rule
- 1.22% ✓
- Cap rate
- 9.52%
- Cash-on-cash
- 11.53%
- DSCR
- 1.51
- GRM
- 6.9
CMA / ARV
- ARV (on-the-fly)
- $162,432
- Comps found
- 7
Show comp detail 7 sales within ~0.75 mi
| Address | Dist | Beds/Ba | Sqft | Sold | Price | $/sf | Match |
|---|---|---|---|---|---|---|---|
| 10614 W Macaw Ln | 0.07mi | 3/2.0 (+1) | 1,140 (-1%) | 1mo | $110,000 | $96 | 89 |
| 10701 W Java Dr | 0.08mi | 2/2.0 | 1,152 (0%) | 9mo | $239,000 | $207 | 89 |
| 10734 W Ardyce Ln #9 | 0.12mi | 3/2.0 (+1) | 1,168 (+1%) | 16mo | $59,500 | $51 | 74 |
| 10565 W Halstead Dr | 0.49mi | 2/2.0 | 1,248 (+8%) | 2mo | $199,000 | $159 | 62 |
| 10014 Dewitt Ln | 0.47mi | 3/2.0 (+1) | 1,248 (+8%) | 4mo | $149,900 | $120 | 55 |
| 2876 N Mitchell St | 0.56mi | 2/2.0 | 1,100 (-4%) | 16mo | $299,000 | $272 | 53 |
| 9659 W Woodland Ln | 0.64mi | 3/2.0 (+1) | 1,296 (+12%) | 20mo | $182,900 | $141 | 28 |
Match score weights: distance 35% · size 25% · config 20% · recency 20%. Top-matched comps best support the ARV.
Projected returns pro-forma
-3.0% appreciation · 4.01% rent growth · sell at horizon
- IRR
- 2.0%
- Equity multiple
- 1.08×
- Total profit
- $2,948
- Equity at exit
- $20,054
- IRR
- 12.6%
- Equity multiple
- 2.05×
- Total profit
- $39,363
- Equity at exit
- $11,629
Cash invested: $37,660 (down + closing). Projections, not guarantees.
Landlord ↔ Tenant lean methodology
- Overall (STATE)
- 91 Strongly Landlord-Friendly
- State Idaho
- 91 Strongly Landlord-Friendly · R+18
- County
- — inherits STATE
- City
- — inherits STATE
ZIP-level market 83713
- Home prices YoY
- -26.5%
- Rents YoY
- 4.0%
- Active inventory
- 135
- Price-to-rent
- 6.9×
Monthly cashflow live
- Estimated rent
- $1,634 high interval (Pro) →
- Mortgage (P&I)
- −$705
- Tax est. 1.5%
- −$168 /mo · $2,018/yr
- Insurance
- −$56
- HOA
- −$0
- Vacancy / Maint / Mgmt
- −$343
- Net cashflow
- $362
Break-even live
UW: 25.0% down · 7.5% · 30yr · 1.5% tax · 5.0% vac · 8.0% maint · 8.0% mgmt
Financing live
Cash to close
- Down payment
- $33,625
- Closing costs
- $4,035
- Reserves months
- —
- Total cash needed
- —
Loan-product check · same deal, 3 products live
Conventional
25% down · 7.5% · 30yr
- Down + closing
- —
- Monthly P&I
- —
- Monthly cashflow
- —
- DSCR
- —
- Eligible?
- —
Personal DTI + credit; lowest rate.
DSCR
20% down · 8.5% · 30yr
- Down + closing
- —
- Monthly P&I
- —
- Monthly cashflow
- —
- DSCR
- —
- Eligible?
- —
No personal income docs; deal must DSCR.
Hard money
10% down · 12.0% · 12mo
- Down + closing
- —
- Monthly P&I
- —
- Monthly cashflow
- —
- DSCR
- —
- Eligible?
- —
Short-term bridge; refi at stabilization.
Rent comps 22 comps
| Address | Beds | Baths | Sqft | Rent | $/sqft | DOM | Units | Dist |
|---|---|---|---|---|---|---|---|---|
| 10887 W Ustick Rd Boise, ID | 2.0–3.0 | 1.0–2.0 | 874 | $1,345 | $1.54 | 2d | 3 | 0.33mi |
| 10811 W Ustick Rd Boise, ID | 2.0 | 1.0 | 794 | $1,345 | $1.69 | 21d | 1 | 0.34mi |
| 10222 W Ustick Rd Boise, ID | 2.0 | 2.0 | 1010 | $1,575 | $1.56 | 23d | 1 | 0.43mi |
| 3325 N Covered Wagon Way Boise, ID | 3.0 | 2.0 | 1200 | $2,050 | $1.71 | 23d | 1 | 0.49mi |
| 10096 W Garverdale Ln Boise, ID | 3.0 | 2.0 | 1113 | $1,600 | $1.44 | 23d | 1 | 0.65mi |
| 10105 W Garverdale Ln Ste 201 Boise, ID | 2.0 | 2.0 | 915 | $1,350 | $1.48 | 14d | 1 | 0.69mi |
| 11383 W Fairview Ave Boise, ID | 2.0 | 2.0 | 1123 | $1,575 | $1.40 | 2d | 4 | 0.81mi |
| 11239 W Gabrielle Dr Boise, ID | 2.0 | 2.5 | 1128 | $1,645 | $1.46 | 23d | 1 | 0.87mi |
| 9846 W Rosecroft Ct #102 Boise, ID | 2.0 | 2.5 | 1236 | $1,545 | $1.25 | 3d | 1 | 0.88mi |
| 9993 W Rosecroft Ct #101 Boise, ID | 2.0 | 2.5 | 1136 | $1,575 | $1.39 | 3d | 1 | 0.89mi |
| 9169 W Cory Ln #202 Boise, ID | 2.0 | 1.5 | 968 | $1,395 | $1.44 | 21d | 1 | 0.95mi |
| 2663 N Fastwater Ave Boise, ID | 3.0 | 2.0 | 1204 | $1,795 | $1.49 | 14d | 1 | 0.95mi |
| 2555 N Workland Ln Unit 202 Boise, ID | 2.0 | 1.0 | 800 | $1,325 | $1.66 | 14d | 1 | 0.99mi |
| 9131 W Ustick Rd Unit 104 Boise, ID | 2.0 | 2.0 | 1000 | $1,595 | $1.59 | 11d | 1 | 1.00mi |
| 9113 W Ustick Rd Unit 102 Boise, ID | 2.0 | 2.0 | 1000 | $1,525 | $1.52 | 23d | 1 | 1.01mi |
| 11703 W Ginger Creek Dr Boise, ID | 3.0 | 2.0 | 1366 | $2,000 | $1.46 | 2d | 1 | 1.01mi |
| 10764 W Goldenrod Ave Boise, ID | 3.0 | 2.0 | 1220 | $1,895 | $1.55 | 19d | 1 | 1.11mi |
| 3909 N Patricia Ln Unit 1547101P Boise, ID | 2.0 | 1.0 | 818 | $4,200 | $5.13 | 2d | 1 | 1.14mi |
| 3911 N Patricia Ln Unit 1547109P Boise, ID | 2.0 | 1.0 | 818 | $4,431 | $5.42 | 2d | 1 | 1.14mi |
| 4418 N Oxbow Pl Boise, ID | 3.0 | 2.0 | 1120 | $2,095 | $1.87 | 14d | 1 | 1.15mi |
| 10077 W Rifleman Ln Unit 103 Boise, ID | 2.0 | 2.0 | 860 | $1,395 | $1.62 | 11d | 1 | 1.21mi |
| 9130 W Irving St Boise, ID | 2.0 | 1.5 | 952 | $1,575 | $1.65 | 3d | 5 | 1.31mi |
Listing history 15 events
-
2026-06-18days on market $134,500 Active 61 DOM
-
2026-06-17price $134,500 Active 60 DOM
-
2026-06-17days on market $135,000 Active 60 DOM
-
2026-06-16days on market $135,000 Active 59 DOM
-
2026-06-15days on market $135,000 Active 58 DOM
-
2026-06-13days on market $135,000 Active 56 DOM
-
2026-06-10days on market $135,000 Active 53 DOM
-
2026-06-09days on market $135,000 Active 52 DOM
-
2026-06-08days on market $135,000 Active 51 DOM
-
2026-06-07days on market $135,000 Active 50 DOM
-
2026-06-03days on market $135,000 Active 46 DOM
-
2026-06-03days on market $135,000 Active 45 DOM
-
2026-06-01days on market $135,000 Active 44 DOM
-
2026-05-31days on market $135,000 Active 43 DOM
-
2026-04-18$135,000 Active
ⓘ Source: listings_history table (triggers on properties + properties_extension) + one-shot
backfill from property_details.listing_events for pre-trigger history.
Climate risk First Street
- Flood 6/10 Major FEMA zone X (unshaded) · 73% chance over 30 yrs
- Wildfire 1/10 Low
- Heat 4/10 Moderate 7 d/yr ≥96°F today · 16 d/yr by 30 yrs out
- Wind 1/10 Low
- Air quality 8/10 Severe 14 unhealthy d/yr today · 19 by 30 yrs out
Nearby sold comps map
Loading sold comps map…
Walkable amenities ~0.75 mi
Loading nearby amenities…
Taxation est. · year 1
- Rental income
- $19,614
- − Mortgage interest
- −$7,534
- − Property taxes
- −$2,018
- − Insurance
- −$672
- − Repairs & maintenance
- −$1,569
- − Management
- −$1,569
- − Depreciation
- −$3,913
- Taxable income
- $2,339
- Est. tax owed @ 24.0%
- −$561
- After-tax cash flow
- $3,780/yr
For passive investors: Depreciation is non-cash, so a rental often shows a tax loss while cash-flowing — sheltering income. Rental losses are passive: they offset passive income freely, and up to $25,000/yr can offset ordinary (W-2) income if you actively participate and your MAGI is under $100k (phasing out to $0 by $150k); unused losses carry forward. On sale, claimed depreciation is recaptured at up to 25%, and gains may owe capital-gains tax (a 1031 exchange can defer both). Figures are a year-1 estimate at your 24.0% rate — not tax advice; consult a CPA.
Condition & rehab AI · 12 photos
This well-maintained manufactured home offers a comfortable living space with recent upgrades. Simple repairs and updates can significantly enhance its resale and rental value.
Repairs flagged
- Minor kitchen cabinets — Worn but still functional
- Minor bathroom fixtures — Dated but still functional
- Minor exterior siding — Aging but still structurally sound
Value-add opportunities
- Resale Paint interior walls — Fresh paint enhances curb appeal
- Resale Replace worn carpet — Fresh carpet improves comfort and appearance
- Resale Update kitchen cabinets — Modern cabinets increase appeal
- Resale Update bathroom fixtures — Modern fixtures improve functionality and appearance
- Both Landscaping — Landscaping enhances curb appeal and outdoor living space
Renovation cost estimate screening
| Repair item | Severity | Est. cost |
|---|---|---|
| kitchen cabinets · Worn but still functional | Minor | $500–3,000 |
| bathroom fixtures · Dated but still functional | Minor | $500–3,000 |
| exterior siding · Aging but still structurally sound | Minor | $500–3,000 |
| Total estimated repair cost · 3 items | $1,500–9,000 |
Value-add ROI direction
- Resale Paint interior walls — Fresh paint enhances curb appeal ↑
- Resale Replace worn carpet — Fresh carpet improves comfort and appearance ↑
- Resale Update kitchen cabinets — Modern cabinets increase appeal ↑
- Resale Update bathroom fixtures — Modern fixtures improve functionality and appearance ↑
- Both Landscaping — Landscaping enhances curb appeal and outdoor living space ↑
ⓘ Cost ranges are severity-bucket heuristics (US national rule-of-thumb). Get contractor quotes + a written scope before underwriting a rehab budget.
Schools (NCES district)
- District
- Joint School District No. 2
- NCES district ID
- 1602100
- Math proficiency
- 53% ▼ -6.00%
- Reading proficiency
- 67% ▼ -1.00%
- Median HH income
- $64,573
- Composite
- 52.42/100
- National rank
- #1576
- State rank
- #11 of 92 in ID
Livability — Boise City
No livability data for this city. (Only ~50 U.S. cities are tracked.)
Census & demographics
- Census place
- Boise City, ID
- County
- Ada County · 522,161 people
- City population
- 152,689
- Metro
- Boise City, ID
- Population (ZIP)
- 31,549
- Household income
- $91,295
- Rent vs Own
- Severe rent burden
- 805.0
Population outlook (Ada County) Hauer SSP2
- Today (2025)
- 535,818 people
- By 2030
- 585,751 · +9.3%
- By 2040
- 682,435 · +27.4%
- By 2050
- 775,818 · +44.8%
- By 2075
- 994,458 · +85.6%
- By 2100
- 1,148,884 · +114.4%
Race, ethnicity, and origin ACS 2023
- Neighborhood character
- Predominantly White (79%)
- Race & ethnicity
- White 79% Two or more races 10% Hispanic / Latino 10% Asian 3% Black 1%
- Hispanic origin (detail)
- Mexican 8%
- Common ancestry
- Portuguese 4% Slovak 2% Lithuanian 2%
- Foreign-born
- 9% · Canada, Jamaica, China
- Languages at home
- 87% English-only · Spanish 7% Other Indo-European 2% German/W. Germanic 1%
Political lean MEDSL · Ada
- 2024 margin
- R (+10.3) · D 43.4% · R 53.8% · Other 2.8%
- 2008→2024 swing
- -4.2pp toward R · 2008: -6.2pp · 2024: -10.3pp
- All cycles
- 2024: R+10.3 2020: R+3.9 2016: R+9.2 2012: R+11.3 2008: R+6.2
Not yet ingested
- Civics
- —
Market trends
- HPI YoY
- ▼ -122.31%
- Current HPI
- 338.9271
- Rent YoY
- ▲ 4.01%
- Metro
- Boise City, ID
- State GDP YoY
- ▲ 4.51%
- F500 in state
- 6
Industry mix (Fortune 500 HQ in ID)
| Industry | F500 HQs | Revenue |
|---|---|---|
| Retail | 1 | $79B |
|
||
| Technology | 1 | $25B |
|
||
| Food / Agriculture | 1 | $6B |
|
||
Price history
1 event — show timeline
- 2026-04-18 Listed $135,000 IMLS
Cash-flow waterfall
monthlySold comps — $/sqft
last 12 mo · ≤1 miLoading sold comps…