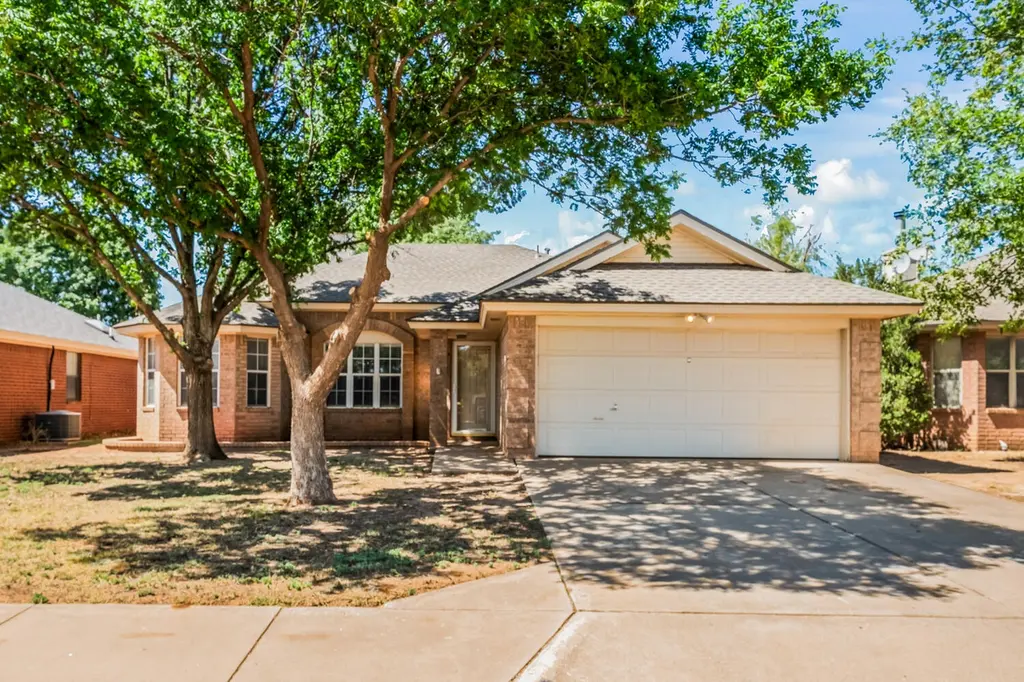
2222 96th St · Lubbock, TX
Flood risk 1/10 · Minimal
- FEMA flood zone
- X (unshaded)
- Chance of flooding over 30 yrs
- 0.0%
- Est. flood insurance / yr
- $507 – $1,088
Fire risk 1/10 · Minimal
- Est. fire insurance / yr
- $1,222 – $2,270
Heat risk 5/10 · Moderate
- Hot days now (above 99°F)
- 7 days/yr
- Hot days in 30 yrs
- 20 days/yr
Wind risk 2/10 · Minimal
- Chance of severe wind over 30 yrs
- —
Air-quality risk 2/10 · Minimal
- Unhealthy air days now
- 1 days/yr
- Unhealthy air days in 30 yrs
- 1 days/yr
Risk factors via First Street. Map © Google.
Why this score? — see what drove the D- grade
The composite is a weighted blend of 9 inputs, each scored 0–100. Each bar is that input's sub-score; the figure is the points it added to the 100-point composite (weight × sub-score).
- Cash flow +12.1/30.0
- ARV discount +7.5/15.0
- Livability +4.0/5.0
- 1% rule +3.7/10.0
- DSCR +3.6/10.0
- Schools +3.1/10.0
- Rent growth +3.0/5.0
- Condition / age +2.5/5.0
- Appreciation +0.0/10.0
$175,000
🖨 Deal sheet 📄 Offer letter ✓ Due diligence
Listing remarks
Welcome to an affordable wonderfully updated home ready for its new owner. All new flooring, new interior paint and updated hardware throughout. Large windows in the Living Room allow great lighting and the Kitchen provides ample cabinet space. Isolated Primary Bedroom offers great closet space and ensuite bath! Hard to find a quality conditioned home at this price. .. come make this home yours today!
Key facts
- Large windows
- New flooring
- Updated hardware
Tags
Property features AI
Exterior
- Parking: Attached garage (2 spaces); Driveway; Concrete parking surfaces
- Security: Smoke detectors
- Utilities: Public water; Public sewer; Electricity connected; Water connected; Sewer connected
- Home design: Single-family residence; Updated/remodeled
- Construction: Brick construction; Composition roof; Slab foundation; Built area above grade: 1,288
- Exterior features: Private yard; Storage structure; Full wood fencing in back yard
Interior
- Kitchen: Range; Free-standing range; Electric oven; Oven; Microwave; Dishwasher; Refrigerator; Electric water heater
- Flooring: Carpet; Tile; Vinyl
- Bathrooms: 2 full bathrooms
- Heating & cooling: Central heating; Central air; Electric cooling; Ceiling fans
- Interior features: Ceiling fans; Pantry; Walk-in closets; Blinds; Wood-burning fireplace in the living room
- Laundry & utility: Laundry room with washer and dryer hookups (electric dryer hookup)
Neighborhood map
What this means for you Summary
Snapshot
- This is a 3-bed/2.0-bath single-family listed at $175k.
Deal economics
- At list price, monthly cash flow is $-37 ($-444/yr) — negative.
- To cash-flow at today's rent, offer at most $168k (3.7% below list).
- To meet the 1% rule (rent ≥ 1% of price), the offer needs to be $152k (13.3% below list).
- Recommended offer: $152k (13.3% below list) — sets the bar for 1% rule.
Location & tenants
- Location reads 80/100 on livability (#37 in TX, #1,749 nationally) — a professional / high-income tenant draw. Strengths: commute A+, cost of living A+, housing A+; Watch: employment C-, crime F.
- Lubbock ISD (urban): math 36% / reading 39% proficiency, ranked #481 of 826 in TX (top 58%) — families likely to look elsewhere, expect single-tenant / working-renter base with shorter leases; 60% free/reduced lunch — lower-income household profile, screen leases tightly.
- Zoned schools: Roberts El (math 56% / reading 50%, grade C, #705 of 4,322 statewide, top 17%, 535 students, 79% FRL); Atkins Middle (math 24% / reading 33%, grade F, #1,122 of 1,662 statewide, top 69%, 542 students, 87% FRL); Monterey H S (math 28% / reading 37%, grade F, #1,029 of 1,632 statewide, top 64%, 2,114 students, 72% FRL) — zoned schools average 79% FRL vs 60% district-wide (19 pts higher); higher-poverty schools than district average — tighter screening recommended.
- Market conditions: Rents rising (+2.1%/yr); 663 active listings in the ZIP; 40 comparable units currently listed for rent nearby; rentals at typical pace (median 21d on market — plan ~3-4 weeks tenant-placement turnaround); solid renter incomes; 2,219 units permitted in Lubbock County in 2024 (252 in 5+ unit buildings).
Forward outlook
- Local home prices are declining (-3.0%/yr); year-one equity from $1k of loan paydown is wiped out by about $5k of value loss. Plan a longer hold.
- Lubbock County population projected at +39% by 2050 — long-run rental-demand tailwind backs the buy-and-hold thesis.
Negotiation context
- Only 4 days on market — expect competitive offers; lowballing is unlikely to land.
Risks & watch-outs
- Climate carrying-cost: extreme-heat days projected 7→20/yr by 2055 (HVAC capex compounding) — expect insurance premiums to compound above CPI over the hold.
Questions for the listing agent
- What do current leases actually rent for vs. the listed asking? Can we see a recent rent roll and the last 12 months of T-12 income?
- Is there a deadline driving the sale (1031 exchange, divorce, estate, relocation)? That informs how much negotiation room exists.
- Schools are D-rated, which usually means shorter tenancies and higher turnover. Who's the typical renter profile here, and what's been the actual vacancy rate?
- Crime grade is F in this area — have there been break-ins, vandalism, or insurance claims at this property in the last 3 years? What carrier currently insures it and at what premium?
- The area grade is low — what's the realistic commute time and amenity access for the typical tenant pool here? Any planned neighborhood developments (good or bad) we should know about?
- What's the average days-on-market for RENTAL listings here right now (not sales)? A rising rental-DOM trend means longer vacancies and softer asking-rent achievability than the comps imply.
- What's the recent tenant-quality profile in this submarket — average credit score on applications, eviction rate, late-payment / NSF rate, and stable-employment percentage? A property-management company in the area should have these aggregated.
- How much new for-sale + rental construction is in the pipeline within 1–3 miles? Heavy new supply typically softens prices + rents 12–24 months out; constrained supply supports both.
Investment metrics
- 1% rule
- 0.87% ✗
- Cap rate
- 6.04%
- Cash-on-cash
- -0.91%
- DSCR
- 0.96
- GRM
- 9.6
CMA / ARV
No comps found within radius.
Projected returns pro-forma
-3.0% appreciation · 2.13% rent growth · sell at horizon
- IRR
- -18.8%
- Equity multiple
- 0.35×
- Total profit
- $-31,993
- Equity at exit
- $26,093
- IRR
- -13.1%
- Equity multiple
- 0.26×
- Total profit
- $-36,046
- Equity at exit
- $15,131
Cash invested: $49,000 (down + closing). Projections, not guarantees.
Landlord ↔ Tenant lean methodology
- Overall (STATE)
- 87 Strongly Landlord-Friendly
- State Texas
- 87 Strongly Landlord-Friendly · R+5
- County
- — inherits STATE
- City
- — inherits STATE
ZIP-level market 79423
- Rents YoY
- 2.1%
- Active inventory
- 663
- Price-to-rent
- 9.6×
Monthly cashflow live
- Estimated rent
- $1,518 high interval (Pro) →
- Mortgage (P&I)
- −$918
- Tax from tax record
- −$245 /mo · $2,944/yr
- Insurance
- −$73
- HOA
- −$0
- Vacancy / Maint / Mgmt
- −$319
- Net cashflow
- $-37
Break-even live
UW: 25.0% down · 7.5% · 30yr · 1.5% tax · 5.0% vac · 8.0% maint · 8.0% mgmt
Financing live
Cash to close
- Down payment
- $43,750
- Closing costs
- $5,250
- Reserves months
- —
- Total cash needed
- —
Loan-product check · same deal, 3 products live
Conventional
25% down · 7.5% · 30yr
- Down + closing
- —
- Monthly P&I
- —
- Monthly cashflow
- —
- DSCR
- —
- Eligible?
- —
Personal DTI + credit; lowest rate.
DSCR
20% down · 8.5% · 30yr
- Down + closing
- —
- Monthly P&I
- —
- Monthly cashflow
- —
- DSCR
- —
- Eligible?
- —
No personal income docs; deal must DSCR.
Hard money
10% down · 12.0% · 12mo
- Down + closing
- —
- Monthly P&I
- —
- Monthly cashflow
- —
- DSCR
- —
- Eligible?
- —
Short-term bridge; refi at stabilization.
Rent comps 40 comps
| Address | Beds | Baths | Sqft | Rent | $/sqft | DOM | Units | Dist |
|---|---|---|---|---|---|---|---|---|
| 9803 Avenue V Unit A Lubbock, TX | 3.0 | 2.0 | 1500 | $1,500 | $1.00 | 21d | 1 | 0.17mi |
| 9702 Avenue U Lubbock, TX | 3.0 | 2.0 | 1265 | $1,195 | $0.94 | 43d | 1 | 0.18mi |
| 9803 Uvalde Ave Unit A Lubbock, TX | 2.0 | 2.0 | 1474 | $1,425 | $0.97 | 13d | 1 | 0.21mi |
| 2204 93rd St Lubbock, TX | 3.0 | 2.0 | 1258 | $1,325 | $1.05 | 13d | 1 | 0.26mi |
| 2415 93rd St Lubbock, TX | 3.0 | 2.0 | 1692 | $1,650 | $0.98 | 21d | 1 | 0.37mi |
| 2022 102nd St Unit B Lubbock, TX | 3.0 | 2.0 | 1500 | $1,550 | $1.03 | 13d | 1 | 0.39mi |
| 2011 100th St Lubbock, TX | 4.0 | 2.0 | 1698 | $1,750 | $1.03 | 13d | 1 | 0.40mi |
| 10317 Vernon Dr Lubbock, TX | 3.0 | 2.0 | 1786 | $2,800 | $1.57 | 21d | 1 | 0.51mi |
| 2218 88th St Lubbock, TX | 3.0 | 2.0 | 1311 | $1,450 | $1.11 | 43d | 1 | 0.55mi |
| 1717 102nd St Unit A Lubbock, TX | 3.0 | 2.0 | 1407 | $1,550 | $1.10 | 21d | 1 | 0.57mi |
| 8606 Avenue V Unit V Lubbock, TX | 2.0 | 2.0 | 1025 | $1,075 | $1.05 | 43d | 1 | 0.61mi |
| 2403 87th St Unit B Lubbock, TX | 3.0 | 2.0 | 1158 | $1,300 | $1.12 | 13d | 1 | 0.61mi |
| 2401 87th St Unit A Lubbock, TX | 3.0 | 2.0 | 1000 | $1,125 | $1.12 | 13d | 1 | 0.62mi |
| 1702 102nd St Lubbock, TX | 3.0 | 2.0 | 1487 | $1,499 | $1.01 | 21d | 1 | 0.64mi |
| 1705 102nd St Lubbock, TX | 3.0 | 2.0 | 1487 | $1,499 | $1.01 | 43d | 1 | 0.64mi |
| 2303 84th St Lubbock, TX | 3.0 | 1.5 | 1128 | $1,100 | $0.98 | 21d | 1 | 0.77mi |
| 8214 Vernon Ave Unit B Lubbock, TX | 2.0 | 1.0 | 928 | $1,100 | $1.19 | 21d | 1 | 0.80mi |
| 2530 107th Dr Lubbock, TX | 3.0 | 2.0 | 1265 | $1,449 | $1.15 | 43d | 1 | 0.81mi |
| 8217 Avenue U Lubbock, TX | 1.0–2.0 | 1.0–2.0 | 873 | $1,570 | $1.80 | 13d | 28 | 0.84mi |
| 3101 99th St Unit 1 Lubbock, TX | 3.0 | 2.0 | 1694 | $1,350 | $0.80 | 43d | 1 | 0.85mi |
| 2523 110th St Lubbock, TX | 3.0 | 2.0 | 1127 | $1,500 | $1.33 | 43d | 1 | 0.96mi |
| 2501 111th St Lubbock, TX | 3.0 | 2.0 | 1365 | $1,475 | $1.08 | 21d | 1 | 0.96mi |
| 8108 Sherman Ave Lubbock, TX | 3.0 | 2.0 | 1306 | $1,400 | $1.07 | 44d | 1 | 0.98mi |
| 2518 111th St Lubbock, TX | 3.0 | 2.0 | 1400 | $1,450 | $1.04 | 21d | 1 | 0.98mi |
| 2510 112th St Unit A Lubbock, TX | 3.0 | 2.0 | 1365 | $1,475 | $1.08 | 21d | 1 | 1.01mi |
| 2909 106th St Lubbock, TX | 4.0 | 2.0 | 1646 | $1,750 | $1.06 | 21d | 1 | 1.03mi |
| 2612 81st St Unit B Lubbock, TX | 2.0 | 2.0 | 1150 | $1,100 | $0.96 | 43d | 1 | 1.09mi |
| 1606 82nd St Lubbock, TX | 1.0–2.0 | 1.0–2.0 | 843 | $1,580 | $1.87 | 13d | 16 | 1.11mi |
| 8219 Elkridge Ave Lubbock, TX | 3.0 | 2.0 | 1405 | $1,475 | $1.05 | 43d | 1 | 1.12mi |
| 8216 Elkridge Ave Lubbock, TX | 3.0 | 2.0 | 1412 | $1,550 | $1.10 | 21d | 1 | 1.16mi |
| 1805 79th Pl Lubbock, TX | 3.0 | 2.0 | 1284 | $1,375 | $1.07 | 43d | 1 | 1.17mi |
| 2623 113th St Lubbock, TX | 3.0 | 2.0 | 1608 | $1,599 | $0.99 | 13d | 1 | 1.17mi |
| 1512 82nd St Unit B Lubbock, TX | 2.0 | 1.0 | 900 | $750 | $0.83 | 21d | 1 | 1.18mi |
| 1625 79th Pl Lubbock, TX | 3.0 | 2.0 | 1541 | $1,650 | $1.07 | 44d | 1 | 1.19mi |
| 1508 82nd St Unit A Lubbock, TX | 2.0 | 1.0 | 960 | $750 | $0.78 | 43d | 1 | 1.20mi |
| 1940 77th St Lubbock, TX | 3.0 | 2.0 | 1700 | $1,500 | $0.88 | 43d | 1 | 1.28mi |
| 3102 110th St Unit B Lubbock, TX | 3.0 | 2.0 | 1200 | $1,250 | $1.04 | 21d | 1 | 1.28mi |
| 3101 110th St Unit A Lubbock, TX | 3.0 | 2.0 | 1193 | $1,225 | $1.03 | 21d | 1 | 1.30mi |
| 3106 110th St Lubbock, TX | 3.0 | 2.0 | 1151 | $1,275 | $1.11 | 13d | 1 | 1.30mi |
| 3108 110th St Lubbock, TX | 3.0 | 2.0 | 1231 | $1,325 | $1.08 | 21d | 1 | 1.31mi |
Listing history 7 events
-
2026-06-10status $175,000 Pending 4 DOM
-
2026-06-09days on market $175,000 Active 4 DOM
-
2026-06-09status $175,000 Active 3 DOM
-
2026-06-05statusdays on market $175,000 Pending 3 DOM
-
2026-06-03days on market $175,000 Active 2 DOM
-
2026-06-01remarks 405-char remark
-
2026-06-01$175,000 Active 1 DOM
ⓘ Source: listings_history table (triggers on properties + properties_extension) + one-shot
backfill from property_details.listing_events for pre-trigger history.
Tax reassessment forecast TX · Resets to sale price
- Current annual tax
- $2,944 · $245/mo
- Projected year-2 tax
- $3,202 · $267/mo
- Expected delta
- +$259/yr (+$22/mo · 8.8%)
ⓘ Screening estimate from a state-policy table — verify with the county assessor before closing.
Climate risk First Street
- Flood 1/10 Low FEMA zone X (unshaded) · 0% chance over 30 yrs
- Wildfire 1/10 Low
- Heat 5/10 Major 7 d/yr ≥99°F today · 20 d/yr by 30 yrs out
- Wind 2/10 Low
- Air quality 2/10 Low 1 unhealthy d/yr today · 1 by 30 yrs out
Nearby sold comps map
Loading sold comps map…
Walkable amenities ~0.75 mi
Loading nearby amenities…
Taxation est. · year 1
- Rental income
- $18,212
- − Mortgage interest
- −$9,803
- − Property taxes
- −$2,944
- − Insurance
- −$875
- − Repairs & maintenance
- −$1,457
- − Management
- −$1,457
- − Depreciation
- −$5,091
- Taxable loss
- −$3,415
- Est. tax savings @ 24.0%
- +$819
- After-tax cash flow
- $375/yr
For passive investors: Depreciation is non-cash, so a rental often shows a tax loss while cash-flowing — sheltering income. Rental losses are passive: they offset passive income freely, and up to $25,000/yr can offset ordinary (W-2) income if you actively participate and your MAGI is under $100k (phasing out to $0 by $150k); unused losses carry forward. On sale, claimed depreciation is recaptured at up to 25%, and gains may owe capital-gains tax (a 1031 exchange can defer both). Figures are a year-1 estimate at your 24.0% rate — not tax advice; consult a CPA.
Schools (NCES district)
- District
- Lubbock ISD
- NCES district ID
- 4828500
- Math proficiency
- 36% ▼ -8.00%
- Reading proficiency
- 39% ▼ -1.00%
- Median HH income
- $39,820
- Composite
- 31.44/100
- National rank
- #5984
- State rank
- #481 of 826 in TX
Livability — Lubbock
- Score
- 80/100
- State rank
- #37
- US rank
- #1749
Category grades
Schools grade is shown separately in the Schools card above.
Census & demographics
- Census place
- Lubbock, TX
- County
- Lubbock County · 293,542 people
- City population
- 283,030
- Metro
- Lubbock, TX
- Population (ZIP)
- 46,998
- Household income
- $84,933
- Rent vs Own
- Severe rent burden
- 1385.0
Population outlook (Lubbock County) Hauer SSP2
- Today (2025)
- 345,960 people
- By 2030
- 371,449 · +7.4%
- By 2040
- 424,539 · +22.7%
- By 2050
- 481,150 · +39.1%
- By 2075
- 633,467 · +83.1%
- By 2100
- 746,853 · +115.9%
Race, ethnicity, and origin ACS 2023
- Neighborhood character
- Majority White (61%)
- Race & ethnicity
- White 61% Hispanic / Latino 31% Two or more races 15% Black 4% Asian 2%
- Hispanic origin (detail)
- Mexican 26%
- Common ancestry
- Slovak 1% Italian 1% Serbian 1%
- Foreign-born
- 5% · Canada
- Languages at home
- 84% English-only · Spanish 13% Tagalog/Filipino 1% Other Asian/Pacific 1%
Political lean MEDSL · Lubbock
- 2024 margin
- Solid R (+39.5) · D 29.7% · R 69.2% · Other 1.0%
- 2008→2024 swing
- -2.8pp toward R · 2008: -36.7pp · 2024: -39.5pp
- All cycles
- 2024: R+39.5 2020: R+32.2 2016: R+38.4 2012: R+40.9 2008: R+36.7
Not yet ingested
- Civics
- —
Market trends
- HPI YoY
- ▼ -155.00%
- Current HPI
- 213.6491
- Rent YoY
- ▲ 2.13%
- Metro
- Lubbock, TX
- State GDP YoY
- ▲ 3.95%
- F500 in state
- 110
Industry mix (Fortune 500 HQ in TX)
| Industry | F500 HQs | Revenue |
|---|---|---|
| Energy | 16 | $1,198B |
|
||
| Technology | 5 | $198B |
|
||
| Engineering / Construction | 4 | $72B |
|
||
| Energy Services | 3 | $60B |
|
||
| Utilities | 3 | $41B |
|
||
| Healthcare | 2 | $330B |
|
||
Price history
4 events — show timeline
- 2026-05-20 Listed $175,000 LARMLS
- 2010-10-26 Sold (Public Records) — Public Records
- 2007-05-31 Sold (Public Records) — Public Records
- 1999-09-03 Sold (Public Records) — Public Records
Property tax history
+2.3%/yrLatest (2025): $2,944 · -2.6% YoY. Source: county tax records.
Cash-flow waterfall
monthlySold comps — $/sqft
last 12 mo · ≤1 miLoading sold comps…