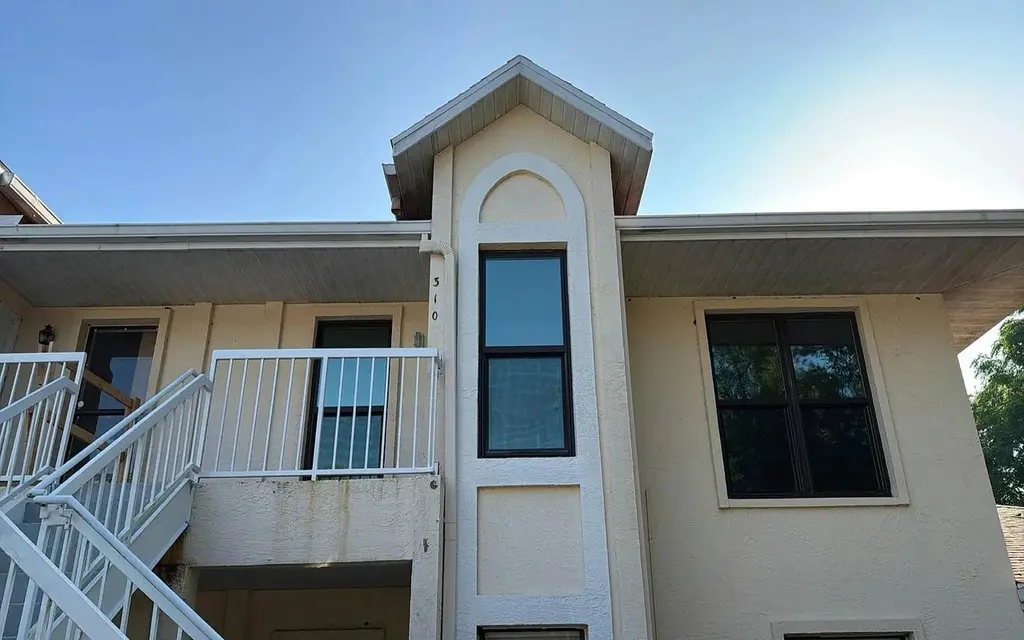
310 Knottwood Ct · Sun City Center, FL
Flood risk 1/10 · Minimal
- FEMA flood zone
- X (unshaded)
- Chance of flooding over 30 yrs
- 0.0%
- Est. flood insurance / yr
- $507 – $1,088
Fire risk 3/10 · Minor
- Est. fire insurance / yr
- $947 – $1,759
Heat risk 10/10 · Severe
- Hot days now (above 109°F)
- 7 days/yr
- Hot days in 30 yrs
- 25 days/yr
Wind risk 9/10 · Severe
- Chance of severe wind over 30 yrs
- 99.0%
Air-quality risk 3/10 · Minor
- Unhealthy air days now
- 3 days/yr
- Unhealthy air days in 30 yrs
- 3 days/yr
Risk factors via First Street. Map © Google.
Why this score? — see what drove the D+ grade
The composite is a weighted blend of 9 inputs, each scored 0–100. Each bar is that input's sub-score; the figure is the points it added to the 100-point composite (weight × sub-score).
- Cash flow +15.0/30.0
- ARV discount +7.5/15.0
- 1% rule +5.0/10.0
- DSCR +5.0/10.0
- Schools +4.2/10.0
- Livability +3.9/5.0
- Appreciation +3.4/10.0
- Rent growth +3.2/5.0
- Condition / age +2.5/5.0
$5,000
🖨 Deal sheet (PDF) 📄 Offer letter ✓ Due diligence
Listing remarks
Foreclosure Auction Ends June 08, 2026 at 10:00 AM EST. Discover this inviting 2-bedroom, 2-bathroom single-family home, offering a great opportunity in the desirable Sun City Center area. The list price is the opening bid for the online auction. Sold As-is. Explore more details and submit your bid through Federa.
Key facts
- Built 1988
- Listed 10 days
Property features AI
Exterior
- Security: Gated community with security gate
- Home design: Condominium; Residential property; Single-story
- Exterior features: Planned Development (PD) zoning
Interior
- Bathrooms: 2 full bathrooms
- Interior features: One-story interior
Neighborhood map
What this means for you Summary
Snapshot
- This is a 2-bed/2.0-bath condo listed at $5k.
Deal economics
- At list price, monthly cash flow is $1k ($15k/yr) — positive.
- The deal already cash-flows at list — no discount required.
- Meets the 1% rule at list price ($2k rent vs $5k).
Location & tenants
- Location reads 78/100 on livability (#178 in FL, #2,736 nationally) — a middle-class / working-renter tenant base. Strengths: housing A+, health & safety A+, crime B+; Watch: schools D+, amenities F.
- Hillsborough (suburban): math 47% / reading 50% proficiency, ranked #41 of 73 in FL (top 56%) — families likely to look elsewhere, expect single-tenant / working-renter base with shorter leases.
- Market conditions: Rents rising (+2.6%/yr); 602 active listings in the ZIP; 40 comparable units currently listed for rent nearby; rentals at typical pace (median 25d on market — plan ~3-4 weeks tenant-placement turnaround); 9,053 units permitted in Hillsborough County in 2024 (4,555 in 5+ unit buildings).
Forward outlook
- Local home prices are declining (-3.0%/yr); year-one equity from $35 of loan paydown is wiped out by about $150 of value loss. Plan a longer hold.
- Hillsborough County population projected at +37% by 2050 — long-run rental-demand tailwind backs the buy-and-hold thesis.
- At projected returns (-3.0% appreciation + 2.6% rent growth), your $1k cash investment doubles in ~1 year — after that, you're playing with house money.
Negotiation context
- Only 10 days on market — expect competitive offers; lowballing is unlikely to land.
- 2 sale attempts since 2y ago with the ask held roughly flat each time — persistent listings suggest the price (not the market) is what's stuck; bring a comps-based counter.
Risks & watch-outs
- Climate carrying-cost: severe wind risk, 99% chance of damaging wind over 30y; extreme-heat days projected 7→25/yr by 2055 (HVAC capex compounding) — expect insurance premiums to compound above CPI over the hold.
Questions for the listing agent
- Any open or pending special assessments — roof, HVAC, plumbing, elevator, façade? What's the per-unit balance and payoff schedule, and is the seller paying it off at close or rolling it to the buyer?
- Is there a deadline driving the sale (1031 exchange, divorce, estate, relocation)? That informs how much negotiation room exists.
- Schools are D-rated, which usually means shorter tenancies and higher turnover. Who's the typical renter profile here, and what's been the actual vacancy rate?
- The area grade is low — what's the realistic commute time and amenity access for the typical tenant pool here? Any planned neighborhood developments (good or bad) we should know about?
- What's the average days-on-market for RENTAL listings here right now (not sales)? A rising rental-DOM trend means longer vacancies and softer asking-rent achievability than the comps imply.
- What's the recent tenant-quality profile in this submarket — average credit score on applications, eviction rate, late-payment / NSF rate, and stable-employment percentage? A property-management company in the area should have these aggregated.
- How much new apartment / multifamily construction is in the pipeline within 1–3 miles? Heavy new supply (>2% of stock underway) typically softens rents 12–24 months out; light construction supports rent growth.
Investment metrics
- 1% rule
- 33.56% ✓
- Cap rate
- 316.11%
- Cash-on-cash
- 1106.49%
- DSCR
- 50.23
- GRM
- 0.2
CMA / ARV
No comps found within radius.
Projected returns pro-forma
-3.0% appreciation · 2.65% rent growth · sell at horizon
- IRR
- —
- Equity multiple
- 58.75×
- Total profit
- $80,845
- Equity at exit
- $746
- IRR
- —
- Equity multiple
- 125.27×
- Total profit
- $173,972
- Equity at exit
- $432
Cash invested: $1,400 (down + closing). Projections, not guarantees.
Landlord ↔ Tenant lean methodology
- Overall (STATE)
- 87 Strongly Landlord-Friendly
- State Florida
- 87 Strongly Landlord-Friendly · R+3
- County
- — inherits STATE
- City
- — inherits STATE
ZIP-level market 33573
- Home prices YoY
- -1.2%
- Rents YoY
- 2.6%
- Active inventory
- 602
- Price-to-rent
- 0.2×
Monthly cashflow live
- Estimated rent
- $1,678 high interval (Pro) →
- Mortgage (P&I)
- −$26
- Tax est. 1.5%
- −$6 /mo · $75/yr
- Insurance
- −$2
- HOA
- −$0
- Vacancy / Maint / Mgmt
- −$352
- Net cashflow
- $1,291
Break-even live
Sensitivity live
| Price | -10% $1,294 | -5% $1,293 | +0% $1,291 | +5% $1,289 | +10% $1,287 |
|---|---|---|---|---|---|
| Rent | -10% $1,158 | -5% $1,225 | +0% $1,291 | +5% $1,357 | +10% $1,423 |
| Rate | -1.0pp $1,293 | -0.5pp $1,292 | base $1,291 | +0.5pp $1,290 | +1.0pp $1,288 |
UW: 25.0% down · 7.5% · 30yr · 1.5% tax · 5.0% vac · 8.0% maint · 8.0% mgmt
Financing live
Cash to close
- Down payment
- $1,250
- Closing costs
- $150
- Reserves months
- —
- Total cash needed
- —
Loan-product check · same deal, 3 products live
Conventional
25% down · 7.5% · 30yr
- Down + closing
- —
- Monthly P&I
- —
- Monthly cashflow
- —
- DSCR
- —
- Eligible?
- —
Personal DTI + credit; lowest rate.
DSCR
20% down · 8.5% · 30yr
- Down + closing
- —
- Monthly P&I
- —
- Monthly cashflow
- —
- DSCR
- —
- Eligible?
- —
No personal income docs; deal must DSCR.
Hard money
10% down · 12.0% · 12mo
- Down + closing
- —
- Monthly P&I
- —
- Monthly cashflow
- —
- DSCR
- —
- Eligible?
- —
Short-term bridge; refi at stabilization.
Rent comps 40 comps
| Address | Beds | Baths | Sqft | Rent | $/sqft | DOM | Units | Dist |
|---|---|---|---|---|---|---|---|---|
| 323 Knottwood Ct Sun City Center, FL | 1.0 | 1.0 | 908 | $1,290 | $1.42 | 25d | 1 | 0.05mi |
| 323 Knottwood Ct #1 Sun City Center, FL | 1.0 | 1.0 | 908 | $1,090 | $1.20 | 5d | 1 | 0.05mi |
| 301 Kings Blvd #138 Sun City Center, FL | 1.0 | 1.5 | 1020 | $1,800 | $1.76 | 22d | 1 | 0.22mi |
| 1902 Dandridge St #12 Sun City Center, FL | 1.0 | 1.5 | 800 | $1,495 | $1.87 | 15d | 1 | 0.26mi |
| 409 Feltham Trl Unit B Sun City Center, FL | 2.0 | 2.0 | 984 | $1,650 | $1.68 | 25d | 1 | 0.26mi |
| 403 Finchley Ct Unit B Sun City Center, FL | 2.0 | 2.0 | 960 | $2,000 | $2.08 | 25d | 1 | 0.31mi |
| 302 Canton Ct #62 Sun City Center, FL | 1.0 | 1.5 | 800 | $1,575 | $1.97 | 18d | 1 | 0.31mi |
| 704 Tremont Greens Ln Unit 107 Sun City Center, FL | 2.0 | 2.0 | 974 | $1,700 | $1.75 | 25d | 1 | 0.34mi |
| 306 Fowling Ct Sun City Center, FL | 2.0 | 2.0 | 960 | $1,700 | $1.77 | 25d | 1 | 0.38mi |
| 1814 Foxhunt Dr Unit A Sun City Center, FL | 1.0 | 1.5 | 800 | $1,475 | $1.84 | 25d | 1 | 0.40mi |
| 1901 Andover Way #38 Sun City Center, FL | 1.0 | 1.5 | 800 | $1,495 | $1.87 | 25d | 1 | 0.40mi |
| 201 Bedford Trl Unit F128 Sun City Center, FL | 2.0 | 2.0 | 960 | $1,275 | $1.33 | 25d | 1 | 0.40mi |
| 202 Bedford Trl #99 Sun City Center, FL | 1.0 | 1.0 | 800 | $1,500 | $1.88 | 5d | 1 | 0.42mi |
| 101 Cambridge Trl Sun City Center, FL | 1.0–2.0 | 1.5–2.0 | 880 | $1,650 | $1.88 | 12d | 1 | 0.44mi |
| 1906 Canterbury Ln #26 Sun City Center, FL | 2.0 | 2.0 | 1200 | $1,750 | $1.46 | 0d | 1 | 0.46mi |
| 201 Bedford St #95 Sun City Center, FL | 1.0 | 1.5 | 800 | $1,450 | $1.81 | 15d | 1 | 0.46mi |
| 201 Kings Blvd #19 Sun City Center, FL | 1.0 | 1.5 | 800 | $1,495 | $1.87 | 25d | 1 | 0.46mi |
| 2202 Clubhouse Dr #169 Sun City Center, FL | 2.0 | 2.0 | 984 | $1,450 | $1.47 | 5d | 1 | 0.51mi |
| 2202 Clubhouse Dr #187 Sun City Center, FL | 1.0 | 1.5 | 800 | $1,550 | $1.94 | 25d | 1 | 0.51mi |
| 1802 Bedford Ln Sun City Center, FL | 1.0–2.0 | 2.0 | 952 | $1,800 | $1.89 | 11d | 2 | 0.51mi |
| 1802 Bedford Ter #182 Sun City Center, FL | 1.0 | 1.5 | 800 | $1,400 | $1.75 | 18d | 1 | 0.53mi |
| 1802 Bedford Ter #182 Sun City Center, FL | 1.0 | 1.5 | 960 | $1,375 | $1.43 | 22d | 1 | 0.53mi |
| 110 Gloucester Blvd Sun City Center, FL | 2.0 | 2.0 | 1136 | $1,950 | $1.72 | 25d | 1 | 0.56mi |
| 2345 Glenmore Cir Unit 294 Sun City Center, FL | 2.0 | 2.0 | 984 | $1,500 | $1.52 | 25d | 1 | 0.59mi |
| 2117 Harleston Pl Unit 2117 Sun City Center, FL | 2.0 | 2.0 | 1448 | $2,500 | $1.73 | 25d | 1 | 0.93mi |
| 1103 Villeroy Dr Sun City Center, FL | 3.0 | 2.0 | 1490 | $2,500 | $1.68 | 11d | 1 | 0.95mi |
| 1415 Langley Dr Sun City Center, FL | 2.0 | 2.0 | 1359 | $1,850 | $1.36 | 25d | 1 | 0.95mi |
| 1528 Chevy Chase Dr Sun City Center, FL | 2.0 | 2.0 | 1346 | $2,000 | $1.49 | 25d | 1 | 0.98mi |
| 207 Islip Way Sun City Center, FL | 2.0 | 1.5 | 992 | $1,500 | $1.51 | 18d | 1 | 0.99mi |
| 2124 Hailstone Cir Sun City Center, FL | 2.0 | 2.0 | 1000 | $1,800 | $1.80 | 25d | 1 | 1.00mi |
| 2006 Hampstead Cir Unit N/A Sun City Center, FL | 2.0 | 2.0 | 1474 | $1,800 | $1.22 | 25d | 1 | 1.06mi |
| 1301 Warwick Ct Unit 1301 Sun City Center, FL | 1.0 | 1.0 | 1102 | $1,575 | $1.43 | 25d | 1 | 1.12mi |
| 1005 Rickenbacker Dr Sun City Center, FL | 2.0 | 1.0 | 1224 | $1,595 | $1.30 | 3d | 1 | 1.14mi |
| 2102 Hereford Dr #513 Sun City Center, FL | 2.0 | 2.0 | 1000 | $1,500 | $1.50 | 25d | 1 | 1.15mi |
| 1309 Fairway Greens Dr Sun City Center, FL | 3.0 | 2.0 | 1420 | $1,750 | $1.23 | 25d | 1 | 1.23mi |
| 1256 Corinth Greens Dr Sun City Center, FL | 2.0 | 2.0 | 1450 | $2,150 | $1.48 | 15d | 1 | 1.30mi |
| 2052 Inverness Greens Dr Sun City Center, FL | 2.0 | 2.0 | 1376 | $2,100 | $1.53 | 25d | 1 | 1.32mi |
| 1104 Desert Hills Dr Sun City Center, FL | 2.0 | 2.0 | 1383 | $1,825 | $1.32 | 18d | 1 | 1.44mi |
| 1161 Jameson Greens Dr Sun City Center, FL | 3.0 | 2.0 | 1292 | $1,900 | $1.47 | 25d | 1 | 1.44mi |
| 717 Indian Wells Ave Sun City Center, FL | 2.0 | 2.0 | 1264 | $1,595 | $1.26 | 25d | 1 | 1.49mi |
HOA detail condo
- Monthly dues
- $0 · $0/yr
- Assessments
- None detected in remarks — confirm with the listing agent.
Listing history 10 events
-
2026-06-07days on market $5,000 Active 10 DOM
-
2026-06-04days on market $5,000 Active 7 DOM
-
2026-06-03days on market $5,000 Active 6 DOM
-
2026-06-02days on market $5,000 Active 5 DOM
-
2026-06-01days on market $5,000 Active 4 DOM
-
2026-05-31days on market $5,000 Active 3 DOM
-
2026-05-28$5,000 Active
-
2025-03-19historical
-
2024-09-20$160,000 Active
-
1988-11-01soldstatus $59,500
ⓘ Source: listings_history table (triggers on properties + properties_extension) + one-shot
backfill from property_details.listing_events for pre-trigger history.
Climate risk First Street
- Flood 1/10 Low FEMA zone X (unshaded) · 0% chance over 30 yrs
- Wildfire 3/10 Moderate
- Heat 10/10 Extreme 7 d/yr ≥109°F today · 25 d/yr by 30 yrs out
- Wind 9/10 Extreme 99% chance of damaging wind over 30 yrs
- Air quality 3/10 Moderate 3 unhealthy d/yr today · 3 by 30 yrs out
Nearby sold comps map
Loading sold comps map…
Walkable amenities ~0.75 mi
Loading nearby amenities…
Taxation est. · year 1
- Rental income
- $20,134
- − Mortgage interest
- −$280
- − Property taxes
- −$75
- − Insurance
- −$25
- − Repairs & maintenance
- −$1,611
- − Management
- −$1,611
- − Depreciation
- −$145
- Taxable income
- $16,387
- Est. tax owed @ 24.0%
- −$3,933
- After-tax cash flow
- $11,558/yr
For passive investors: Depreciation is non-cash, so a rental often shows a tax loss while cash-flowing — sheltering income. Rental losses are passive: they offset passive income freely, and up to $25,000/yr can offset ordinary (W-2) income if you actively participate and your MAGI is under $100k (phasing out to $0 by $150k); unused losses carry forward. On sale, claimed depreciation is recaptured at up to 25%, and gains may owe capital-gains tax (a 1031 exchange can defer both). Figures are a year-1 estimate at your 24.0% rate — not tax advice; consult a CPA.
Schools (NCES district)
- District
- Hillsborough
- NCES district ID
- 1200870
- Math proficiency
- 47% ▼ -8.00%
- Reading proficiency
- 50% ▼ -4.00%
- Median HH income
- $50,622
- Composite
- 41.6/100
- National rank
- #3435
- State rank
- #41 of 73 in FL
Livability — Sun City Center
- Score
- 78/100
- State rank
- #178
- US rank
- #2736
Category grades
Schools grade is shown separately in the Schools card above.
Census & demographics
- Census place
- Sun City Center, FL
- County
- Hillsborough County · 1,540,968 people
- City population
- 35,362
- Metro
- Tampa-St. Petersburg-Clearwater, FL
- Population (ZIP)
- 35,362
- Household income
- $72,834
- Rent vs Own
- Severe rent burden
- 1382.0
Population outlook (Hillsborough County) Hauer SSP2
- Today (2025)
- 1,607,022 people
- By 2030
- 1,733,968 · +7.9%
- By 2040
- 1,979,565 · +23.2%
- By 2050
- 2,203,427 · +37.1%
- By 2075
- 2,667,893 · +66.0%
- By 2100
- 2,891,558 · +79.9%
Race, ethnicity, and origin ACS 2023
- Neighborhood character
- Predominantly White (73%)
- Race & ethnicity
- White 73% Hispanic / Latino 13% Two or more races 11% Black 10% Asian 1%
- Hispanic origin (detail)
- Mexican 1% Puerto Rican 6% Cuban 2%
- Common ancestry
- Romanian 3% Lithuanian 3% Slovak 2%
- Foreign-born
- 8% · Canada, Vietnam
- Languages at home
- 86% English-only · Spanish 10% French/Haitian/Cajun 1% German/W. Germanic 1%
Political lean MEDSL · Hillsborough
- 2024 margin
- Toss-up / Even · D 47.8% · R 50.9% · Other 1.3%
- 2008→2024 swing
- -10.2pp toward R · 2008: 7.1pp · 2024: -3.1pp
- All cycles
- 2024: R+3.1 2020: D+6.9 2016: D+6.8 2012: D+6.7 2008: D+7.1
Not yet ingested
- Civics
- —
Market trends
- HPI YoY
- ▼ -3.27%
- Current HPI
- 272.9767
- Rent YoY
- ▲ 2.65%
- Metro
- Tampa-St. Petersburg-Clearwater, FL
- State GDP YoY
- ▲ 3.28%
- F500 in state
- 36
Industry mix (Fortune 500 HQ in FL)
| Industry | F500 HQs | Revenue |
|---|---|---|
| Industrial Technology | 2 | $29B |
|
||
| Insurance | 2 | $17B |
|
||
| Retail | 1 | $60B |
|
||
| Technology Distribution | 1 | $58B |
|
||
| Homebuilding | 1 | $35B |
|
||
| Technology Manufacturing | 1 | $35B |
|
||
Price history
-91.6% since first listed4 events — show timeline
- 2026-05-28 Listed $5,000 NFMLS
- 2025-03-19 Listing Removed — Stellar MLS as Distributed by MLS Grid
- 2024-09-20 Listed $160,000 Stellar MLS as Distributed by MLS Grid
- 1988-11-01 Sold (Public Records) $59,500 Public Records
Property tax history
+3.6%/yrLatest (2025): $343 · +11.9% YoY. Source: county tax records.
Cash-flow waterfall
monthlySold comps — $/sqft
last 12 mo · ≤1 miLoading sold comps…